Managing the yield gap to achieve your yield potential on the western Downs
Managing the yield gap to achieve your yield potential on the western Downs
Author: Simon Fritsch & Peter Wylie, Agripath Pty Ltd | Date: 31 Jul 2015
Take home message
Good crop yields result from storing water in the soil and converting this water and the in-crop rainfall efficiently into grain. Water Use Efficiency (WUE) Benchmarks can help to make better decisions on the use of soil moisture by developing yield estimates. They can be also used to compare yields or examine them in hindsight to check whether the crop has performed well at turning water into grain. More accuracy can be derived by using WUE benchmarks which are set for low, medium and high yields.
There are many aspects of farming systems which improve moisture storage and the water use efficiency of the crops being produced. Doing a good job with controlled traffic and zero-tillage will help maximise water storage. A sound rotation can help to minimise weeds, pests and diseases and boost farm yields and profits.
Good water use efficiency also needs weed control and optimum fertiliser use. Farm operations need to be done well and on time. This requires good labour management and finance to optimise inputs and keep machinery up to date.
When all these aspects are put together well, it is likely that the average farm can double profit.
1. Attainable yields
Water Use Efficiency (WUE) benchmarks can be used to derive attainable yield for a location and season. At Roma it should be possible to store 116 mm of summer rainfall on average, which added to 22 mm of rainfall left over as harvest soil water, means 138mm is stored in the soil at planting. With 152mm of in-crop rainfall on average, the attainable yield of short fallow wheat is 2.94 t/ha at a target WUE of 11 kg/ha/mm.
Attainable yields for grain sorghum at Roma, are around 3.4 t/ha where water available to the crop is around 315mm and WUE 11kg/ha/mm. Figures shown in Table 1 are shown for a September plant, but this could be higher where sorghum is grown on long fallow with an extra 50mm of water, and where the crop is planted in December or early January to maximise the chance of in-crop rainfall.
Table 1. Attainable yields of wheat and sorghum calculated from WUE and by APSIM
| Wheat May 30 Plant |
Planting soil water | In-crop Jun -mid-Oct | Harvest soil water* | WUE kg/ha/mm | Yield** average | APSIM 150 mm PAWC # | APSIM 180 mm PAWC # | |
| High yield | Dalby | 159 | 173 | 30 | 12 | 3.62 | 2.9 | 3.46 |
|---|---|---|---|---|---|---|---|---|
| Medium yield | Goondiwindi | 141 | 176 | 25 | 11.5 | 3.35 | 3.40 | 3.92 |
| Lower yield | Roma | 138 | 152 | 22 | 11.0 | 2.94 | 2.38 | 2.82 |
| Sorghum Sep 30 plant |
Planting soil water | In-crop Oct - mid-Jan | Harvest soil water | WUE kg/ha/mm | Yield average | APSIM 150 mm PAWC | APSIM 180 mm PAWC | |
| High yield | Dalby | 161 | 248 | 40 | 15.5 | 5.72 | 5.80 | 6.14 |
| Medium yield | Goondiwindi | 150 | 203 | 29 | 12 | 3.88 | 3.7 | 4.13 |
| Lower yield | Roma | 147 | 200 | 32 | 11 | 3.46 | 3.55 | 4.32 |
*Average soil water at harvest calculated by APSIM
**Yield calculated from average rainfall data and water use efficiency figures
# Yields modelled using APSIM show attainable yield is higher with increasing soil water capacity
2. Benchmarking yields using local WUE numbers
The French and Schultz model has been widely used in southern Australia to benchmark wheat yield for a given water use, with a target of 20 kg/ha/mm, allowing for 110 mm of soil evaporation. Current varieties and farming practices now produce WUE closer to 25 kg/ha/mm (Sadras and McDonald 2011).
Benchmarks of WUE are improved if soil stored moisture is included in calculations, even if only an estimate. The application CliMate or the model How Wet can be used to estimate soil water, but even better measurements are now being made using EM 38 (Foley 2013). Deducting 110 mm for soil evaporation should be ignored because if winter rainfall and soil evaporation is low the deduction leads to spurious results where WUE is high in a poor yielding year, when in fact it is low due to a low harvest index.
In most years, there is little or no moisture left in the soil at harvest, but when there is spring rainfall, some account should be made of left-over water by adjusting the estimate of in-crop rainfall.
This approach, where evaporation is ignored, is supported by Hunt and Kirkegaard (2011) who say; “It is water use efficiency that is important as a benchmark when reviewing management, not transpiration efficiency”. Doherty et al (2010) and Sadras and McDonald (2012) also conclude that the most practical way of estimating WUE is to subtract soil water at maturity from soil water at sowing and add the rainfall that falls in between. This is what is proposed in this paper as the most appropriate way to use WUE in the Northern Region.
WUE should be more than a single number
The accuracy of using WUE to estimate yield can be improved by using a range, rather than a single number. WUE improves with yield, as a result of a better harvest index. In extremely low yielding situations, the crop has used a lot of the available water growing to the flowering stage and the WUE can be less than a half of the WUE of a high yielding crop. As yield potential improves there is generally better tiller survival, more heads per hectare, more grains per head and higher grain weights. This all serves to improve the WUE.
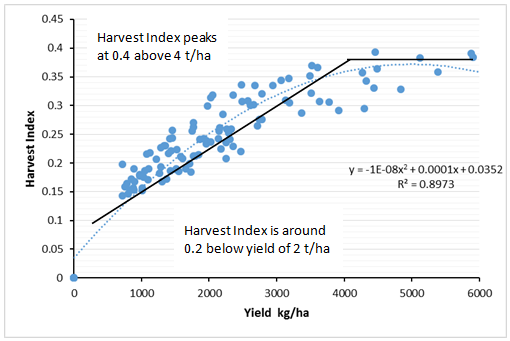
Figure 1. Harvest Index of Wheat at Dalby, over 100 years, modelled by APSIM.
The maximum efficiency of water transpired into biomass is 55 kg/ha/mm, according to French and Schultz (1984). This means the maximum WUE at a harvest index (HI) of 0.2 is 11, a figure which increases to 22 for a harvest index of 0.4. In the French Schultz equation around one third of the growing season rain was assumed to be lost through evaporation, so the WUE, as distinct from transpiration efficiency, would then convert to 7.3 for a HI of 0.2 and rise to 14 for a HI of 0.4.
In practice, in the Northern region, the WUE of wheat increases from around 9 kg/ha/mm where yields are less than 3 t/ha, to 12 kg/ha/mm for yields between 3 and 4 t/ha and is usually above 14 where there are yields exceed 4 t/ha due to a favourable season and high harvest index. (See Figure 2) In cereal crops, harvest index increases with tiller survival, grains per head and grain weight, all of which boost yield and WUE in favourable seasons.
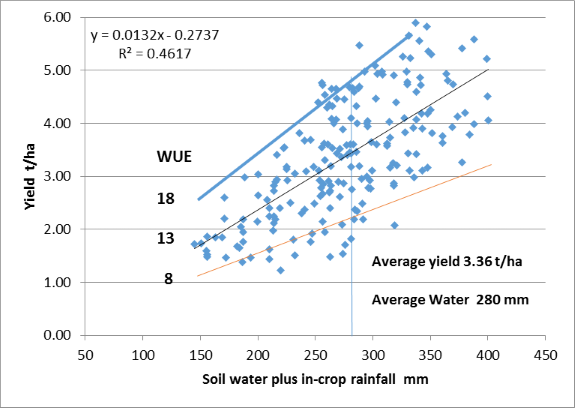
Figure 2. Yield of wheat produced by different amounts of soil water plus in-crop rainfall. Northern Grains Region 2007-2013. Farm plus trial data collated by Agripath.
3. What is an extra 20mm of soil water worth?
The improvement which occurs in water use efficiency with extra soil water, means that as little as 20mm extra can go close to doubling crop profit. This is demonstrated from results of wheat yields (modelled using APSIM) at Dalby and Roma for soils with 150 and 180 mm of plant available water capacity. At Dalby, an extra 27mm of soil water increased WUE from 9.5 to 10.5 kg/ha/mm and yield by 579 kg/ha. At Roma an extra 25 mm increased yield by 442kg/ha, which means an extra 20mm should result in a yield increase of 354 kg/ha.
Table 2. Effect of soil water capacity on water storage and crop yield
|
Soil PAWC mm |
Wheat May 30 Plant | Planting soil water | In-crop Jun - mid-Oct | Harvest soil water | WUE g/ha/mm | Yield average |
| 150 | Dalby | 144 | 188 | 28 | 9.5 | 2885 |
|---|---|---|---|---|---|---|
| 180 | Dalby | 171 | 188 | 29 | 10.5 | 3464 |
| Increase | 27 | 21 | 579 | |||
| 150 | Roma | 133 | 164 | 23 | 8.7 | 2383 |
| 180 | Roma | 158 | 164 | 24 | 9.5 | 2825 |
| Increase | 25 |
|
18 | 442 | ||
APSIM modelling by G. Mclean, DAFF Qld. 2014
Profit would increase from $162/ha to $276/ha with an extra 27mm at Dalby, a rise of 59% and for a yield increase of 0.35 t/ha from an extra 20mm at Roma, profit would rise 65% from $128 to $196/ha. See Table 3.
Table 3. Effect of an extra 20mm of soil water on wheat profit
| Wheat at Dalby | Wheat at Roma | |||
|---|---|---|---|---|
| Average yield | Extra 27 mm | Average yield | Extra 20 mm | |
| Yield (t/ha) | 2.88 | 3.46 | 2.38 | 2.73 |
| Price | 240 | 240 | 240 | 240 |
| Gross $/ha | 691 | 830 | 571 | 656 |
| Fertiliser: | 81 | 97 | 70 | 79 |
| Seed | 30 | 30 | 28 | 28 |
| Fallow sprays | 60 | 60 | 50 | 50 |
| Weeds, Pests | 15 | 15 | 15 | 15 |
| Fuel & Repairs | 52 | 52 | 44 | 44 |
| Harvest costs | 55 | 55 | 50 | 50 |
| Freight & Misc. | 68 | 77 | 73 | 82 |
| Labour | 80 | 80 | 60 | 60 |
| Machinery costs | 88 | 88 | 52 | 52 |
| Total costs | 529 | 554 | 443 | 460 |
| Gross Margin | 162 | 276 | 128 | 196 |
| Gross Margin % | 59% | 170% | 65% | 153% |
Data from Agripath benchmarking
4. Water, Yield and Profit - the important connection
The relationship between wheat yield and water available is shown in Figure 2. In this data, the average yield is 3.36 t/ha from 280mm of soil water and in-crop rainfall – a WUE of 12 kg/ha/mm.
Every disease problem, every mistake with seed, planting or variety selection, or not enough spent on inputs such as weedicide and fertiliser, can cost more than 10% in yield. It is common for three or more of these issues to be dragging down crop yields by some 30% and profit by 50-60%.
Control of crown rot is important for good WUE and yield of wheat. Rotation is important, but if wheat has to be sown after wheat, it should be planted into the middle of the old wheat rows for up to 9% extra yield (Verrell 2014). Varieties of wheat such as Suntop, offer potential to suppress nematode populations and avoid heavy losses from these pests, not only in wheat but in subsequent legume crops. Rotation plans which include some long fallows can pave the way for increased use of residual herbicides to help reduce costs and to better manage glyphosate resistance.
Good crop yields are a result of good planning and implementation of crop production involving a myriad of details, starting with the crop choice and variety, the rotation program and how moisture is stored and used on the farm. Combine this with good planting technology and timeliness, and the right details of fertilisers, weeds, pests and other aspects of crop agronomy and there is potential to substantially improve grain yields and profitability.
5. Adjusting crop sequence to avoid low margin crops
Long fallow crop sequences can sometimes be more profitable than double crops. It is all about the margin left over at the end of selling the crop. There is little point growing a string of low margin crops.
Table 4. Margins from a double-crop sequence compared to a long fallow
| Mung Bean double crop | Sorghum after mung bean | Sorghum on a long fallow | |
| Yield (t/ha) | 0.9 | 2.2 | v3.5 |
|---|---|---|---|
| Price | 540 | 225 | 225 |
| Gross $/ha | 486 | 495 | 787 |
| Fertiliser: | 30 | 48 | 52 |
| Seed | 40 | 28 | 28 |
| Fallow sprays | 40 | 40 | 60 |
| Weeds, Pests | 75 | 45 | 45 |
| Fuel & Repairs | 40 | 42 | 65 |
| Harvest costs | 50 | 50 | 55 |
| Freight & Misc. | 57 | 65 | 95 |
| Labour | 40 | 45 | 65 |
| Machinery costs | 40 | 45 | 65 |
| Total costs | 412 | 408 | 530 |
| Gross Margin | 75 | 87 | 257 |
A double-crop of mung bean with a yield of 0.9 t/ha followed by sorghum yielding 2.2 t/ha might have a combined margin of less than $200/ha. A sorghum crop on a long fallow with a yield of 3.5 t/ha, should have a margin close to $260/ha and could help to improve farm profit. Good margins are important and too much opportunity cropping can result in reduced margins over the longer term.
6. Setting yield estimates for better decisions
Average data of WUE for wheat, sorghum and chickpea and suggested benchmarks at different yield levels are presented in Table 5. Calculation of yield estimates can be done at any time, using these benchmarks, to help make decisions on planting, fertilisers and adjustments to varieties, seeding rates or row spacings.
At Roma, if soil moisture is low at say 80mm, then a low WUE benchmark of 9 kg/ha/m would be used. If the average in-crop rainfall of 152mm is used, the yield estimate is 2.09 t/ha. If moisture was particularly high, at 160 mm, the WUE should be better than 12 kg/ha/mm and yield potential from 312 mm of soil water plus in-crop rainfall would be 3.74 t/ha.
Table 5. Average WUE for various yield levels and suggested benchmarks in the Northern Grains Region (Trial and paddock data collated by Agripath).
| Wheat | Low | Medium | High |
| Yield Range | <2.5 t/ha | 2.5-4 t/ha | >4 t/ha |
|---|---|---|---|
| Average WUE | 9.01 | 11.86 | 15.07 |
| STDEV | 1.87 | 1.92 | 2.04 |
| Benchmark WUE | 9 | 12 | 15 |
| Sorghum | Low | Medium | High |
| Yield Range | <3 t/ha | 3-5 t/ha | >5 t/ha |
| Average value | 8.4 | 11.5 | 15.1 |
| STDEV | 1.64 | 2.13 | 2.60 |
| Benchmark WUE | 9 | 12 | 15 |
| Chickpea | Low | Medium | High |
| Yield Range | <1.5 t/ha | 1.5-2.5 t/ha | >2.5t/ha |
| Average value | 6.55 | 8.55 | 10.46 |
| STDEV | 1.02 | 1.61 | 1.81 |
| Benchmark WUE | 7 | 9 | 11 |
References
- Doherty A. et al. 2010. Quantification of wheat water use efficiency at the shire level in Australia. Crop and Pasture Science, 61, 1-11.
- Foley J. 2013. A ‘how to’ for getting soil water from your EM38 field measurements.
- French R. and Schultz J. 1984. Water use efficiency of wheat in a Mediterranean-type environment. 1 The relation between yield, water use and climate. Aust. J. Agric. Res. 35(6) 743-764
- Hunt J and Kirkegaard J. 2011. Dryland water use efficiency -What is it and how to improve it.
- Sadras V and McDonald G. 2012. Water use efficiency of grain crops in Australia: principles, benchmarks and management. GRDC publication.
- Verrell A. 2014. Row placement strategies in a break crop wheat sequence. Northern Grains regional trial results.
Acknowledgements
Many of the ideas presented here have been developed as part of a GRDC project: The Economics of Closing the Yield Gap in the Northern Grains Region. The author would like to thank the GRDC and the growers who provide contributions for research for their continued support.
Contact details
Simon Fritsch
Agripath Pty Ltd
21 Bourke St, Tamworth, NSW 2340
0428638501
simon@agripath.com.au
Peter Wylie
Agripath Pty Ltd
4 Alfred St, Dalby, Q. 4405
0429361301
peterwylie@agripath.com.au
Reviewed by
Chris McCormack