Soil characteristics and Yield Prophet® for better decisions
Soil characteristics and Yield Prophet® for better decisions
GRDC project codes: CSP00170 (and CSA00011 from 2006-2009), SATEN 03.07.2013, 05.07.2014
Take home messages
- A wide variety of soils in southern NSW have been characterised for plant available water capacity (PAWC) and the GRDC project CSP00170 is extending this database with the help of local advisers and farmers.
- A field-based method for characterising PAWC has been tried and tested across Australia, but users need to be mindful of common pitfalls that can cause characterisation errors.
- Identification of characterisation errors relies on understanding the factors that determine the PAWC of a particular soil. GRDC project CSP00170 is exploring ways to provide this understanding using soil property information along with landscape position and knowledge of soil forming factors. Texture (%clay, silt and sand) is one of the key factors determining PAWC and can provide a good first check, but soil chemistry can also affect PAWC.
- PAWC characterisations along with pre-sowing plant available water and nitrogen can be used with Yield Prophet® for better informed decisions on fertiliser application.
- PAWC characterisations used in conjunction with Yield Prophet® forecasts can provide valuable insight into the crop responses in different paddocks or paddock zones and inform variable rate zone management.
- The accuracy of PAWC characterisations and soil moisture and rainfall inputs can have a strong influence on the predictions generated by the APSIM model used by Yield Prophet®.
Introduction
A key determinant of potential yield in dryland agriculture is the amount of water available to the crop. In southern NSW on average 60% of annual rainfall is received during the growing season (April to October), but the amounts can vary considerably from year to year. Stored soil water has, therefore, proven to be valuable, particularly in drier growing seasons.
Decisions like whether and how much nitrogen fertiliser to apply would benefit considerably from information about the potential yield that can be expected. While in-season rainfall and other seasonal weather conditions like late frosts leave a level of uncertainty, knowledge of stored soil water can constrain the range of yields that can be expected and ‘underwrites’ a minimum yield outcome.
The amount of stored soil water available to a crop, Plant Available Water (PAW), is affected by pre-season and in-season rainfall, runoff and evaporation, but also strongly depends on a soil’s Plant Available Water Capacity (PAWC), which is the total amount of water a soil can store and release to different crops. The PAWC, or ‘bucket size’, depends on the crop being grown and the soil’s characteristics. Texture (%clay, silt and sand) is a major determinant of PAWC, but constraints like stoniness, toxicity from aluminium or boron, sodicity and salinity can limit the root development and hence the PAWC. Soil chemistry can also affect infiltration and internal drainage within a soil profile.
Over the past 20 years, CSIRO in collaboration with state agencies, catchment management organisations, consultants and farmers has characterised more than 1000 soils around Australia for PAWC. The data are publicly available in the APSoil database (see Resources section). In southern NSW 30 soils were characterised in the period 2006-2009 through a GRDC funded project ‘Training Growers to manage soil water’. A variety of projects have added PAWC profiles since, although a number of these are based on estimated properties. The current GRDC-funded project ‘Measuring and managing soil water in Australian agriculture’ is extending the data set by filling in gaps, considering links with soil and landscape characteristics, and discussing with a group of advisers and farmers how this information can be used to inform management decisions.
The PAWC data are being used by a number of farmers and advisers in southern NSW in conjunction with Yield Prophet® to assist with crop management decisions. Yield Prophet® is a tool that interprets the predictions of the APSIM cropping systems model. It uses the information on PAWC along with information on pre-season plant available water (PAW), soil available nitrogen, agronomic inputs and local climate data to forecast, at any time during the growing season, the possible yield outcomes. It first simulates soil water and nitrogen dynamics as well as crop growth with the weather conditions experienced and then uses long term historical weather records to simulate what would have happened from this date onwards in each year of the climate record. Often this constrains the range of expected yield outcomes and can indicate the probability of yield improvements in response to nitrogen applications. Yield Prophet® can also be used to get information about the likely stage of phenology, as well as frost and heat shock risks. It can also help with decisions about time of sowing, grain marketing and hay cutting.
This paper describes the measurement of PAWC and illustrates the factors that influence PAWC using examples from soils in the region. It also demonstrates how PAW and PAWC affect yield forecasts by Yield Prophet® that are used to inform management decisions.
Methodology
Measurement of PAWC
To characterise a soil’s PAWC, or ‘bucket size’, we need to determine:
- drained upper limit (DUL) or field capacity – the amount of water a soil can hold against gravity;
- crop lower limit (CLL) – the amount of water remaining after a crop has extracted all the water available to it from the soil; and
- bulk density (BD) – the density of the soil, which is required to convert measurements of gravimetric water content to volumetric water content.
In addition, soil chemical data are obtained to provide an indication whether subsoil constraints (e.g. salinity, sodicity, boron and aluminium) may affect a soil’s ability to store water, or the plant’s ability to extract water from the soil.
Field measurement of DUL, CLL and BD are described in detail in the GRDC PAWC Booklet ‘Estimating plant available water capacity’ (Resources section). Briefly, to determine the DUL an area of approximately 4 m x 4m is slowly wet up using drip tubing that has been laid out in spiral (Figure 1). The area is covered with plastic to prevent evaporation and after the slow wetting up, it is allowed to drain (see GRDC PAWC booklet for indicative rates of wetting up and drainage times). The soil is then sampled for soil moisture and bulk density.
The CLL is measured either opportunistically at the end of a very dry season (2014 was a good one for that in some areas of southern Australia) or in an area protected by a rainout shelter between anthesis/flowering until sampling (Figure 1). This method assumes the crop will have explored all available soil water to the maximum extent and it accounts for any subsoil constraints that affect the plant’s ability to extract water from the soil.
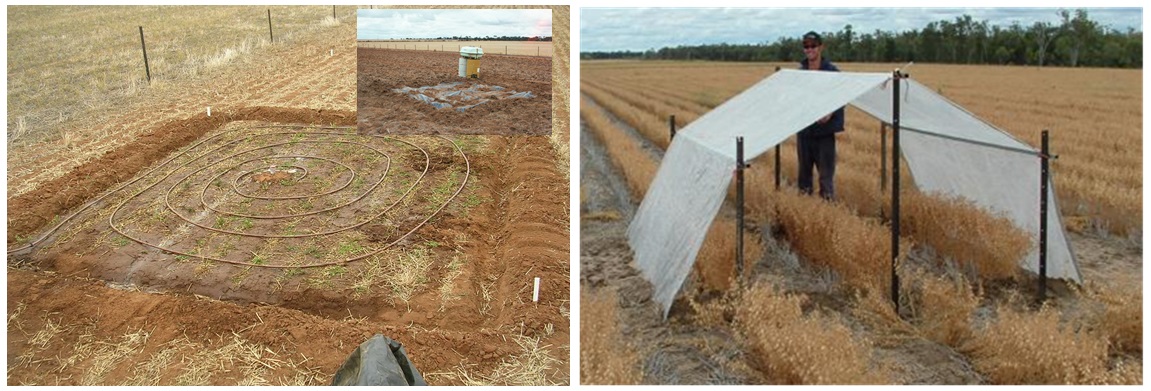
Figure 1. Wetting up for DUL determination and rainout shelter used for CLL determination.
Plant Available Water (PAW)
The amount of stored soil water available to the crop at any one time is called the plant available water (PAW). It is the difference between the soil water content and the CLL. This amount will fluctuate throughout the year in response to rainfall amount and distribution, efficiency of water infiltration (versus runoff), evaporation losses, crop water use, drainage losses beyond the root zone and in some cases subsurface lateral flow. It can be measured by soil coring or through the use of sensors, although these will require calibration in order to quantitatively report soil water content.
Effect of PAW and PAWC on Yield Prophet® forecasts
In the examples here we demonstrate the effect of PAWC and PAW on Yield Prophet® forecasts using data and information from a site near Barmedman, NSW. The paddock was divided into three zones with different PAWC. Crop lower limits were determined post-harvest of the 2012 wheat crop. The wheat CLL was assumed to apply to canola too, although this is yet to be confirmed. Drained upper limits were estimated based on texture and sites with similar soil properties.
Using the PAWC characterisations with pre-season PAW and soil available nitrogen, Yield Prophet® reports were run for the 2013 wheat crop and 2014 canola crop at 49 and 19 days after sowing, respectively. The reports provided the underlying model’s predictions of the probability of getting yield benefits from topdressing with nitrogen. This informed variable rate nitrogen management and was compared with standard practice (100 kg urea/ha= 46 kg N/ha) and a nil treatment.
Results and discussion
Factors that influence PAWC
An important determinant of the PAWC is the soil’s texture. The particle size distribution of sand, silt and clay determines how tightly the water is held. This affects the amount of water a soil can hold against drainage (DUL) as well as how much of the water can be extracted by the crop. The effect of texture on PAWC is reflected in many of the APSoil characterisations from southern NSW as illustrated in Figure 2a and b. The soil’s structure as well as its chemistry and mineralogy affect PAWC as well. For example, subsoil sodicity may impede internal drainage and subsoil constraints such as salinity, sodicity, toxicity from aluminium or boron and extremely high density subsoil may limit root exploration, sometimes reducing the PAWC bucket significantly.
The CLL may differ for different crops due to differences in root density, root depth, crop demand and duration of crop growth. Most characterisations in southern NSW only determined the CLL for one crop. The CLL for wheat, barley and oats are often considered the same and that of canola can be found to be similar as well (Figure 2c), but care needs to be taken with such extrapolations as variation between crops can also stem from sowing time and different tolerances for subsoil constraints.
A detailed explanation of the factors influencing PAWC is included in the Soil Matters – Monitoring soil water and nutrients in dryland farming book, a pdf of which is available for free online (Resources section).
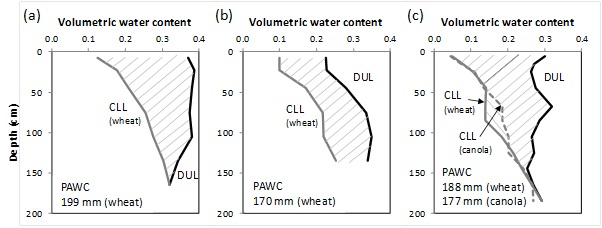
Figure 2. Examples of PAWC characterisations in southern NSW: (a) The heavy clay soils of the Bland have a large PAWC ‘bucket’ as shown here for APSoil site 693 from West Wyalong. A similar size PAWC was obtained for another cracking clay soil near Grogan, but there will be some variation within the Bland following alluvial landforms. (b) Many soils in the region are so-called duplex soils characterised by a strong texture contrast between surface soil (lighter) and subsoil (heavier). These are characterised by a ‘kink’ in the PAWC profile, as demonstrated by the characterisation of this APSoil site 211 from Rand. (c) Very few characterisations in southern NSW have been done for different crops at the same site. This characterisation from APSoil site564YP from Junee Reefs suggests similar extraction by canola and wheat.
Pitfalls and common mischaracterization issues
While the concept of PAWC is simple and the measurement methods for DUL and CLL were developed to be straightforward and therefore, do not require any sophisticated equipment, it is important to keep an eye out for various possible sampling errors. The list below summarises some of the key pitfalls and common mischaracterization issues that we have come across in our collective experience of PAWC characterisations across Australia. The current project is working towards describing ways to identify and rectify these issues.
DUL
- Weeds are often seen growing on the side of the plastic cover. It is important that these are strictly controlled.
- In sandy-textured soils the concentric rings of dripper line must be laid sufficiently close to each other to ensure consistent wetting across the whole area.
- Allowing insufficient time for drainage may lead to overestimation of DUL, especially at depth. Heavier soils can take a few weeks to drain.
- Insufficient water application or application at too high a rate leads to underestimation of DUL at depth. This is particularly an issue with heavy clay soils, dispersive sodic soils and strong duplex (texture contrast) soils where water may move sideways. Both the GRDC PAWC booklet and the Soil Matters book provide indicative rates and amounts for different soils. The wetting and drainage processes may be monitored (e.g. using NMM or a moisture probe), but this is not often done due to cost constraints (time, money).
- Bulk density sampling, which is often done in conjunction with DUL sampling, requires a relatively high level of precision as any error in bulk density values will propagate when used to convert gravimetric water contents (including DUL, CLL and PAW) into mm of water. The procedure is described and illustrated in detail in the GRDC PAWC booklet.
CLL
- The CLL method as described above relies on crop roots exploring the soil to the fullest extent. If the crop had insufficient moisture to establish its root system prior to anthesis, the CLL may not reflect maximum soil water extraction. Roots will not grow through a dry layer even if there is moisture underneath. It is, therefore, important to perform CLL measurement in paddocks with a well established and healthy crop. Wetting up of the CLL site prior to the growing season may help, but requires close attention to weeds and to supplying the right amount of nitrogen fertiliser.
- In wetter climates and years in the weeks just prior to the erection of rainout shelters at anthesis, rainfall may refill the PAWC ‘bucket’. If the PAWC is large, this may prevent the crop from using all soil water and result in an overestimate of CLL (too wet). Ideally CLL is measured over multiple seasons, but this is rarely done in practice. Calibrated moisture probes can be an effective tool to assess a crop’s ability to extract moisture over a range of different seasons.
- The CLL measured for one crop type may not apply to a different crop type, especially where growing season length or susceptibility to subsoil constraints differs. It is possible that long-season varieties may extract water from a greater depth than short season varieties because of more extensive root development, and hence result in different CLL.
- If sampling is not deep enough to capture the full root zone, PAWC will be underestimated. In this case the CLL and DUL do not reach the same value at the bottom of the profile.
- Rainout shelters have blown loose or away on occasions, so it is important to secure the sides firmly into the soil.
- For duplex soils located on hills slopes > 3-5% or soils at the break of slope subsurface, lateral flow can cause soil wetting despite the presence of a well constructed rain-out shelter. Keep an eye on late season rainfall and note any unusual wetness in samples collected.
- Sampling after harvest when the soils are dry and hard, or have hard layers can be tricky. Digging a soil pit can provide valuable information in these situations.
General
- Soil variability may mean there is more than one PAWC profile within the paddock. Variability in depth of layers, e.g. texture contrast in duplex soils, can occur over small distances. This makes mixing replicates and selecting a “representative soil” difficult.
- High soil variability can cause the DUL and CLL measurements to effectively be on different soils (even though they are usually only 2-3 m apart). It is essential to measure DUL and CLL on the same soil type.
- In drier regions where the PAWC ‘bucket’ seldom fills up, CLL along with PAW may be more important than DUL. The accuracy of DUL characterisation becomes more important in climates or years where drainage occurs during the season. Crop yield predictions would be particularly sensitive to DUL in the situation where drainage occurs during winter and the crop subsequently relies on this full profile of soil moisture due to, for example, a very dry spring like that experienced in 2014 in many locations in South Australia.
Open (active) research questions include:
- Do roots grow/develop the same in a wet season compared with in a dry season? Or do they get ‘lazy’ in wet seasons?
- How to characterise and sample gravelly soils?
- How do we account for buckshot or gravel, especially if the gravel holds water?
Identifying characterisation errors relies on understanding the factors that determine the PAWC of a particular soil. For example, insufficient wetting up can be recognised by a DUL that decreases with depth even though the soil texture is not changing. Knowledge of texture (%clay, silt and sand) allows a rule of thumb check on PAWC, but needs to be modified for soil chemistry.
Similarly, extrapolating characterisations to other sites requires an understanding of soils. The closest site is not necessarily the most similar one, but information on texture (%clay, silt and sand) with depth, soil colour and landscape position can help significantly. PAWC characterisations should therefore be accompanied by as much extra information as possible, including descriptions of the landscape position, surface condition (e.g. cracking, waterlogging), colour and texture (ideally with a full particle size analysis).
Soil-landscape effects on PAWC
As part of GRDC project CSP00170 four soils were characterised for PAWC in the rolling, granodiorite hills near Young, NSW. Their position in the landscape, including being on a shorter, steeper slope or a longer, gentle slope affected their soil profile development. Information on texture, particle size analysis, colour, presence of mottling, exchangeable sodium content explained the soil forming processes and the resulting PAWC profiles. The soil properties, along with PAWC, can explain differential performances and management needs with preliminary results summarised in Figure 3.
GRDC Project CSP00170 is exploring the use of soil and landscape information from SoilMapp (includes APSoil), ESpade and the new TERN landscape grid (Resource section), along with predictive tools like Soil Water Express (Resources section) to provide an understanding of PAWC profiles and a means to extrapolate information.
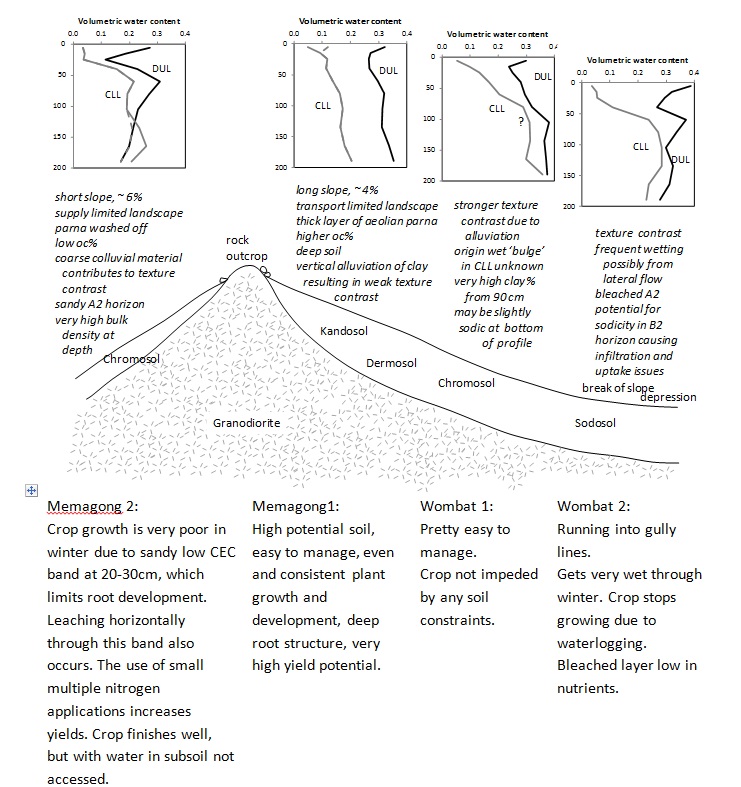
Figure 3. Preliminary schematic for relative slope positions of four soils in Young granodiorite hills.
Use of the PAWC and PAW information to inform management decisions
While information on PAWC can on its own provide useful information and understanding about a soil’s behaviour, the Yield Prophet® model allows us to take this information that one step further. It provides information on the probability of yield outcomes, which can, for example, improve the confidence with which nitrogen allocation decisions are made. By comparing alternate scenarios it can identify when potential returns from applied nitrogen are high, low or even negative.
Variable rate zone management example
We illustrate this approach by combining Yield Prophet® with zone management based on PAWC. Most farms have a range of soil types and the inherent characteristics of these soil types are a major determinant of spatial variation in yield within paddocks. Characterising the main soil types allows zones to be created for variable rate (VR) nitrogen management. Using Yield Prophet®, nitrogen allocation can be targeted to areas of greatest benefit within the paddock. Areas of soil with lower PAWC may not require any additional nitrogen to achieve water limited yield potential. This approach has the potential to increase business profitability and reduce risk.
The three zones of a paddock near Barmedman, NSW used in this study had different PAWC profiles as shown in Figure 4.
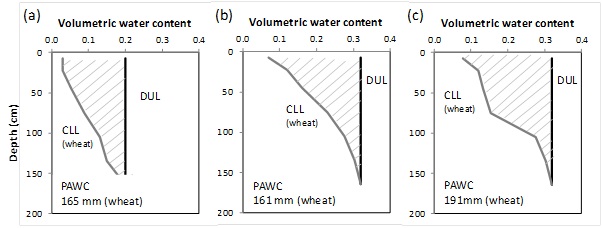
Figure 4. PAWC characterisations of the three zones of a paddock near Barmedman, NSW with CLL measured and DUL estimated; (a) zone 1, (b) zone 2, (c) zone 3. Pre-season PAW in 2013: 77, 21 and 89 mm respectively; pre-season PAW in 2014: 60, 36, 83 mm respectively for zones 1, 2 and 3.
Yield Prophet® reports comparing three levels of nitrogen top dressing to the 2013 wheat crop showed that the PAWC and PAW affected the grain yield outcomes and the benefits of nitrogen application (Figure 5). The Yield Prophet® forecasts suggested that yield potential would be highest for zone 3 (large PAWC and PAW), followed by zone 1 (smaller PAWC, but reasonable PAW) and finally zone 2 (very low PAW). The application of nitrogen fertiliser was predicted to result in a yield benefit of at least 0.5 t/ha in approximately 80% of years. Yield Prophet® Nitrogen Profitability Reports indicated best returns from additional nitrogen applied to zone 1, followed by zone 3 and zone 2. Bureau of meteorology forecasts of above average spring rainfall influenced the decision to apply higher rates of nitrogen. The combined nitrogen applications for the VR zones was constrained to be equal to the 46kg N/ha applied in the standard treatment. This information was used to set variable rates at 92 kg N/ha for zone 1, nil for zone 2, and 80.5 kg N/ha in zone 3.
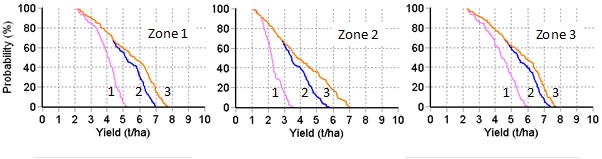
Figure 5. Yield Prophet® forecasts of the probability of exceeding given yield for nitrogen top dressing scenarios of nil (scenario 1), 92 kg N/ha (scenario 2) and 230 kg N/ha (scenario 3) applied at growth stage GS31 to a wheat crop sown on 16 May 2013. The curves represent the possible outcomes given climatic conditions of season finishes in the previous 100 years. Percentages are approximately the inverse of rainfall deciles; 80% = decile 2 rainfall, 40% = decile 6 rainfall. 230kg N/ha was taken to approximate “unlimited nitrogen”.
The year 2013 ended up having a very dry finish (117 mm = decile 2 between July and October) and yields were found to be not significantly different between nil, variable rate and 100 kg urea/ha. While Yield Prophet® had predicted an 80% probability of getting 0.5 t/ha yield benefit or more, the dry season prevented that from being realised, highlighting the fact that this remains a probabilistic approach and does not guarantee benefits.
The experience in 2013 prompted a slightly more conservative approach in 2014. Again the different PAWC and sowing PAW of the three zones led to differences in predicted response to top-dressing of nitrogen (Figure 6). In zones 1 and 2 the model predicted an 80% probability of increasing yield by 0.5 t/ha if 50 kg N/ha was applied, whereas for zone 3 there was a 70% probability of this happening. In addition, in zone 3 the model predicted a 90% probability of exceeding the historical median canola yield of 1.5 t/ha without applying any additional nitrogen. To reduce the financial risk of over-spending on nitrogen, rather than trying to increase yields, these observations were used to decide not to apply any further nitrogen in zone 3, whereas 27.5 kg N/ha was applied in the variable rate treatments in zone 1 and 2.
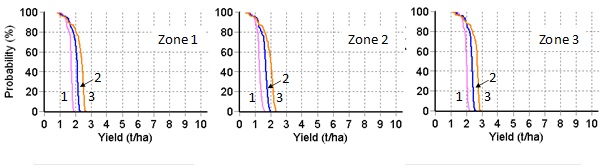
Figure 6. Yield Prophet® forecasts of the probability of exceeding given yield for nitrogen top dressing scenarios of nil (scenario 1), 25 kg N/ha (scenario 2) and 50 kg N/ha (scenario 3) applied one month after sowing a canola crop on 25 April 2014.
The total applications and economic analysis for the 2014 canola variable rate trial are shown in Tables 2 and 3. Due to another below average season finish (171 mm June - October, decile 3) treatment effects were small. While the yield increase from additional nitrogen was statistically significant, the increased income was not sufficient to cover the cost of fertiliser in the standard treatment. Managing nitrogen allocation using PAWC zones and Yield Prophet® increased profit by $12/ha compared to the standard practise and $10/ha compared to the nil treatment.
Table 2. Urea applications made to the 2014 canola variable rate trial.
| Urea Applications |
Standard Practice | Variable Rate | ||
| (kg/ha) | total Urea | (kg/ha) | total Urea | |
| Zone 1 - 19 ha | 100 | 1900 | 60 | 1140 |
| Zone 2 - 33 ha | 100 | 3300 | 60 | 720 |
| Zone 3 - 12 ha | 100 | 1200 | 0 | 0 |
| Total - 64 ha | 6400 | 1860 | ||
| Average | 100kg/ha | 26 kg/ha | ||
| Results | Nitrogen Management | ||
| Nil | Standard | VR | |
| Average Yield | 0.61 | 0.74 | 0.70 |
| Income @ $450/t | $275 | $333 | $315 |
| Less Urea Cost | 0 | $60 | $17 |
| Less VR Cost | $13 | ||
| $275 | $273 | $285 | |
The cost ($13/ha) of VR management is only spread across one paddock. If the information is used across an entire farm the cost falls below $2/ha.
Advice for Yield Prophet® applications
Yield Prophet® forecasts can provide powerful information for decision making, but it can take a few seasons to gain confidence in the model’s representation of a particular paddock, including the PAWC characterisation. These are some of the pitfalls to be mindful of:
- Error in rainfall data. On-site rainfall data (or at least from a distance of < 5 km) is best.
- Sampling error in pre-sowing soil water (PAW) and/or nitrogen due to (1) variability across a paddock, (2) sampling of different soil types within a paddock, (3) insufficient mixing of replicate samples, and (4) mixing (bulking) of replicates with different soil horizon depths.
- Sampling error in PAWC. An accurate soil characterisation which matches the soil in the paddock is required if results are to be interpreted in a quantitative sense. Extrapolating from a characterisation that is geographically nearer is not always more accurate; see above section on PAWC determination.
- The assumption that the CLL for wheat also applies to canola, or vice versa, does not always hold. At the Barmedman site the apparent overprediction of yields, in particular on the heavy zone 3 soils, was confirmed by the farmer’s observation in September that the canola on the heaviest soil (zone 3) was suffering from lack of moisture. This suggests that canola may not have rooted as deep or efficiently on this soil, possibly due to high chloride concentrations in its subsoil (506 mg/kg at 60-90cm depth, no data available for deeper depth). Data on soil chemistry are useful to explore such yield gaps.
- Yield Prophet® forecasts are probability based. This means that outcomes are not guaranteed. For example, an 80% probability of a yield response to extra nitrogen fertiliser still leaves the possibility of 20% of seasons without a response.
- Yield Prophet® cannot account for frost, heat shock, weeds, disease or uneven plant population. These factors can cause the observed yields to be lower than the forecast yields. Reasons for the yield gap should be explored along with assessment of the accuracy of PAWC and PAW.
- Accurate yield records (over time) can provide useful context for comparing with model predictions and making fertiliser management decisions.
As with any model the quality and value of information generated is directly related to the quality of data that is entered. The model is, however, also undergoing continuous improvement. For example, currently the simulated wheat growth stage GS30 is not always accurate and it is a critical growth stage for making decisions. Improvements to model parameterisation to enhance phenology predictions are being explored. Similarly we are working towards ways of checking or improving soil characterisations. Could, for example, historical yield data help assess the model’s accuracy or even characterise a soil? This relies on identifying the reason for the yield gap. Further work is also ongoing to characterise the uncertainty in Yield Prophet® forecasts stemming from uncertainty in PAWC characterisation and pre-season PAW measurement.
Conclusion
PAWC characterisations along with pre-sowing plant available water and nitrogen can be used with Yield Prophet® for better informed decisions on fertiliser application. Understanding the factors that determine the PAWC of a particular soil can help improve the accuracy of PAWC characterisation as well as Yield Prophet® forecasts. Soil particle size analysis and chemistry for the complete root zone along with observations on a soil’s position in the landscape, its behaviour in wet and dry conditions and the performance of crops can provide valuable information.
Acknowledgements
We gratefully acknowledge the contributions of many collaborators and farmers to the field work and PAWC characterisations. We thank Anthony Ringrose-Voase and Neil McKenzie for review and discussion.
Resources
- APSoil database
- GRDC PAWC booklet
- Soil Matters book
- Yield Prophet®
- SoilMapp: Apple IPad app available from App store
- ESpade
- TERN Landscape Grid
- Soil Water Express
Contact details
Kirsten Verburg
CSIRO Agriculture Flagship
(02) 6246 5954
kirsten.verburg@csiro.au
Mark Glover
CSIRO Land and Water Flagship
(02) 6246 5806
mark.glover@csiro.au
Chris Minehan
Rural Management Strategies Pty Ltd
0427 213 660
chris@rmsag.com.au
@chrisminehan
GRDC Project Code: CSP00170 (and CSA00011 from 2006-2009), SATEN 03.07.2013, 05.07.2014,