Existing and emerging technology to improve farm business management
Existing and emerging technology to improve farm business management
Author: Ben Boughton (Gilroy Farms, Satamap Pty Ltd, 2014 Nuffield Scholar, Moree) | Date: 08 Feb 2016
Technology to improve farm business
Although this is not an exhaustive list, just some of the technologies that are emerging or remain under-utilised include:
- Remote weather stations
- UAV crop monitoring
- Satellite imagery crop monitoring
- A few surprises.
Remote weather station
The remote weather station we use on our property is a Davis Vantage Pro 2 Wireless, which retails at about $1500. Some of the specifications are:
- 300m range. Ability to add wireless repeaters ($357 per 300m repeater, up to 2.7km from internet connection / power)
- Automatic weather logging - we use a Meteobridge router to send data to the publicly available Weather Underground website
- Added benefit of camera for security
- Capacity to add moisture and temperatures sensors ($830 for four soil moisture and four temperature sensors).
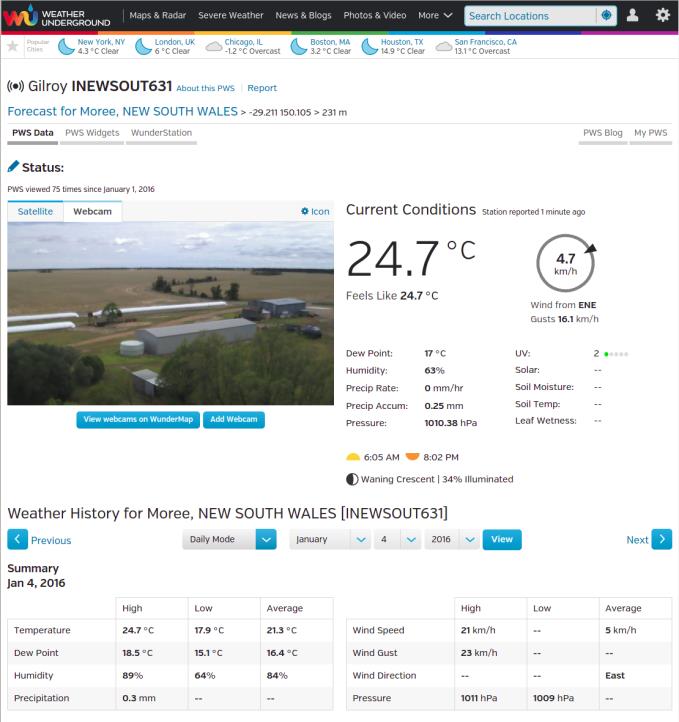
Figure 1: Almost real time weather conditions from Gilroy farms, able to be viewed remotely through the Weather Underground website.
Measuring return on remote weather station
Although the return on investment may be hard to quantify in dollar terms at this stage, the remote weather station offers several benefits, which include:
- Especially helpful if there is no one living on property as it can save on travel
- No stopping of sprayer to check conditions
- Save time with automatic log of rainfall
- Security with camera
UAV remote sensing
The technology is maturing, but it is not necessarily getting cheaper. At this stage, the economics are not there for GIS mapped ‘scouting’. However, it is more viable for applied applications such as in-crop weed management, insurance adjustors, high value crop establishment and large scale research and development. The DJI Phantom 3 drone (about $1000 with camera and gimbal) is suitable for small area scouting and ‘having a look’ is proving popular. Another UAV to consider also the 3DR Solo.
Measuring return on UAV
When considering whether not it will be financially worthwhile to invest in a UAV service, it is useful to do your own calculations. There are many variables and practicalities to consider. I offer here a simulated example.
Weed map in crop example
- 100ha paddock
- UAV map @ $5/ha = $500
- Identifies only weeds on 18 per cent of the paddock
- Costs $20/ha in chemical to spray
- Costs extra $1/ha for the contractor to apply variable application
- With UAV: 0.18 x 100 x $20 + $500 + $100 = $960Without: 100 x $20 = $2000
- $2000 - $960 = $1040 saving.
A risk is that the UAV may miss weeds, therefore is it worth the saving?
Satellite imagery remote sensing
There has been a recent surge of interest in using satellite imaging due to falling costs and increasingly easier access. The resolution of 15m pixels is sufficient to see crop variability. It offers extremely good value to monitor crops during a season.
This year, the intervals at which imagery will be available will be down to eight days. This is a large improvement, which reduces the likelihood of cloud cover interference. In addition, satellite imagery is useful for district views and for historical comparisons. Another benefit is the portability, as the imagery works well on Ipads or other tablets.
Measuring return for low cost satellite imagery
- $900 per year for three million hectare tile updated every eight days
- On a 3000ha farm that is 30 cents per hectare
- There is a time and chemical saving that varies significantly on each situation.
An example
During September and October chickpea crops generally begin to ripen unevenly. Grubs will congregate in the greenest parts of the crop. Imagery allows agronomists and farmers to identify all green patches and use the map direct application of pesticide to those places.
Case study: water logging in chickpeas
This example is of a chickpea paddock grown north of Moree in 2015. The aim here is to display data from different sources to get a better understanding of what happened throughout the growing season.
The crop was planted on a full profile of moisture in May into heavy barley stubble with a single disc no till planter. Establishment was reasonable but there were a few gaps.
Two rainfall events, 51mm in June and 50mm in July led to a water-logging event. The next significant rainfall event was 25 mm on 29 October. The combination of stored moisture, high stubble cover, poor drainage from tramline direction, and a charged fallow catchment area upstream all contributed to this event.
The dry finished enabled the affected areas to recover reasonably well producing an average yield of about 1.9t/ha.
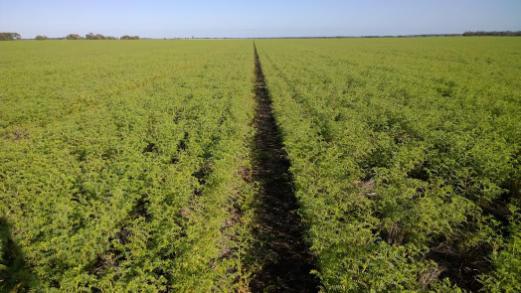
Figure 2: Healthy chickpeas unaffected by water logging.
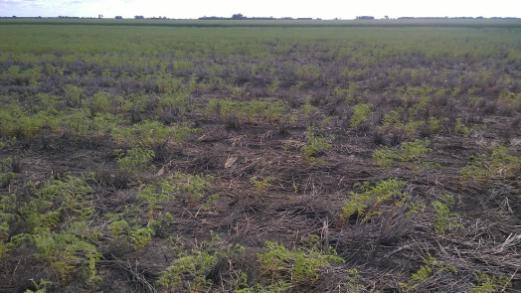
Figure 3: Area worst affected by water logging.
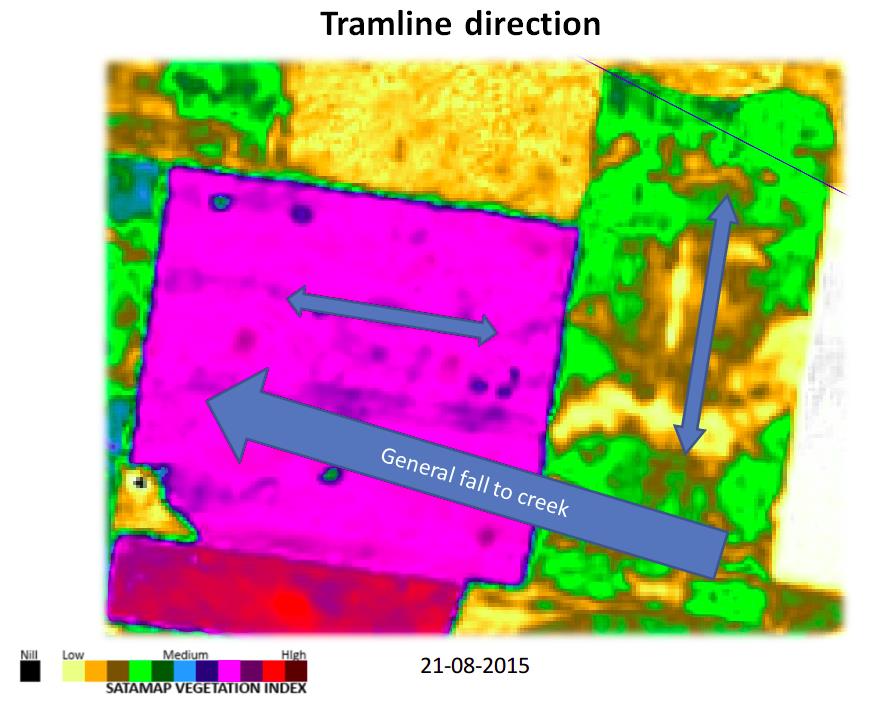
Figure 4: Satamap image. Paddock on right is subject chickpea paddock. The water logging effect on biomass is clearly visible on a paddock scale.
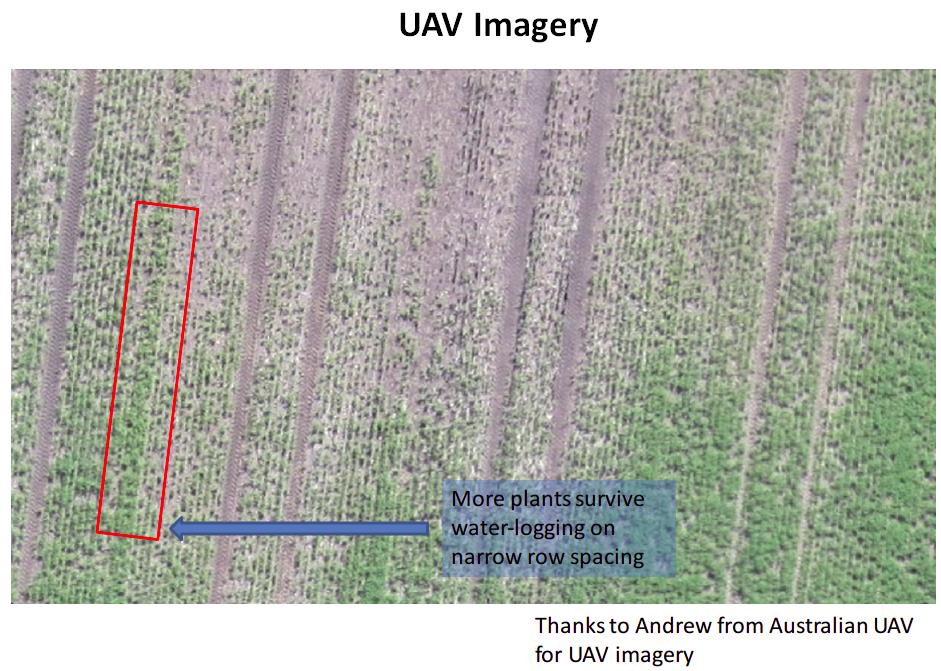
Figure 5: Imagery from UAV take 26-08-2015 enables us to see individual plants.
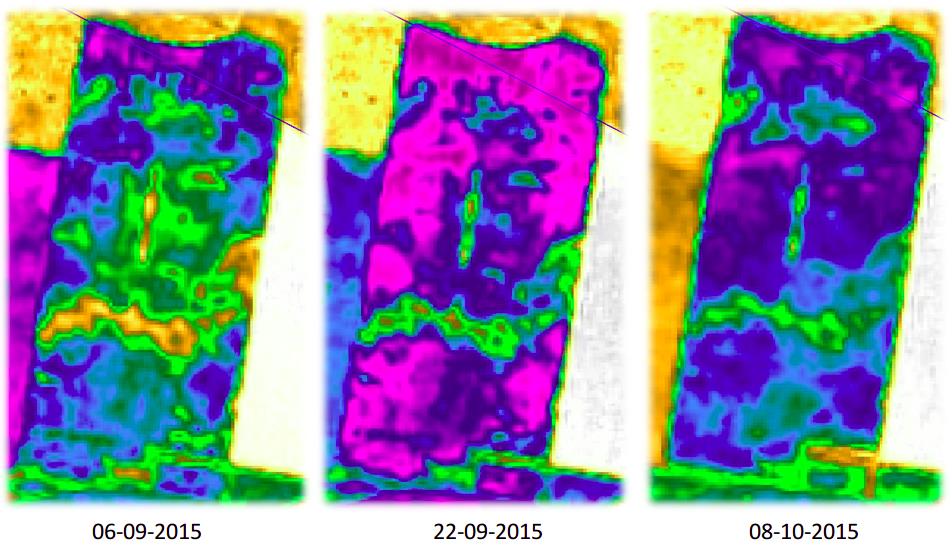
Figure 6: Satamap imagery showing how biomass changes of 16 day period.
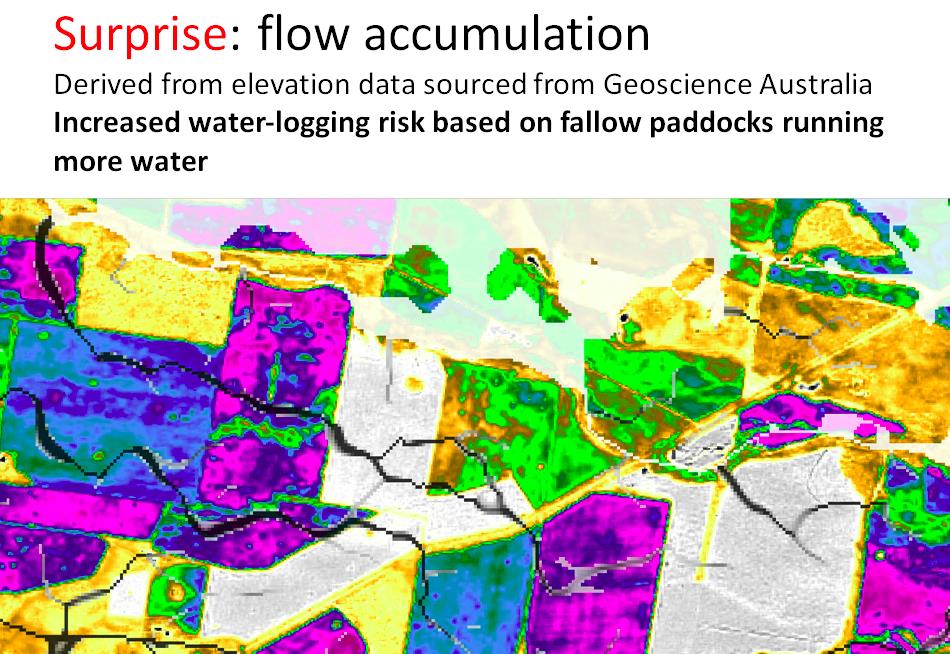
Figure 7: Satamap imagery with flow accumlation layer on top showing where water accumulates when it rains.
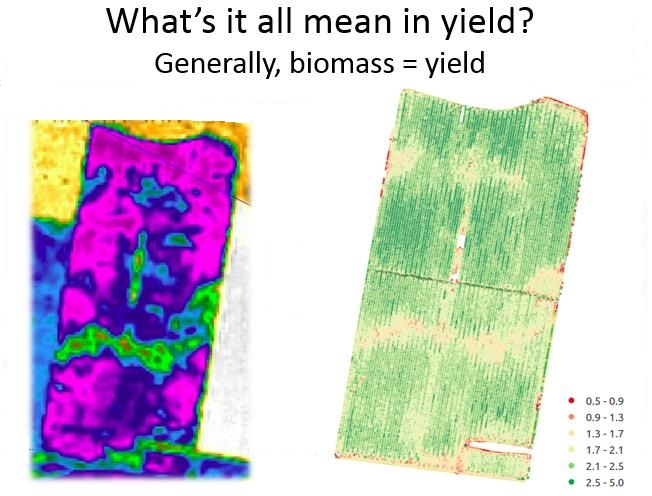
Figure 8: Yield map from harvester shows general trend of high biomass resulting in higher yield. Overall an excellent result.
Lessons learnt from this chickpea crop
Management was improved because during the season we knew exactly how the entire paddock was performing. As an example, we were able to send an agronomist to check for grubs in high biomass areas. Regularly checking imagery allows us to learn more about how our soils and crops respond to different management techniques and natural events.
We were able to adapt and will continue to do so. In response to this season we are in the process of turn our tramlines perpendicular for water flow. We will continue a 33cm row spacing rather than 66cm which could have been disaster for this paddock. We will also be fussier with crop establishment.
Twitter is the social media of choice for agronomists and growers to talk (and argue) about agriculture. If you are interested in what is going on, and if you haven’t done so already, give it a go.
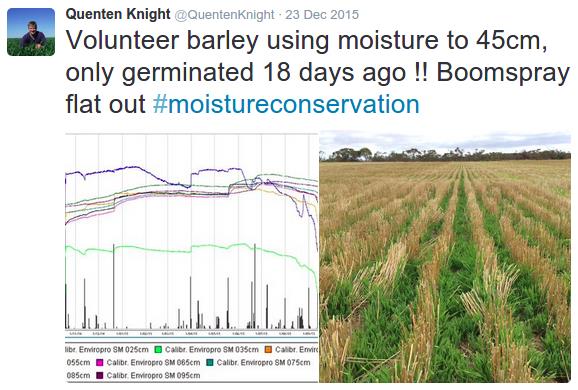
(A)
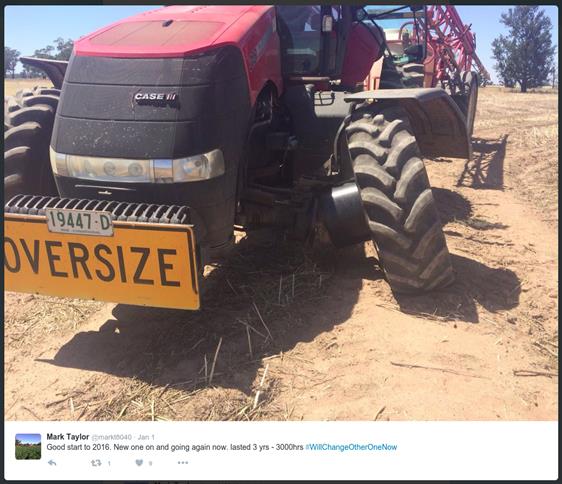
(B)
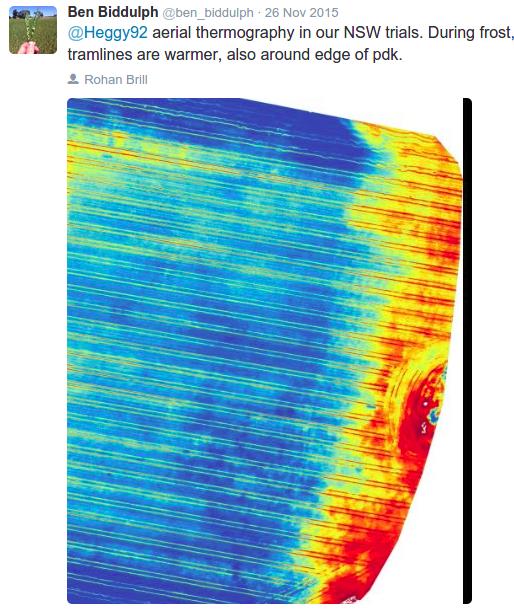
(C)
Figure 9 (A-C): Some examples of tweets.
Conclusion
The most value is achieved when multiple technologies are combined with grower and agronomist local knowledge and experiences. Consider discussing this on Twitter.
Contact Details
Ben Boughton
Mobile: 0428 548 688