Stopping spray drift and the Aust Ground Spray Calculator that helps manage spraying operations
Stopping spray drift and the Aust Ground Spray Calculator that helps manage spraying operations
Author: Andrew Hewitt, Chris O’Donnell, Gary Dorr, Jason Ferguson and Rodolfo Chechetto, University of Queensland | Date: 22 Jul 2016
Take home message
The Australian Ground Spray Calculator is a decision-support tool that provides spray applicators with information on droplet size, target coverage and drift potential specific to particular nozzles and tank mixes. Spray applicators now have a unified tool that provides science-based reliable information to help with their drift management strategies.
Introduction to spray drift
Just because a spray is classified as “Coarse”, it can still include up to 10 or more out of every 100 L in “fines”. In other words, for an application rate of 100 L/ha, 10 of those 100 L could potentially be available to drift off-target in unfavourable conditions. In a relatively high wind speed in an unstable atmosphere, this driftable part of the spray could move relatively large distances, but is likely to disperse more than under conditions of little or no wind in a local surface temperature inversion where the total drift loss and distance may be similar to that of the high wind scenario but the concentrations of droplets on the ground at any one distance can be hard to predict. In some places there may be no droplets, while in other places there could be relatively high concentrations of this deposition drift under stable air conditions. The above hypothetical cases of unstable and stable air may have involved the same amount of airborne drift but very different patterns of deposition drift.
Managing drift
Pesticide exposure risk assessors usually assume that the air is unstable because applications under conditions of local surface temperature inversions are forbidden on labels and in most pesticide application regulations. When stable air scenarios are ignored in risk assessment, the normal trend for exposure is that airborne and deposition drift increase with higher wind speeds. However, the label tends to focus on Spray Quality for alerting the applicator how to avoid drift with a particular product. For example, phenoxy herbicides are usually labelled for requiring a spray that is at least Coarse in Spray Quality.
Improvements to regulations
However, through the work of UQ and others, regulations could soon become more flexible to allow an applicator to manage drift in other ways than just droplet size, and even to reduce the size of any required no-spray buffer zones by using a suitable Drift Reduction Technology, or DRT instead or, or as well as the standard nozzle options. DRTs may include novel designs of hardware options (e.g. better nozzles, atomisers or shields, shrouds, air-assistance, etc.), or formulation chemistries (e.g. some emulsion and other chemistries). In some cases, landscape features such as hedges or netting may be allowed as DRT shields or barriers to intercept drift and protect sensitive areas downwind and beyond their locations.
Spray Performance Calculator
One aim of the Spray Performance Calculator is to be ready to show DRTs once the Australian Pesticide and Veterinary Medicines Authority (APVMA) announces and launches its DRT scheme for Australia (this is expected late in 2016, at which time the Spray Performance Calculator will be updated accordingly). The Calculator already includes an output called “Drift Potential”. This indicates the relative drift potential of the spray. In the example below, the spray selected by the end-user was classified as Coarse for Spray Quality, but had a relatively low drift profile and exposure level. Note that the percent “fines” in this case is almost 80% lower than the default ~13% for the reference category of “Coarse” sprays. This is important because if an applicator can select a Spray Quality that is finer than the Drift Potential then he can often increase the potential spray coverage at targets without needing to increase his application volume rate.
Factors influencing performance of a pesticide spray
It has been known for many years that the choice of nozzle, spray pressure and tank mix composition including active ingredient and adjuvant products can have a large effect on the performance of a pesticide spray for efficacy and targeting. In general, the coarser the spray, the lower its drift potential but the lower the potential coverage on target surfaces, plants and pests. This is where factors like increasing the water volume rate can help boost droplet numbers, but how does an applicator know how to get the balance between the spray coverage and avoidance of drift when faced with so many variables?
In particular, adjuvant effects are often non-intuitive with some adjuvants increasing the fine droplets in a spray and others reducing these “fines”. To make things more complicated, one trend may be seen with one nozzle but a completely different trend with a different nozzle. To help take the guesswork out of spray performance and also help comply with new spray drift management requirements, researchers at The University of Queensland (UQ) have measured the performance of over a thousand combinations of nozzle x pressure x tank mix that cover most Australian grain crop spraying scenarios and assembled these data into a new Australian Spray Performance Calculator© that can help show the key performances of a spray in relative terms: a) coverage in number of droplets/cm2, b) coverage after droplets wet a leaf, c) Spray Quality in terms of droplet size classification and d) Drift Potential. This calculator differs from previous spray performance tools in Australia and the USA which tended to only state the Spray Quality.
Additional information in the Calculator shows the droplet size spectrum and where it sits relative to the American Society for Agricultural and Biological Engineers (ASABE, formerly ASAE) S572 reference spray boundary curves. ASABE S572 “Spray Nozzle Classification by Droplet Spectra” is a system that allows sprays and nozzles to be classified by Spray Quality into categories of relative size. In the example below, the volumetric droplet size spectrum curve (solid blue line) crosses between different size classes depending on the volume fraction/ droplet size region. The ASABE S572 scheme requires the classification be assigned to the finest category in this distribution which resulted in a Coarse spray designation.
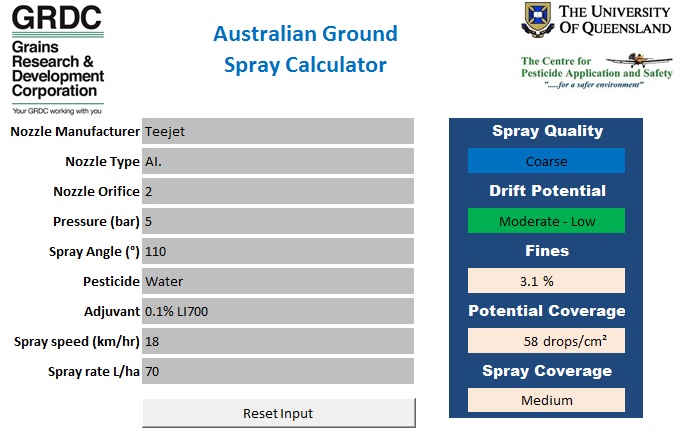
Figure 1. Spray performance calculator
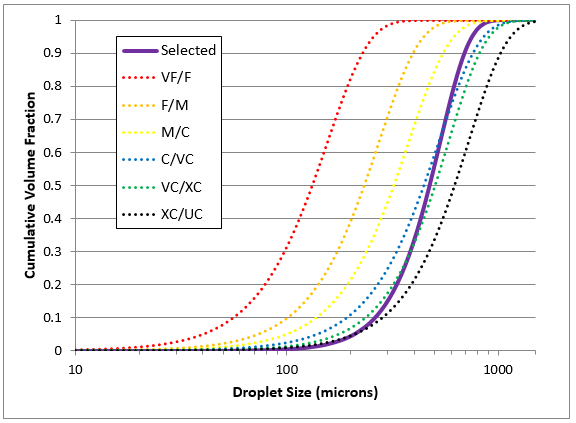
Figure 2. Droplet size spectrum for the example scenario from the calculator (solid line) compared to ASABE S572 reference curves which are (from L to R) VF/F, F/M, M/C, C/VC, VC/XC, XC/UC.
Acknowledgements
The authors gratefully acknowledge the financial support of the GRDC and their grower base which helped develop the core database used in the spray calculator.
Contact details
Chris O'Donnell
The University of Queensland
Gatton, Qld, 4343
Email: c.odonnell@uq.edu.au