Canola: the economics and physiology of the timing of windrowing
Canola: the economics and physiology of the timing of windrowing
Author: Kathi Hertel – District Agronomist, NSW DPI - DUBBO | Date: 26 Feb 2013
Kathi Hertel
District Agronomist, NSW DPI - DUBBO
Key words
canola, oil, yield, windrowing, harvest management, crop physiology, economics
Take home message
- The level of knowledge and understanding of plant growth and development across the canola industry is mixed. Common perceptions are influencing advice regarding harvest management practices and ultimately economic outcomes.
- Improving knowledge and understanding of plant growth and development will allow observations in the paddock to be used to make informed practical and economic harvest management decisions.
- Understanding the term “colour change” is crucial to avoid potentially significant crop and economic penalties. Seed colour is directly related to seed maturation.
- Maximum seed weight and oil content has been reached when seed moisture has declined to 40% seed water content.
- Recommended guidelines to windrow canola are when 40 – 60% of seed has changed colour to maximise yield and oil content. Seeds in the pods at the top of the main stem may be green but are firm when rolled between the thumb and forefinger.
- Under favourable spring growing conditions, research has shown that during the last few days leading up to the recommended windrowing time, canola may increase yield by 100 kg/ha per day and oil content by between 0.3% and 0.6% per day.
Background
Windrowing canola has long been considered to be a standard operation in growing canola in Australia. The expansion of canola into more marginal areas, increasing frequency of below average seasonal conditions and a closer focus on the economics of all facets of crop production have contributed to greater interest in direct heading crops and discussions surrounding canola harvest management.
During 2009, particular note was taken of the widely different views and opinions regarding windrowing, including its’ actual timing, and effects on both oil and yield and subsequent economic outcomes overall, and its’ operational importance and role in canola production. It was evident that over the time, those original industry guidelines had been forgotten, re-interpreted or modified and that understanding of crop physiological processes was poorly understood.
This paper summarises some of the findings of some of the work conducted since then, aimed to clear up common misinterpretations and to improve industry wide knowledge and understanding of canola physiology and its implications for better practical and economic harvest management decisions.
Industry survey
Since 2009, a survey of industry participants including growers, agronomists and consultants, and windrowing contractors was carried out. The survey involved in-depth phone consultations, one-on-one interviews and questionnaires at field days and grower meetings. The replies from a total of 900 respondents with canola industry experience were recorded. The following data is based on the preliminary data set, with analysis yet to be finalised at the time of writing. Some of the initial findings include:
Optimum colour change to windrow
Answers nominating a figure ranged between 10 and 100% seed colour change, with 13% of respondents not nominating a specific number (Table 1).
Looking more closely, 48% of growers, 51% of agronomists and 40% of contractors nominated a figure within the industry guideline of 40 – 60% seed colour change. Together with respondents who had not nominated their position in the canola industry (“Unknown” category) this amounted to 46%.
Table 1: Percentage of respondents indicating optimum level of seed colour change to windrow canola (NOTE : This is preliminary data with analysis still to be finalised.)
|
% seed colour change |
Grower |
Agronomist |
Contractor |
Unknown |
OVERALL |
|
> 80 |
3 |
2 |
1 |
4 |
2 |
|
61 – 80 |
26 |
22 |
21 |
28 |
25 |
|
40 – 60 |
48 |
51 |
40 |
29 |
46 |
|
20 – 39 |
9 |
11 |
13 |
15 |
11 |
|
< 20 |
4 |
1 |
4 |
4 |
3 |
|
No figure |
10 |
13 |
21 |
21 |
13 |
Part of the survey included a series of questions to quantify the perceived outcomes from non-optimal windrowing timing. The question was designed to allow answers to be represented as oil and yield growth curves, revealing current understanding of crop physiology.
Optimum timing of windrowing – effects on oil and yield
The scenario was described where a crop was growing with no limiting factors (including moisture, temperature, nutrition, disease and weeds) and given optimum timing on a nominated day, oil levels were 42% and yield was 2.5 t/ha. Respondents were asked to specify what the oil and yield would be if windrowing occurred 3-4 days and 7-10 days earlier than the designated optimum day and 3-4 and 7-10 days later. It was reinforced to respondents that it was assumed that there were no adverse factors impacting on the crop like wind and shattering.
Perceptions of the impact on crop yield and oil content with the timing of windrowing operations were diverse. For example:
3 – 4 days earlier than optimum
When asked the effects of windrowing 3 – 4 days earlier than the optimum time on yield and oil content, answers were very mixed.
Beliefs of windrowing timing effects on final oil content included: there would be little or no effect (ie 42% oil), there would be losses with oil content as low as 10% as well as others believing there may be gains amounting to as high as 57% oil - a range of 47% oil content!
Similarly, respondents views of early timing effects on yield included losses amounting to 1.0 t/ha, gains of a further 0.5 t/ha as well as no effect (ie 2.5 t/ha) at all on final yield.
3 – 4 days later than optimum
Answers to the perceived effects of windrowing 3 – 4 days later than the optimum time on yield and oil content included answers ranging between having little or no effect on either oil or yield, to losing oil to levels as low as 10% final oil content whilst at the same time others believed there were possible gains totalling 60% (and in one instance 75%) oil content.
Views as to the effects on yield were just as varied – some believing there would be little of no change to crop yield, others there would be losses amounting to 1.0 t/ha and others believing the opposite, that there would be gains of an additional 1.5 t/ha if windrowing occurred 3 – 4 days later than the optimum.
Even larger differences in judgements were recorded in response to questions regarding a 7 – 10 day period either side of the optimum windrowing timing. This will be reported later in 2013.
Level of experience
Respondents in the survey included some of the early pioneers of the Australian canola industry. Experience ranged between 40 years and their first year of involvement with canola. Early indications of the data set show no strong relationship between the levels of experience and when the optimum time to windrow is, or its impact on oil content and yield. This will be reported later in 2013.
Earlier analysis of 140 respondents examining correlations with years of experience in the canola industry revealed there to be no significant difference in responses to oil and yield related to optimal windrowing time. The expectation of an increase in yield (from a baseline 2.5 t/ha yield at the optimum windrowing time) with later windrowing timing, 7 – 10 days after the optimum, appears to be less with increasing years of experience (Figure 1).
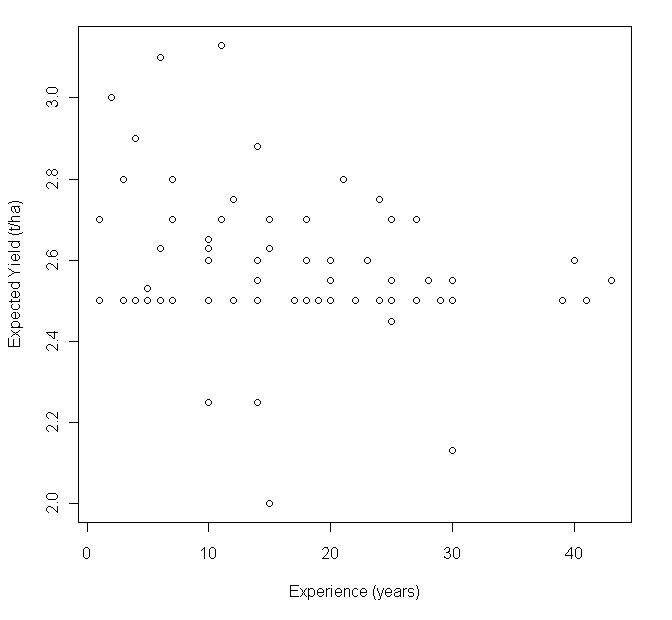
Figure 1: Canola industry experience and expected yield response to windrowing 7-10 days later than optimum
Timing of windrowing
The industry recommended guideline for the optimum timing of windrowing is when 40 – 60% of seed on the main stem has changed colour. Seeds in the pods at the top of the main stem may be green but are firm when rolled between the thumb and forefinger. This is based on research during the early years of the canola industry in Australia.
Colour change
What does it indicate?
Seed colour change reflects late stage physiological processes occurring in the plant involving oil synthesis and dry matter accumulation. While the seed is green, seed filling is continuing, accumulating seed weight, protein and oil.
The green seed begins to change colour when the seed reaches 50 – 55% moisture content. Seed dehydration is progressive, with simultaneous changing colour of the seed coat, darkening from green to red/brown to black. At the same time, the rapid phase of both seed weight and oil synthesis accumulation begins to slow and level out.
Physiological maturity occurs when the seed reaches the maximum seed dry matter accumulation. This is when maximum grain yield is achieved. In canola, this occurs at 35 – 40% moisture content. As moisture content falls below these levels, active seed metabolism ceases and the seed continues to dry down.
Seeds mature progressively up the main stem and from lower branches to the upper branches and ends of branches. Hence, seeds within pods located on the lower main stem are the first to show signs of colour change. They are the most advanced and tend to be the most productive.
What is meant by the term colour change? Does it make a difference?
It is widely assumed that ‘colour change” is a commonly understood term. It became apparent from comments made during survey interviews and discussions as well as specific questions, that the interpretation of ‘colour change’ is many and varied or just not implicit.
Some examples of both verbal and written responses referred to dark green, “just a speck”, “speckled”, “beyond the green”, “red, “rusty”, maroon, light brown, “ brown smudge”, brown, “any colour”, “bronze”, “caramel”, “not necessarily black”, “jet black”, “not black!” and black.
The time period over which a seed has “just a speck” to “black” will vary with seasonal conditions. For example, under the favourable spring growing conditions in CW NSW in 2011, based on these descriptions, the considered views of surveyed people regarding their optimum time to windrow canola ranged somewhere within a period of 23 days at Gilgandra and 25 days at Wellington.
The decision to time operations like windrowing and desiccation for direct heading based on the visible differences in seeds has a significant impact on crop outcomes. Using photographs and recorded observations, the impact of operations at times based on these descriptions is considerable (Table 2).
Table 2: Canola crop value based on description of 40 – 60% seed colour change at Gilgandra & Wellington – 2011
* Based on $500/t
|
|
Gilgandra |
|
Wellington |
||||
|
Seed colour change description |
Oil |
Yield (t/ha) |
*Gross crop value ($/ha) |
|
Oil |
Yield (t/ha) |
*Gross crop value ($/ha) |
|
Dark green |
35.7 |
1.7 |
769.68 |
32.8 |
1.6 |
711.15 |
|
|
“Speck of colour” |
37.7 |
1.8 |
841.95 |
41.3 |
2.5 |
1263.13 |
|
|
Bronze |
42.3 |
2.2 |
1104.95 |
44.5 |
3.3 |
1711.88 |
|
|
Black |
42.3 |
2.2 |
1104.95 |
44.5 |
3.3 |
1711.88 |
|
|
Difference Crop value ($/ha) |
335.27 |
|
1000.73 |
||||
When is the optimum time? What potential difference do a few days make?
The guideline of 40 – 60% of seed colour change on the main stem is used as the basis for the windrowing decision. Canola crops are inherently variable, influenced by prevailing seasonal conditions, aspect, soil type variations, sowing time, cultivar maturity and patchy establishment both within and between paddocks. Combining this with the availability of windrowers creates difficulties with matching practical issues with maximising crop performance outcomes.
Anecdotal evidence frequently refers to windrow timing being several days “too early” or “too late” than desired. The wide mix of perceived consequences of these deviations highlights the poor understanding of physiological processes in canola during the later developmental stages.
The following data was collected from two trials at Gilgandra and Wellington in central NSW in 2011, a season characterised by unusually “soft” spring growing conditions. The mild temperatures and excellent soil moisture levels allowed the canola to grow and develop with minimal environmental limitations.
One of the aims of the trials was to measure the rate of oil and yield accumulation in canola every 3 – 4 days, at the same time measuring the rate of seed colour change on the main stem of the plant. This allowed the impact of the timing of windrowing to be measured, comparing it to the industry recommended guideline of 40 – 60% seed colour change.
Methodology
Sampling commenced less than a week after the end of flowering (GS 69), 48 days (Gilgandra) and 40 days (Wellington) after the start of flowering. The number of sampling times totalled 9 at Gilgandra and 12 at Wellington. Sampling took place every 3 – 4 days initially with later times occurring every 5 – 7 days. At each date a representative area containing approximately 25 plants (G) and 35 plants (W) was taken from the middle 3 rows.
Individual main stem raceme from each plant were removed and divided into basal, middle and upper thirds, placed immediately into an esky containing ice bricks before placement in a refrigerator until processing. Processing was completed within 8 hours of cutting.
Pods were removed from each of the raceme sections and seeds were removed and weighed from a 50 pod sub-sample. From each sub-sample 300 seeds were counted and weighed (fresh weight) then dried for 3 days at 70°C before re-weighing. Seed colour at each date was recorded.
The remaining plant material was cut 20 cm above ground level, placed in bags and air dried. It was then threshed and seed weight, seed size and seed quality including oil, protein, glucosinolates and moisture were determined. Seed quality data were determined using the standard methods described by Seberry et al. (2011). Total oil content of canola was calculated to 6% moisture.
Tables 3 and 4 show the results from the two trial locations, including changes in crop value at base prices of $400, $500 and $600 /t. Where analysed results showed no statistical significance, the median (ie middle) value was used. The percentage colour change refers to the average of seeds on the main stem.
Table 3: Summary of crop data and dollar values at windrowing times – Wellington NSW – 2011
|
|
7 days earlier |
4 days earlier |
Optimum date of windrowing |
3 days later |
10 days later |
|
Date |
21 October |
24 October |
28 October |
31 October |
7 November |
|
Days after end flowering |
28 |
31 |
35 |
38 |
45 |
|
% seed colour change |
3 |
7 |
41 |
90 |
100 |
|
% seed moisture |
54 |
49 |
45 |
37 |
24 |
|
1000 seed weight (g) |
3.155 |
3.389 |
3.942 |
3.942 |
3.942 |
|
Yield (t/ha) |
2.5 |
2.9 |
3.3 |
3.3 |
3.3 |
|
Oil (%) |
41.3 |
43.4 |
44.5 |
44.5 |
44.5 |
|
Yield LSD (<0.05) |
0.3 |
|
|
|
|
|
Oil LSD (<0.05) |
1.7 |
|
|
|
|
|
Value of crop ($/ha) |
|
|
|
|
|
|
$400/t |
989.5 |
1184.36 |
1369.5 |
1369.5 |
1369.5 |
|
Change in value ($/ha) (%) |
– 380 – 28 |
–185.14 –14 |
0 |
0 |
0 |
|
|
|
|
|
|
|
|
$500 /t |
1236.88 |
1480.45 |
1711.88 |
1711.88 |
1711.88 |
|
Change in value ($/ha) (%) |
–475 – 28 |
–231.43 –14 |
0
|
0 |
0 |
|
|
|
|
|
|
|
|
$600 /t |
1484.25 |
1776.54 |
2054.25 |
2054.25 |
2054.25 |
|
Change in value ($/ha) (%) |
–570 – 28 |
–277.71 –14 |
0
|
0 |
0 |
Table 4: Summary of crop data and dollar values at windrowing times – Gilgandra NSW – 2011
|
|
7 days earlier |
3 days earlier |
Optimum date of windrowing |
3 days later |
10 days later |
|
Date |
30 September |
4 October |
7 October |
12 October |
17 October |
|
Days after end flowering |
15 |
19 |
22 |
27 |
32 |
|
% seed colour change |
3 |
13 |
50 |
75 |
97 |
|
% seed moisture |
54 |
45 |
43 |
39 |
27 |
|
1000 seed weight (g) |
2.548 |
3.052 |
3.373 |
3.549 |
3.549 |
|
Yield (t/ha) |
1.8 |
1.9 |
2.2 |
2.2 |
2.2 |
|
Oil (%) |
37.7 |
40.6 |
42.3 |
42.3 |
42.3 |
|
Yield LSD (<0.05) |
0.4 |
|
|
|
|
|
Oil LSD (<0.05) |
2.7 |
|
|
|
|
|
Value of crop ($/ha) |
|
|
|
|
|
|
$400/t |
673.56 |
744.08 |
883.96 |
883.96 |
883.96 |
|
Change in value ($/ha) (%) |
–210.40 –24 |
–-139.88 –16 |
0 |
0 |
0 |
|
|
|
|
|
|
|
|
$500 /t |
841.95 |
930.05 |
1104.95 |
1104.95 |
1104.95 |
|
Change in value ($/ha) (%) |
–210.40 –24 |
–-139.88 –16 |
0
|
0 |
0 |
|
|
|
|
|
|
|
|
$600 /t |
1010.34 |
1116.06 |
2054.25 |
2054.25 |
2054.25 |
|
Change in value ($/ha) (%) |
–210.40 –24 |
–-139.88 –16 |
0
|
0 |
0 |
These trial results support previous research findings, showing the significant yield and oil penalties, and therefore potential economic losses to the grower that may occur when windrowing earlier than industry guidelines.
In the favourable spring conditions of 2011, during the last few days leading up to the recommended windrowing time, the canola was increasing in yield by 100 kg/ha per day and oil content by between 0.3% and 0.6% per day. The proportional change in economic value of the crop earlier than the optimum was very similar at both sites.
Under less favourable finishing conditions, accumulation rates would be expected to be less and where heat and/or moisture stress is severe, the final stages of seed development may be prematurely brought to an end in some seasons. This will influence the practical and economic aspects of harvest management decisions, including the consequences of timing of either windrowing or direct heading.
Conclusions
Data presented in this paper was collected from experiments conducted in 2011 at two locations in central western NSW. The data supports research in the 1970’s and 1980’s that 40 - 60% seed colour change on the main stem is the optimum time to windrow canola.
However, a major change has occurred in canola production over the past decade with the advent of hybrids, at the expense of open-pollinated varieties.
The greater plant vigour of hybrids and lower targeted plant populations in many areas generates potentially more branching on individual plants. Within the hierarchy of branches and pods, seeds are at different stages of development; the potential of seeds is determined by their position within the plant canopy. Competition for assimilates between flowers on the same raceme and between racemes on different branches confer competitive advantages. This change in plant architecture with hybrids may affect the rate of seed maturity and hence visual signs in the crop. Windrow timing in these situations warrants further investigation, especially in the hotter finishing conditions of northern NSW.
Further information
Windrowing is only one consideration when managing general harvest management. The Australian Oilseeds Federation in conjunction with NSW DPI, with funding by the GDRC has produced the Canola Harvest Module as part of the Better Canola Technology Update series.
A more comprehensive summary of canola growth and development, windrowing, direct heading and overall harvest management is available at: http://www.australianoilseeds.com/agronomy_centre/grower_guides
References
Coombes, NE (2002). The reactive tabu search for efficient correlated experimental designs. Liverpool John Moores University, Liverpool, UK.
Seberry DE, Parker PA and Ayton JG (2011) Quality of Australian Canola 2010-11. ISSN 1322-9397, Vol 17, 31-32
Acknowledgements
This work was funded by NSW Department of Primary Industries.
I wish to thank Don McCaffery for his always constructive comments. I would like to thank all survey participants for your time, knowledge, suggestions and enthusiasm. Thank you to Neil Coombes, Biometrician, Dr Neil Fettell, Senior Research Agronomist – NSW DPI, John DeLyall – Pioneer, Scott Boyd – NSW DPI, Barry Unger – NSW DPI, Jayne Jenkins – NSW DPI, Rob Pither – NSW DPI, Jimmy Presley – NSW DPI, Donna Seberry – NSW DPI; and the Mason Family (Wellington) and Kevin and Jenny Kilby (Gilgandra) for the experiment area in their canola paddocks.
Contact details
Kathi Hertel
NSW DPI – DUBBO
Ph: 0427 104 344
Email: kathi.hertel@dpi.nsw.gov.au
Reviewed by
Don McCaffery, NSW DPI, Orange