Nitrogen decision - Guidelines and rules of thumb
Author: Glenn McDonald and Peter Hooper | Date: 12 Feb 2013
Glenn McDonald1 and Peter Hooper
1University of Adelaide
Keywords: cereals, fertiliser, nutrition
Take home points
- In environments where yields are consistently greater than 2.5 t/ha, N applications can be delayed until stem elongation without any loss in yield. In lower yielding environments, the chances of achieving a yield response similar to that achieved with an application at sowing is less.
- There is no consistent difference in the response to N between different forms of N fertiliser.
- In general, increases in grain protein concentration are greater with N applications between flag leaf emergence and flowering.
- Volatilisation losses can be significant in some cases and the greatest risk is with urea and lower with UAN and ammonium sulphate.
When is soil N available?
The soil organic matter is a major source of N for crop growth. The supply of N from mineralisation is dynamic and it is driven by soil moisture and soil temperature. While mineral N is present throughout the year, there are peaks in its availability in autumn and spring when soil conditions are most favourable for mineralisation of organic matter. The mid-year trough in soil mineral N is associated with the low soil temperatures in winter and it will be longer in cooler and wetter environments. Sowing in early May can exploit the greater availability of soil N at the autumn peak.
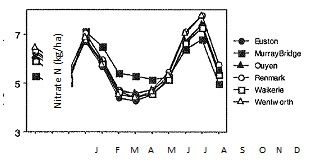
Figure 1. Estimated changes in soil nitrate N during the year at 6 sites in the mallee (Sadras and Baldock 2003)
Uptake of N and metabolism by plants
Plants can take up N through the roots and leaves, but in most cases root uptake is the main pathway. While plant roots can take up N in a variety of forms most is taken up as nitrate because this is the predominant form of N in soil. Once taken up, the N needs to be metabolised to allow growth to occur. This requires a considerable amount of energy and C building blocks as the plant transfers the N from a simple molecule (nitrate) to build larger, more complex molecules like amino acids and proteins. The source of this energy and C is photosynthesis as well as the reserves of soluble carbohydrates in the stems and leaves of the plant. The amino acids and proteins are important building blocks of crop growth and so the higher the crop growth rate the greater requirement for N. The greater the metabolism of N the larger the supplies of carbohydrates and energy are needed. Therefore, there is a strong link between the uptake and metabolism of N by crops, crop growth rates and the carbohydrate reserves in the plant.
The pattern of uptake during the growing season
The demand for N is driven by crop growth rate and the pattern of N uptake will reflect the changes in growth rates during the growing season. Essentially a cereal crop goes through two stages – uptake of N, which drives growth and yield potential, and remobilisation of N to the grain, which influences grain protein.
Typically for a May-sown wheat crop in southern Australia 20-30% of the total N may be taken up by the crop by the start of stem elongation. The greatest demand for N is when the leaf area is expanding rapidly and the crop is growing most rapidly. This corresponds to the period of stem elongation and at this time peak growth rates can be of the order of 200 kg/ha/day and crops can be accumulating N at 2-3 kg N/ha/day. The N taken up at this time is not only helping to build the yield potential of the crop but is also providing the N reserves for grain protein as most of the N present in the grain is derived from N remobilised from the leaves and other green tissues during grain filling.
By flowering, about 80% of the total crop N has accumulated, but this can exceed 90% under dry spring conditions. While the majority of N in cereals is taken up by flowering, crops can still take up N during grain filling if there is sufficient soil moisture, the roots are active and N is present in the soil. This will tend to maintain green leaf area during grain filling and reduce the amount of N remobilised to the grain early in grain filling. These conditions favour starch production in the grain and can lead to low grain protein concentrations.
At maturity more than about 75% of the total N taken up by the shoots during the year has been mobilised to the grain, although this can range from 60% to up to 80%. Under high rates of N the proportion remobilised to the grain tends to be lower compared to low rates of N.
The general response to N supply
A generalised response to N supply is shown in Figure 2 and two phases can be identified. In the first phase (A), yield is most responsive to N. During this phase there may be little change in grain protein concentration or in cases where a crop is very N deficient, grain protein concentration can decline. In the second phase (B) grain yield reaches its maximum and the yield response declines, but grain protein concentration increases more rapidly. Nitrogen use efficiency and the recovery of N fertiliser is greatest in the more responsive phase and nitrogen use efficiency and recovery falls as the yield response plateaus.
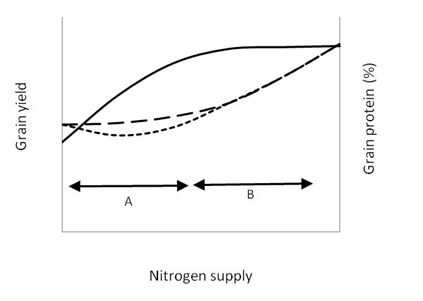
Figure 2. The general response in yield and protein to N fertiliser
Grain yield and protein responses
Yield and protein are often inversely related, but this does not have to be the case. When the supply of N is relatively fixed, grain and grain protein concentration can show a negative relationship: a high yield will ‘dilute’ the N in the grain because it is distributed over a larger quantity of grain. Examples of this are seen when comparing varieties of different yield potentials at the same rate of N or the common observation that protein tends to be lower in high yielding seasons and vice versa. The relationship between yield and protein will also be influenced by where you are on the response curve (Figure 2): in a highly responsive situation a large yield response may be associated with little change in protein or even a decline in protein if a crop is N deficient, but as you approach the optimum rate, increases in both yield and protein occur. Applying N fertiliser at the optimum rate for the anticipated yield or applying it strategically during the growing season can improve yield and grain protein. Applications of N up to mid-stem elongation can be seen as building the foundation of yield and have relatively little effect on protein while later applications of N can be used to maintain or increase protein, but have little or no effect on yield.
Moisture and N
The supplies of water and nitrogen are the major drivers of growth and yield of crops and the two interact to determine crop yield. While availability of moisture is recognised widely as an important factor limiting responses to N, it is also important to realise that lack of N can be an important limitation to soil water use and particularly use of subsoil moisture. Having an understanding of your soil’s moisture holding capacity and information about changes in plant available soil water (PAW) during the growing season are important aspects of N management. Rainfall alone may not indicate whether the crop will use soil moisture reserves. There is a range of tools available to help make informed decisions, including simple push probes, soil moisture probes and crop models such as Yield Prophet®.
While much of N management focuses on improving post-anthesis growth and grain filling, it is more than likely that the effects of N and its interaction with soil moisture are influencing yield earlier by affecting grain number as well as grain size. We should perhaps alter our thinking of ‘terminal drought’ to consider the period commencing around flag leaf emergence rather than limit it to the post-flowering period.
Timing of N applications
Plants are able to take up N at any time during the growing season as long as roots are active and the crop is growing. However the effect of N application on grain yield and grain protein varies according to the time of application.
Nitrogen applications can be delayed until the end of tillering –start of stem elongation (GS30-31) without a significant effect on yield or in some cases an improvement in yield (Figure 3a). However, the ability to exploit delayed N applications depends on the availability of soil moisture and the frequency of rainfall when the N is applied, and in some cases there may be a lower response from a delayed application of N compared to N applied at sowing. In low rainfall areas or in drier seasons rainfall may be too low or variable to get consistent results from delayed N. Figure 3b shows that the risk associated with a delayed N strategy increases at sites were yields were less than about 2,500 kg/ha: the variation in the response to N applied at stem elongation is high and in many cases there are lower yields from delayed applications compared to N applied at sowing. Above 2,500 kg/ha, delaying N application can be made with more confidence.
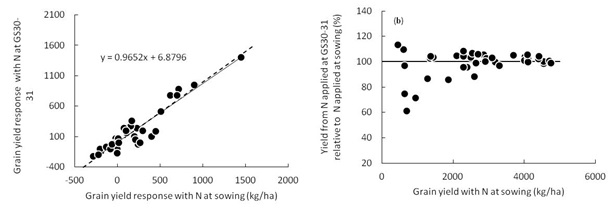
Figure 3. (a) Grain yield responses to N in wheat when the N was applied prior to or at sowing compared to GS30-31. The regression line and the 1:1 line are shown; (b) the corresponding yield responses to N applied at GS30-31 compared to the yield when N was applied prior to or at sowing. Data are from trials in SA and Victoria between 2000 and 2010.
Nitrogen can be applied late in the season to increase grain protein concentration. The most effective time for this is from flag leaf emergence onwards (for example, Figure 4). The effectiveness of applying N to increase grain protein rapidly diminishes after flowering.
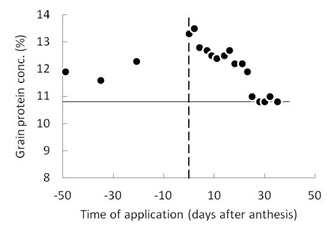
Figure 4. The effect of applying a foliar application of urea at different times during the growing season on the grain protein concentration of wheat. The horizontal line is the grain protein concentration when no N was applied.
The form of nitrogen fertiliser
Experiments over many years have shown that there is no consistent difference in the response to different forms of N fertiliser when compared at the same rate of N and the same time of application. For example, when compared across a number of trials, yields achieved with UAN are little different to those achieved with urea (Figure 5). Similar results have been reported from WA in wheat and canola. There will be occasional differences in responses between forms of N which can be related to things such as timing of rainfall events or soil type. For example losses from volatilisation are often lower with UAN and ammonium sulphate than with urea and so uptake and yield responses can be greater in these cases. However the main considerations with the choice of N fertiliser will be price per unit N and the corresponding net returns from N as well as the logistics associated with transporting, storing and applying N, rather than any intrinsic differences in their agronomic value.
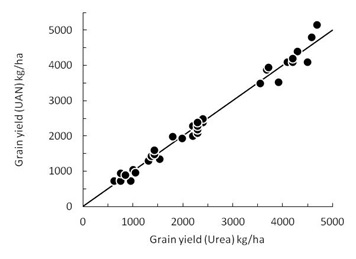
Figure 5. The relationship between the grain yield using urea or UAN as the source of N. The data were from trials on the Eyre Peninsula, Yorke Peninsula, Hart and Birchip between 2000 and 2010.
The line is the 1:1 line. Across all experiments there was no significant difference in the yield with urea and the yield with UAN.
Losses of N
Nitrogen fertiliser can be lost from the soil in three main ways: by leaching, from denitrification and by volatilisation. Leaching occurs when water draining through the soil profile carries dissolved N, but N not leached beyond the root zone is still recoverable by the roots later in the season. Denitrification occurs in wet soils when the oxygen concentration falls and microbes use nitrate instead of oxygen to support their growth. In denitrification, nitrate is converted to oxides of N and are lost to the air. Volatilisation is the loss of N from the soil as ammonium gas. Volatilisation losses are affected by:
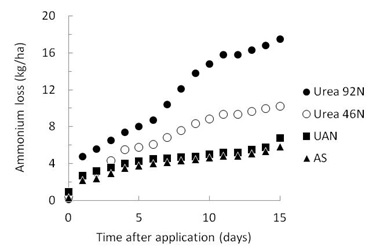
Figure 6. The cumulative loss of N as ammonia from three different types of N fertiliser at Longerenong, Victoria. The N rates were 92 kg N/ha and 46 kg N/ha of urea and 46 kg N/ha for UAN and ammonium sulphate (from Turner et al 2012).
- Weather conditions: warm soils and windy conditions are conducive to high losses from volatilisation
- Soil pH: volatilisation losses are higher in alkaline soils
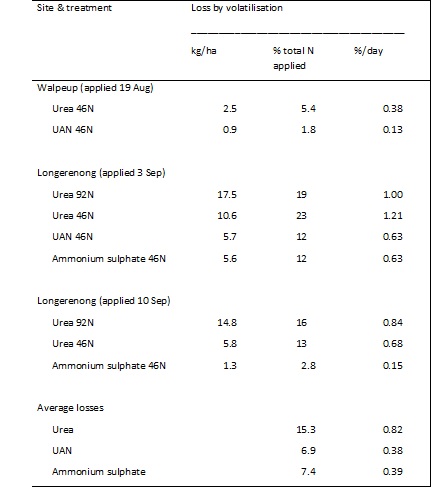
- Form of N: ammonium-based fertilisers are more susceptible than nitrate-based fertilisers. Losses from urea can be high, while losses from UAN and ammonium sulphate are considerably lower (Figure 6). Recent work from Victoria suggest losses of N from volatilisation of up to 1% per day with urea and about half that for UAN and ammonium sulphate (Table 1).
- The degree of incorporation: N left on the surface is more susceptible than N incorporated, banded or washed into the topsoil.
- Soil moisture: Losses tend to be greater when fertiliser is applied to dry soil.
The importance of weather conditions on losses is illustrated in Table 1. When 46 kg N/ha was applied as urea 10.6 kg N/ha was lost in the 18 days after application, whereas 5.8 kg N/ha was lost when the same amount was applied a week later when the soil was moist and rain fell soon after application. Similar results were observed with ammonium sulphate. Topdressing urea on alkaline soils in spring without sufficient rainfall to wash it into the soil can result in significant losses of N from volatilisation.
Decisions on N management
The two main questions with N management are how much N needs to be applied and when should it be applied. While there are a variety of approaches to N management, the
Table 1. Total ammonia losses from N fertiliser applications 2-3 weeks after application to wheat or barley crops at two sites in Victoria (Source: Turner et al 2012).
basis of most is an N budget. Altering timing will improve fertiliser use efficiency by matching crop demand to N supply and increasing recovery of N fertiliser.
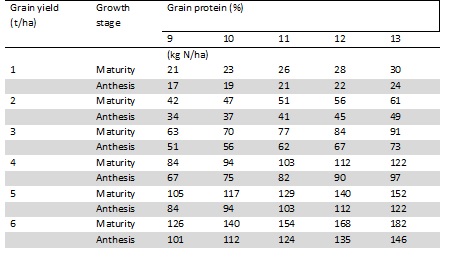
The critical factor in budgeting is the target yield and protein as crop yield potential is the major driver of N requirement. As a guide Table 2 shows the N required for different yield and protein combinations at maturity and anthesis. For example if you are targeting a 3t/ha crop at 11% protein you would need to have about 62 kg N/ha taken up by the crop by flowering. The amount of fertiliser N required will depend on your estimate of fertiliser recovery, but if you work on a 50% recovery, you would need to supply 134 kg N/ha.
Clearly predicting yield during the growing season is crucial to allow growers to make tactical decisions on N management. Recent experience in the mid-North has shown that Yield Prophet ® can predict yields accurately in mid-August and can assist with N decisions. Other tools, such as the PIRSA-CSIRO N calculator provide a way of calculating N budgets and estimating N requirements.
Table 2. Nitrogen requirements for cereal crops at different combinations of yield and grain protein at maturity and the corresponding N required at anthesis. The estimates are based on the assumption that 75% of the total crop N is in the grain at maturity and that 80% of the total N is taken up by anthesis
Some factors influencing N decisions
The variability of N responses and the strong influence of seasonal conditions and soil properties on N responses means that local experience will be a strong guiding influence on N management. However there are a number of general principles and recommendations that can be followed.
Yield potential
Grain yield is the main determinant of crop N requirement (Table 2) and will influence the amount of fertiliser N needed and the timing of N applications. In the higher rainfall areas delayed and split applications are useful strategies to manage growth, yield and grain protein concentration. In low rainfall environments (e.g. when average target yields are ~1.5 t/ha or less) the benefits of these strategies are less useful and you may as well apply all the N early because (a) the total N requirements are low so the N rates are small (Table 2), (b) it is likely that the rainfall is too low and/or variable to make delayed or split applications reliable (Figure 3b) and (c) soil mineralisation can make a significant contribution to the crop N budget (Figure 1). There will be exceptions to this, such as years with very wet seasons.
Sowing date
Early or dry sowing generally increases initial nitrogen uptake by crops and promotes early crop growth due to warmer soil and higher air temperatures. Warm soil increases the potential for mineralisation and can increase root growth which acquires more nitrogen and produce more tillers and dry matter. The general rule is the earlier the sowing, the later the nitrogen can be applied.
Conversely, crops sown into cold, wet soils will grow slowly and will not take up and use N effectively. This is important in higher rainfall environments where wet, cold soils can cause losses from denitrification and leaching.
Crop maturity
Nitrogen requirement is driven by crop yield potential. High yielding varieties will require higher rates of N to maintain yield and protein. Crop maturity may also be important. In general terms a mid-season or long season wheat sown early will have a higher yield potential than a short season wheat and so will need higher inputs of N. Long season wheats will probably benefit more from strategic applications of N during the year than short season wheat. Generally more nitrogen can be supplied earlier in the season to earlier maturing or low tillering varieties.
Cropping history and residual soil N
Legume crops and pastures will generally, but not always, leave more residual N than non-cereal crops. Fallowing can also promote mineralisation and often the response to fallow is as much a N response as a moisture response. However the amount of soil mineral N is highly variable and second-guessing the amount of N present in soil is problematical: it is advisable to measure the soil nitrate reserves in autumn.
If farmers do not want to undertake regular or extensive soil testing, an alternative approach is to test a range of paddocks with different cropping histories on representative soils to develop a ‘feel’ for the influence of cropping history on the amount of soil N. Once the effect of specific cropping histories on the amounts of soil N is understood it can be applied across the farm or soil types.
Delaying the application of nitrogen in paddocks with low soil nitrogen can be detrimental and should be avoided. Low soil N might occur after a number of cereal crops or high yielding legumes, when large volumes of stubble have been retained, when there are high weed populations or a history of low N application rates.
Grazing and N
It is important to have adequate supplies of N if crops are to be grazed. Removal of biomass by grazing will remove N and grazing can reduce root growth, which may affect the ability of plants to take up soil N. A cereal crop can contain 25-35 kg N/ha per tonne of crop biomass at the start of stem elongation (GS31) or more than this in paddocks with a very high level of fertility, so significant amounts of N can be removed by grazing. Grazing commonly reduces the amount of N recovered by crops later in the season.
Stored soil water
Water stored from summer or autumn rains will generally increase early crop growth and reduce the need to apply early nitrogen. However, stored moisture will also increase the yield potential of a crop and adequate N needs to be supplied to fully exploit the N. Recent work at Hart has indicated that the benefit of subsoil moisture accumulated over autumn was in promoting growth prior to anthesis rather than maintaining grain growth. During this part of the growing season stored moisture provides a buffer against warm and dry conditions, improving the reliability of nitrogen applications. Nitrogen applications during stem elongation are far more risky without adequate reserves of stored moisture.
Work by the Mid North High Rainfall Zone Group has found that PAW at the crop flowering stage in cereals is a valuable predictor of final grain yield. For example a 2 t/ha crop requires 20mm plant available water (PAW) at flowering and a 4 t/ha crop requires 50mm PAW at flowering.
Early crop growth and in-season monitoring
Probably one of the oldest methods of understanding soil nitrogen is to assess the level of crop vigour. Early crop dry matter, crop colour and tiller number are strong indicators of crop N. Crop ground cover and NDVI at the beginning of stem elongation are good indicators of the likelihood that extra nitrogen can improve yield potential. Using N-rich test strips can be a useful method of assessing the N responsiveness of a crop and guide in-season N management. The responses in vegetative responses are commonly assessed using a crop sensor. The critical factor with the technique is to develop reliable relationships between the response in vegetative responses and in yield responses and this will likely depend on developing local calibrations.
Images of crop growth taken with tractor-mounted sensors or satellites provide a good method for measuring crop variability across a paddock. The maps produced can be used for variable rate N application depending on soil types and paddock history.
The importance of leaf area as a determinant of crop N uptake has been recognised for many years and consistent relationships between green leaf area and crop N uptake have been reported. In winter wheat crops in the UK, there is 25-30 kg N/ha per unit green area index and some unpublished work from the mid North suggests a similar relationship holds here. Linking this principle to non-destructive measures of leaf area or canopy cover using sensors such as a Greenseeker® or a digital camera can provide estimates of N uptake early in the growing season (Figure 7). The usefulness of this approach weakens as crops enter stem elongation and as full canopy closure is approached.
However, in the case of all crop sensors, you need to be sure that the differences in canopy cover and leaf greenness are caused by N and not some other limiting factor: N needs to be applied to crops that will be responsive to the additional N.
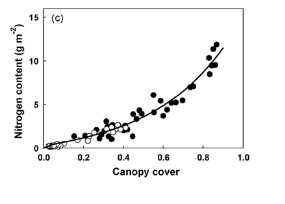
Figure 7. The relationship between crop N uptake and the degree of canopy cover for two winter wheat varieties grown in southern NSW. Canopy cover was measured using a digital camera (Li et al 2010)
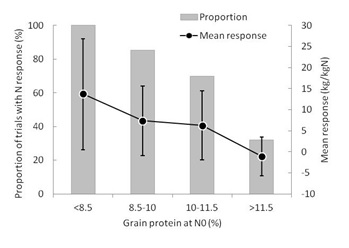
Figure 8. The relationship between the grain protein concentration of wheat and the response to N fertiliser applied at sowing based on trial results from South Australia and Victoria between 2001 and 2009. The data show the proportion of trials in which a positive response to N was measured (grey bars) and the mean yield response (black line). Error bars are standard deviations.
Grain protein as an indicator of crop N status
The idea of using grain protein concentration to assess the likelihood of N responsiveness wheat in cropping systems in South Australia was described 50 years ago (Russell 1963): the work suggested that yield responses were most likely when grain protein concentration was < 11.4%. Based on recent trial data, the general conclusion still appears valid (Figure 8): 100% of all trials where the grain protein concentration of the unfertilised control was <8.5% were responsive to N and would have given a mean yield response of 14 kg/kg N. When grain protein concentration was >11.5%, only 32% of the trials were responsive to N and the mean yield response was zero. While this relationship can’t be used to make in-season N decisions it may be useful in helping to assess the degree of N stress during the previous season and making post-harvest assessments of N management strategies, which can help with future planning.
Some general recommendations
If farmers do not use decision making tools such and N calculator or Yield Prophet® to help make decisions about N management in wheat, there are some general recommendations than can be followed:
- Target a yield potential at the start of the season, whether it is based on average wheat yield or average plus a bit, depending on your optimism.
- Estimate the amount of N available from the soil, based on soil testing or on guidelines established from a number of years of paddock histories and local experience.
- Calculate the amount of N required to reach your target
- Apply 70-80% of the N required between mid tillering and mid stem elongation. Adjust the timing of the application depending on initial soil N and factors such as time of sowing
- The remaining N can be applied later, up to flag leaf emergence, to maintain or boost grain protein depending on seasonal conditions and soil moisture availability. The rates of N can be adjusted in response to seasonal conditions.
References
Russell JS (1963). Nitrogen content of wheat grain as an indication of potential yield response to nitrogen fertilizer. Australian Journal of Experimental Agriculture and Animal Husbandry 3: 319-325
Sadras VO, Baldock JA (2003). Influence of rainfall events on water driven processes II Soil nitrogen mineralisation in a semi-arid environment. Australian Journal of Agricultural Research 54: 353-361.
Li Y, Chen D, Walker CN, Angus JF. (2010) Estimating the nitrogen status of crops using a digital camera. Field Crops Research 118:221-227.
Turner DA, Edis RE, Chen D, Freney JR, Denmead OT (2012) Ammonium volatilisation from urea fertilizers applied to cereals in two cropping areas of southern Australia. Plant and Soil 93: 113-126.
Contact details
Glenn McDonald
School of Agriculture, Food and Wine, University of Adelaide,
Waite Campus, PMB 1, Glen Osmond, SA 5064
08 8313 7358
Was this page helpful?
YOUR FEEDBACK