The fundamentals of increasing nitrogen use efficiency (NUE)
The fundamentals of increasing nitrogen use efficiency (NUE)
Author: Chris Dowling | Date: 11 Feb 2014
Chris Dowling,
Back Paddock Company
Take home messages
- Improving NUE begins with identifying and measuring meaningful NUE indices and comparing them with known benchmarks and contrasting N management tactics.
- Potential causes of inefficiency can be grouped into six general categories. Identification of the most likely groups is useful in directing more targeted measurement and helping identify possible strategies for improvement.
- As result of seasonal effects, NUE improvement is an iterative process therefore, consistency in investigation strategy and good record keeping are essential.
Introduction
Increasing nitrogen use efficiency (NUE) slips off the tongue easily as a noble goal for increasing profitability and sustainability of grain production, but a broad chasm still exists between the aspiration and reality in paddock.
The journey toward improved N use efficiency is notionally complex because of the large range of variables that impact yield, hence nitrogen (N) requirement. However, this journey can possibly be simplified by turning the challenge on its head and reinstating the goal in terms of ‘identifying and then addressing sources of N inefficiency’.
It is critical in the journey to improving resource management of any type to ensure that the descriptive terms used are well defined and measured. In casual conversation farmers are frequently asked about the fuel usage efficiency of their family car and without hesitation give a prompt answer, and yet when I as the same question about nitrogen and water I get a sheepish look and the answer ‘not sure or I don’t know!’ Therefore the first fundamental of increasing N use efficiency is to establish some standard metrics and establish as baseline what the paddock NUE situation is now?
Poor or ill-defined NUE measures can create both unrealistic goals and wasted effort. High efficiency in itself is not the ultimate goal as it must be balanced with profitable yield (Figure 1). Some of the inertia in measuring NUE comes from the general lack of definition of meaningful NUE indices useful to farmer’s base N management strategies and tactics.
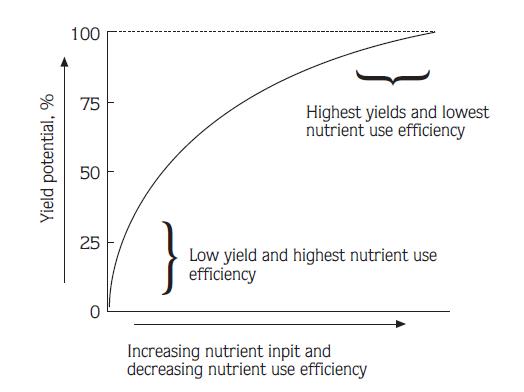
Figure 1. Understanding NUE in relation to yield potential is critical in assessing potential for improvement (Roberts 2008).
The most common measures of N use efficiency are outlined in Table 1.
Table 1. Agronomic indices of N use efficiency and their typical ranges in cereals (adapted from Dobermann, 2005)
|
NUE Index |
Definition |
Common Values |
Interpretation |
|---|---|---|---|
|
PFPN - Partial factor productivity of applied N (often simply called nitrogen use efficiency or NUE) (kg harvest product per kg N applied) |
PFPN = YN/FN |
40–70 kg grain kg-1 N >70 kg kg-1 at low rates of N or in very efficiently managed systems |
Most important for farmers because it integrates the use efficiency of both indigenous and applied N resources: PFPN = (Y0/FN) + AEN Increasing indigenous soil N (Y0) and the efficiency of applied N (AEN) are equally important for improving PFPN Limited potential for identifying specific constraints or promising management strategies. |
|
AEN = Agronomic efficiency of applied N (kg yield increase per kg N applied) |
AEN = (YN – Y0)/FN |
10–30 kg grain kg-1 N >30 kg kg-1 in well managed systems or at low levels of N use or low soil N supply |
AEN is the product of the efficiency of N recovery from applied N and the efficiency with which the plant uses each additional unit of N acquired: AEN = REN x PEN AEN can be increased by N, crop, and soil management practices that affect REN, PEN, or both. |
|
REN = Crop recovery efficiency of applied N (kg increase in N uptake per kg |
REN = (UN – U0)/FN |
0.30–0.50 kg kg-1 0.50–0.80 kg kg-1 in well-managed systems or at low levels of N use or low soil N supply |
REN depends on the congruence between plant N demand and the quantity of N released from applied N. REN is affected by the N application method (amount, timing, placement, N form) as well as by factors that determine the size of the crop N sink (genotype, climate, plant density, abiotic/biotic stresses). |
|
PEN = Physiological efficiency of applied N (kg yield increase per kg increase in N uptake from fertilizer) |
PEN = (YN – Y0)/(UN –U0) |
30–60 kg kg-1 >60 kg kg-1 in well managed systems or at low levels of N use or low soil N supply |
PEN represents the ability of a plant to transform N acquired from fertilizer into economic yield (grain). PEN depends on genotypic characteristics (e.g., harvest index), environmental and management factors, particularly during reproductive growth. Low PEN suggests sub-optimal growth (nutrient deficiencies, drought stress, heat stress, |
|
Nitrogen Transfer Efficiency (NTE) (kg N in grain/kg total crop available N) |
NTE= YN/ F0 + FN |
40 - 60% 50 % general related to a target protein for optimum yield >60 % indicating likely yield penalty from insufficient N supply < 25 % generally related to high protein content in cereal grain, stranding of mineral N or over estimation of mineralisable N. |
NTE integrates REN, PEN and total nitrogen supply (FN + Fo). Efficiency term most frequently used in determining crop N demand in N budgets. In some crops mathematical in relationship with grain protein content/oil % has been established. |
|
$ Agronomic Efficiency ($AE) |
$YN-Y0/ $F N |
Optimum generally given as 1. >1 indicates increase in fertiliser cost is not being recovered in increase grain value. |
Consideration also needs to be given to factors such as opportunity cost of money applied to fertiliser, interest cost and risk premium in determining acceptable $AE. |
FN – amount of (fertilizer) N applied (kg ha-1)
F0 -amount of N available other than from fertiliser ((kg ha-1)
YN – crop yield with applied N (kg ha-1)
Y0 – crop yield ((kg ha-1) in a control treatment with no N
UN – total plant N uptake in aboveground biomass at maturity (kg ha-1) in an area that received N
U0 – the total N uptake in aboveground biomass at maturity (kg ha-1) in an area that received no N
The second fundamental of improving NUE is identifying and calculating the most useful indices and having consideration of them in formulation of rotation strategies and crop fertiliser tactics. For me AEN, $AEN and NTE are the most relevant and are reasonably easy to measure and calculate.
Fundament three is the identification of the likely causes of N use inefficiency (NUI). This will define the N strategy and tactics that are most relevant in addressing improvement in NUE in a particular situation.
Sources of N use inefficiency (NUI)
NUI has it origin both in the soil environment and within the plant. In both cases the interaction with growing season conditions make single season measurements of NUE unreliable without measurement of a contrasting management practice in the same season or as a longer term trend. Some of more common factors that increase NUI include:
Supply greater than demand - oversupply
Oversupply occurs where N availability is greater than crop/ grain demand. This decreases NUE from an annual perspective where the residual N is lost, however where losses are negligible (low fallow rainfall) rotation NUE may still be maintained. Oversupply frequently occurs as a result of over-estimation of yield potential, lack of consideration of soil N mineralisation potential and under- estimation of residual soil mineral N. The need for fertiliser N, stems from a decreasing contribution from soil organic pools both fresh (low legume frequency and duration in rotations) and ongoing rundown in labile and humic fractions (Figure 2). Where N mineralisation potential is ignored in any assessment of crop N requirements there is a possibility of fertiliser N over application, increased denitrification (Dn) loss (Harris 2013) and decreased NUE.
In southern grain production zones, mineralised N is calculated as a function of organic carbon % and growing season rainfall in-crop. However, the calculation may underestimate mineralisable N supply following pulse crops, legume rich pasture phases or where there has been recent addition of manures or composts. Alternatively, it may over-estimate available N following wet summer fallows where leaching or Dn has occurred.
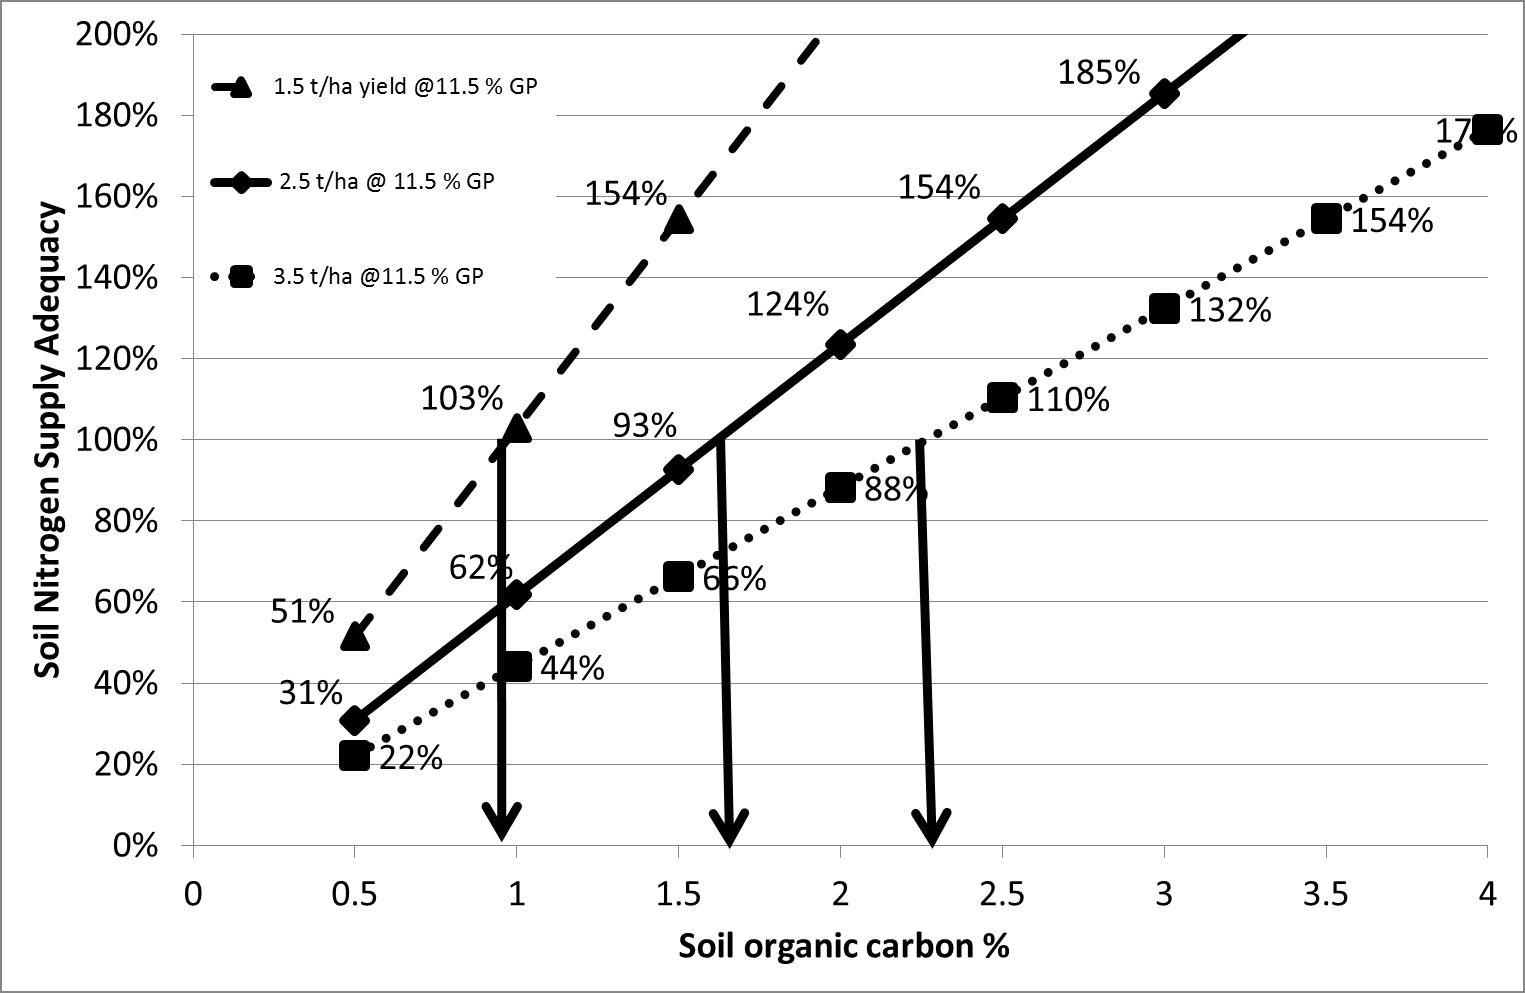
Figure 2. Ability of soil organic matter N mineralisation to meet crop yield and grain protein demand.
Another potential link to low NUE from oversupply is failure to recognise the quantity and location of residual soil mineral N. Simple observations such as grain protein % in previous cereals crops is a good guide to likely existence of residual mineral N.
Inefficient nitrogen uptake
Poor efficiency from pre-sowing and at-sowing application is as a result of loss mechanisms such as volatilisation, denitrification and leaching or temporary unavailability due to soil processes such as immobilisation. In-crop applications of N (particularly those between Z31 and 37) reduce the time that applied N is subject to loss processes and increases the chance of interception when a significant root stricture is present and aboveground biomass demand is increasing rapidly (Figure 3).
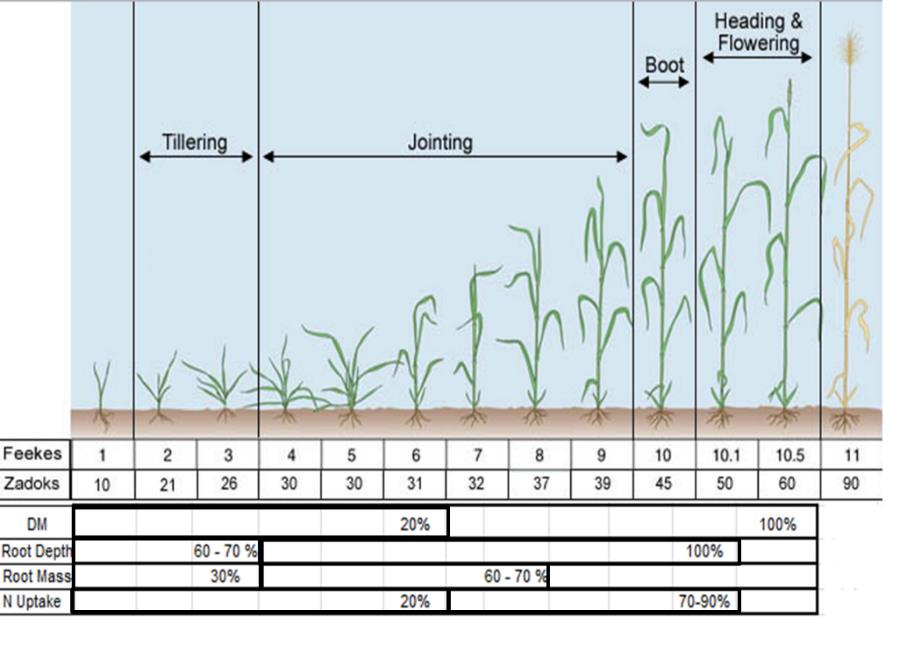
Figure 3. Generalised development of aboveground biomass and root activity in cereals at a range of growth stages.
Fertiliser N efficiency is also affected by the amount of soil available N at sowing that accumulates as residual N from the previous season and as mineralised N. High fertiliser efficiency is most common where soil residual N and the contribution from in crop mineralisation is low, loss processes are minimal and other management factors such as weeds, disease, sowing date, rate and cultivar selection are appropriate. There is no doubt that inappropriately high biomass production early in the season due to N availability may create poor efficiency (van Herwaarden 1996).
Applied but temporarily unavailable
- Inefficiencies occur if the process of immobilisation is significant and allowed to compete with a growing crop to the detriment of crop yield, and occurs parallel with nitrification. Net immobilisation reduces available N to the growing crop. Up to 18 kg of N/ tonne of cereal stubble can be consumed in the immobilisation process.
Applied or mineralised, but lost from soil due to:
- Leaching (summer mineralised N and residual mineral N) – at risk in sandy soils
- Ammonia volatilisation – generally a loss of N associated with applied N, particularly products that at some stage create ammonium-N after application e.g. urea, DAP, chicken manure. Under conditions favourable for loss, 10 – 20% of applied N may be lost in a 4 day period after application (Turner et al. 2010, Turner et al. 2012) but the effect on yield of this loss is not always expressed proportionally. Recent research has also indicated that urease inhibitors are able to reduce the rate of urea hydrolysis but saving N needs to be related to the reliability of producing higher yield or improved profitability (Suter et al. 2011).
- Denitrification – significant denitrification losses are mostly related to conditions of high soil moisture. Research in recent years suggests:
- Dry seasons – minimal waterlogging, mostly associated with nitrification of urea (Officer et al, 2013).
- Wet periods associated with water filled soil porosity (WFSP) >70% creates conditions for higher rates of Dn (Harris, 2013). Degree of loss primarily a function of the quantity of nitrate and labile carbon co-located in soil layers, soil temperature and duration of WFSP>40% (Chen 2010).
- Some nitrification inhibitors have shown potential for reducing losses but effects variables such as soil temperature (Chen et al. 2010) need to be further investigated to increase the reliability.
- Poor summer weed control – recent research (Table 2) suggests up to 36 % decrease in fallow N where weeds are not controlled.
Table 2. Controlling summer weed provides an increase in fallow N - total nitrogen levels (kg/ha) from 0-120 cm (Haskins et al. 2012)
|
Treatment |
Nitrogen (kg/ha) |
|---|---|
|
Complete spray |
168.9 |
|
Delayed spray |
143.3 |
|
Missed first spray |
126.5 |
|
Nil spray |
124.3 |
|
Average |
140.7 |
Available in soil but not taken up due to:
- Positional unavailability - active root mass is at distance from mineral N sources for significant period of crop growth.
- Release synchronisation – timing of release or transformation of the applied product (organic matter, modified release N fertiliser) to a plant available mineral N form does not meet crop demand or is more exposed to losses.
- Limitation to root mass – root depth and density is restricted by chemical (e.g. phosphorus), physical (e.g. compaction) or biological (root disease) factors.
Taken up to biomass but not transferred to grain
The pathway of nitrogen to grain is a two part process, part one being the uptake from soil and incorporation into vegetative plant parts, part two being the mobilisation of N from vegetative parts and incorporation into grain proteins. Where nitrogen is taken up into above ground biomass (i.e. part one) but not relocated to grain, NUE indexes are affected (e.g. NTE and AE), but the cause can be uncertain. In comparison, those indices related to crop N uptake (REN and PEN) will generally highlight problems with remobilisation and transfer. Some of the factors that can influence NUE include:
Genetics - generally the relationship between grain protein and yield is negative for a given quantity of available N in cereals. However among recently released varieties there appears to be some varieties that have consistently higher grain protein for a given grain yield (Figure 4). Whether this is a function of uptake efficiency or remobilisation efficiency is not yet clear.
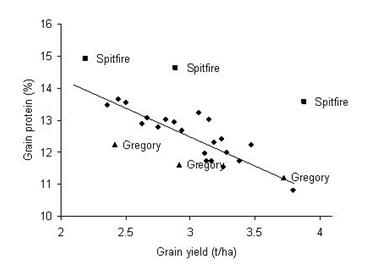
Figure 4. Grain yield and grain protein of 14 main season wheat varieties for three sowing dates at Condobolin, 2011.
The trend line (excluding Gregory and Spitfire) show that grain yield and grain protein were negatively correlated (R2=0.74). LSDs were 0.3 (yield) and 0.27 (protein) (Fettell et al. 2012).
- Environmental conditions - remobilisation and translocation of nitrogen stored in stems and leaves to the grain during the grain filling period is influence by atmospheric temperature and soil moisture relationships. Extreme conditions, during grain fill can influence apparent NUE. The combination of grain size and grain protein% is generally a guide to an aberrant outcome.
References
Chen D, Suter HC, Islam A, Edis R (2010) Influence of nitrification inhibitors on nitrification and nitrous oxide (N2O) emission from a clay loam soil fertilized with urea. Soil Biology and Biochemistry 42(4), 660-664
Dobermann AR (2005) Nitrogen Use Efficiency – State of the Art", Agronomy & Horticulture - Faculty Publications. Paper 316 (http://digitalcommons.unl.edu/agronomyfacpub/316, accessed 31/12/13).
Fettell N, Brill R, Gardner M and McMullen G (2012) Grain protein – How important is variety choice? http://www.grdc.com.au/Research-and-Development/GRDC-Update-Papers/2012/02/Grain-protein-How-important-is-variety-choice, accessed 30/12/2013).
Harris R, Officer S, Hill P, Armstrong R, Fogarty K, Zollinger R, Phelan A, Partington D (2013) Can nitrogen fertiliser and nitrification inhibitor management influence N2O losses from high rainfall cropping systems in South Eastern Australia? Nutrient Cycling in Agroecosystems 95(2), 269-285.
Haskins B, McMaster C, Menz I and Muirhead T (2012) Report of Wheat fallow efficiency x nitrogen trial-Rankins Springs (http://n.b5z.net/i/u/10169267/f/Fallow_Trial_Rankin_Springs_2012.pdf, accessed 31/12/2013)
Officer SJ, Phillips F, Kearney G, Armstrong RD, Graham J, Partington DL (2013). Increased nitrous oxide flux in response to urea fertiliser in a semi-arid climate, identified by smoothing spline model. Soil Research (in press).
Roberts, TL (2008) Improving Nutrient Use Efficiency, Turk. J. Agric. For., 32,177-182
Suter, H., Pengthamkeerati, P, Walker, C and Chen, D (2011) Influence of temperature and soil type on inhibition of urea hydrolysis by N-(n-butyl) thiophosphoric triamide in wheat and pasture soils in Southeastern Australia, Soil Research 49; 315-319
Turner DA, Edis RE, Chen D, Freney JR, Denmead OT (2012) Ammonia volatilization from nitrogen fertilizers applied to cereals in two cropping areas of southern Australia. Nutrient Cycling in Agroecosystems 93(2), 113-126.
Turner DA, Edis RB, Chen D, Freney JR, Denmead OT, Christie R (2010) Determination and mitigation of ammonia loss from urea applied to winter wheat with N-(n-butyl) thiophosphorictriamide. Agriculture, Ecosystems & Environment 137(3–4), 261-266.
van Herwaarden AF (1996) Haying-off in wheat: enduring myth or current problem? "Agronomy - Science with its sleeves rolled up". Edited by DL Michalk and JE Pratley. Proceedings of the 8th Australian Agronomy Conference, 30 January - 2 February 1996, The University of Southern Queensland, Toowoomba, Queensland.
Contact Details
Chris Dowling
Back Paddock Company P/L
PO Box 823, Cleveland, Qld, 4163
0407 692 251