Tolerance of wheat varieties to soil acidity and soil aluminium
Tolerance of wheat varieties to soil acidity and soil aluminium
Author: Mohammad Amjad, Craig Scanlan, Ross Brennan and Bob French - DAFWA | Date: 20 May 2014
Tolerance of wheat varieties to soil acidity and soil aluminium
Mohammad Amjad, Craig Scanlan, Ross Brennan and Bob French, Department of Agriculture and Food Western Australia
Key messages
- Substantial varietal variation in response to soil acidity (low soil pHCa and high Al) liming and P fertiliser on acidic loamy sand soils was observed for anthesis biomass, grain yield and quality.
- No current WA varieties exhibited poor tolerance to soil acidity and soil aluminium in 2013.
- Growers can choose two or three current WA varieties of different traits to spread the production risks while adopting the strategy of applying lime for cropping acidic soils.
Background and aims
Soil acidity is a major limitation to wheat productivity in Western Australia. The impact of soil acidity can be significantly reduced by combining the strategy of liming with selection of aluminium (Al) tolerant wheat varieties. Tang et al. (2003) measured the root length and screened 115 genotypes in the glasshouse experiments for tolerance of soil acidity. They found substantial genotypic differences in acidity tolerance at pH 3.9. During 2012, a hydroponic technique was used to test 24 wheat varieties for their tolerance to Al (Amjad, 2013), with the Al tolerant cv. Cotipora and Al sensitive cv. Egret as checks. The criterion for Al tolerance was the reduction in root length for plants growing in nutrient solution with pH 4.2 and Al 12 ppm (12 mg/kg) compared to a solution at pH 6.5. Based on this criterion, recently released Western Australian varieties displayed better tolerance to Al compared to the sensitive check Egret. Varieties were ranked in order of increasing tolerance are Calingiri, Scout, Yitpi, Wyalkatchem, Mace, Cobra, Corack, Magenta, Emu Rock, Estoc and Westonia.
While most WA cropping paddocks have sufficient phosphorus levels, the soil pH below the critical level of 4.8 generally decreases phosphorous availability on acidic soils. During 2013, a subset of the varieties tested in 2012 was tested in the field at Merredin. The aim of this work was to assess the tolerance of wheat varieties to soil acidity and its interaction with phosphorus (P) nutrition in the field.
Method
The trial was located on Merredin Research station on a sandy loam soil (in Paddock T6S) with known problems of low pH and high Al toxicity. This site was established and treated with 3 t/ha lime sand applied in 20 metre wide strips in 2008. Following barley (2008), fallow (2009), fallow (2010) and barley (2011) another 3t/ha of lime was applied to the strips in early 2012 prior to cultivation and a chemical fallow for the growing season. Soils were sampled in 10 cm intervals from both limed and unlimed strips in 2013. The soil analysis confirmed that soil pH was low and decreased with depth down to 40 cm, and extractable Al increased with depth to 40 cm (Figure 1). The soil analyses indicated more than 40 mg kg Colwell P in top soil and decreased with depth in the subsoil. The phosphorus buffering index (PBI) was also high on this site. Soils with high PBI generally lock up large amount of P, and make it unavailable for plant uptake.
Twelve recently released wheat varieties of different maturity and traits (Calingiri, Cobra, Corack, Emu Rock, Estoc, Mace, Magenta, RAC1859, Scout, WAGT328, Westonia and Wyalkatchem) were sown on the site on 4 June 2013 with either 0 or 30 kg/ha P. The trial was a split plot design with limed and unlimed treatments as main plots, varieties × P rates as subplots, and three replicates. The plot size was 20 m x 1.54 m.
Sulphate of potash was topdressed at 120 kg/ha (50 kg K, 20 kg S) as a basal fertiliser at seeding and urea was drilled at 33 kg/ha (15 kg N/ha) with seed at seeding. P fertiliser was drilled (0 P and 30 kg P) with the seed in the relevant treatments. Urea was topdressed at 65 kg/ha (30 kg N/ha) 6 weeks after sowing.
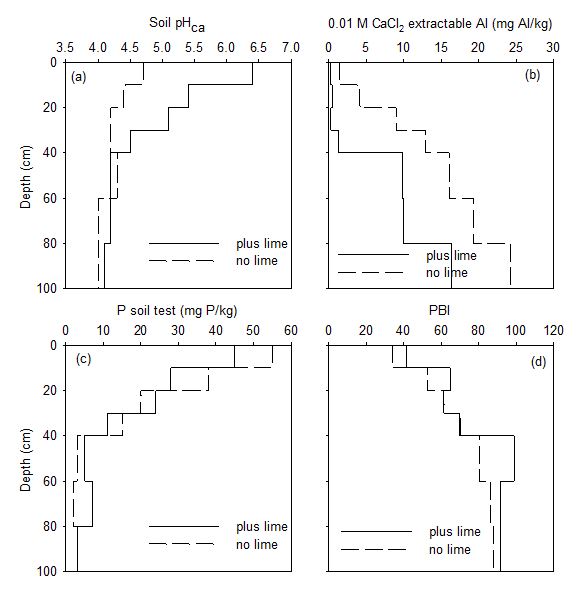
Figure 1. (a) Soil pHCa, (b) Al concentration (mg Al/kg), (c) P soil test (mg P/kg) and (d) PBI in soil profile of the limed and unlimed strips at Merredin in 2013 (Lsd (p=0.05) pHCa: 0.2, Al: 3.7,P: 7, PBI: 10.5 ).
Results
Seasonal rainfall (May-October, 193 mm) was close to average at Merredin in 2013. Summer (January to March) rain of 114 mm provided stored soil water, late May rain provided a sowing opportunity which was followed by a dry June (8 mm) and July (36 mm) with conditions improving in August (43 mm) and favourable in September (50 mm) and October (20 mm).
Plant establishment and dry biomass weights
Unfavourable seedbed conditions and dry conditions early in the season (during June and early July) reduced plant establishment by 25% below the target plant population of 100 plants/m2. The main effect of variety on plant establishment was significant but liming and P application had no effect. Cobra, Mace, Magenta, Estoc and Wyalkatchem established more plants than Calingiri (Table 1).
Magenta produced the highest anthesis biomass (3.3 t/ha), and Calingiri and Estoc the least (Table 1). The lower plant population of Calingiri may have contributed to this. P application increased anthesis biomass by 24% (3.24 compared to 2.61 t/ha, LSD (p=0.05): 0.12 t/ha) across wheat varieties. Although liming increased anthesis biomass by 9% this was not significant.
Dry biomass at maturity ranged from 3.17 to 5.24 t/ha and were not significantly different between varieties and liming but was significant for P application. Application of 30 P kg/ha increased the maturity biomass by 12% averaged across varieties and liming (data not shown).
|
Table 1 Plant establishment averaged across liming and P rate treatments (variety Lsd: 8 plants/ m2), the anthesis dry biomass (variety Lsd: 0.29 and Prate 0.12 t/ha) in 2013 at Merredin.
|
|
|
|
|
|
|
|
|
|
Westonia |
Wyalkatchem |
||||||||||||||||||||||||||||||||||||||||||||||||||||||||||||||||||||||||||||||||||||||||||||||||||||||||||||||||||||||||||||||||||||||||||||||||||||||||||||||||||||||||||||||
|
^Percentage anthesis biomass on the unlimed 0P soil relative to that on the 0P limed soil ^^ Percentage anthesis biomass on the unlimed 30 kg P soil relative to that on the 0P limed soil |
|
|
|
|
|
|
|
|
|
70 |
80 |
||||||||||||||||||||||||||||||||||||||||||||||||||||||||||||||||||||||||||||||||||||||||||||||||||||||||||||||||||||||||||||||||||||||||||||||||||||||||||||||||||||||||||||||
Grain Yield
Variety and Prate treatments as well as the interaction (lime x Prate) were significant (p=0.05). The main effect of P application significantly increased wheat grain yield (Table 2). The application of 30 kg P yielded 21% higher than nil P in the unlimed treatment, and 10% higher in the limed treatment (LSD (p=0.05): 0.0.32 t/ha).
Table 2 Grain yield (t/ha) of 12 wheat varieties grown on limed and unlimed strips with nil and 30 kg P fertiliser application in 2013 at Merredin.
|
Variety |
Unlimed 0P |
Limed 0P |
Unlimed 30P |
Limed 30P |
% Yield^ |
% Yield^^ |
|
Calingiri |
1.52 |
1.63 |
1.84 |
1.79 |
93 |
113 |
|
Cobra |
1.69 |
1.72 |
2.12 |
1.88 |
98 |
123 |
|
Corack |
1.71 |
1.64 |
1.98 |
1.82 |
104 |
121 |
|
Emu Rock |
1.65 |
1.61 |
2.06 |
1.99 |
102 |
128 |
|
Estoc |
1.71 |
1.68 |
2.18 |
1.89 |
102 |
130 |
|
Mace |
1.69 |
1.72 |
2 |
1.89 |
98 |
116 |
|
Magenta |
1.78 |
1.72 |
1.8 |
1.79 |
103 |
105 |
|
RAC1859 |
1.88 |
1.78 |
2.09 |
1.97 |
106 |
117 |
|
Scout |
1.54 |
1.71 |
2.04 |
1.77 |
90 |
119 |
|
WAGT328 |
1.89 |
1.71 |
2.07 |
1.98 |
111 |
121 |
|
Westonia |
1.62 |
1.76 |
2.23 |
1.82 |
92 |
127 |
|
Wyalkatchem |
1.74 |
1.74 |
2.16 |
1.92 |
100 |
124 |
|
Average within trts |
1.7 |
1.7 |
2.05 |
1.87 |
100 |
120 |
|
|
F pr. |
|
Lsd |
|
|
|
|
Variety |
<0.001 |
|
0.12 |
|
|
|
|
Lime |
0.281 |
|
n.s. |
|
|
|
|
Prate |
<0.001 |
|
0.05 |
|
|
|
|
Lime*P rate |
<0.001 |
|
0.29 |
|
|
|
|
Other interactions |
|
|
n.s. |
|
|
|
^Percentage grain yield on the unlimed 0P soil relative to that on the 0P limed soil
^^ Percentage grain yield on the unlimed 30 kg P soil relative to that on the 0P limed soil
Grain quality and harvest index
Small grain screening was generally high in 2013, ranged from 7 to 15 % (Table 3). The main effects of variety and liming and the interaction between them (Variety x liming) were significant both for screenings and harvest index (HI).
Table 3 Small grain screenings (%) and Harvest index (averaged across p application) of 12 wheat varieties grown on limed and unlimed strips in 2013 at Merredin.
|
|
Screenings (%) |
|
Harvest Index |
|
||
|
Variety |
Unlimed |
Limed |
Average |
Unlimed |
Limed |
Average |
|
Calingiri |
9.2 |
8.2 |
8.7 |
0.49 |
0.51 |
0.50 |
|
Cobra |
10.3 |
9.1 |
9.7 |
0.49 |
0.5 |
0.50 |
|
Corack |
10.7 |
7.8 |
9.3 |
0.46 |
0.5 |
0.48 |
|
Emu Rock |
12.6 |
11.3 |
12.0 |
0.47 |
0.49 |
0.48 |
|
Estoc |
10.7 |
12.6 |
11.7 |
0.52 |
0.54 |
0.53 |
|
Mace |
10.1 |
7.6 |
8.9 |
0.48 |
0.49 |
0.49 |
|
Magenta |
10.3 |
9 |
9.7 |
0.53 |
0.55 |
0.54 |
|
RAC1859 |
14.8 |
10.1 |
12.5 |
0.53 |
0.55 |
0.54 |
|
Scout |
15 |
10.5 |
12.8 |
0.49 |
0.54 |
0.52 |
|
WAGT328 |
9.3 |
10.2 |
9.8 |
0.47 |
0.49 |
0.48 |
|
Westonia |
10.3 |
10.2 |
10.3 |
0.5 |
0.52 |
0.51 |
|
Wyalkatchem |
7.6 |
7 |
7.3 |
0.48 |
0.51 |
0.50 |
|
|
|
|||||
|
Average within trt |
10.9 |
9.5 |
10.2 |
0.49 |
0.52 |
0.5 |
|
Lsd p=0.05 |
|
|
||||
|
Variety |
1.94 |
|
0.012 |
|
||
|
Liming |
3.64 |
|
0.008 |
|
||
|
P rate |
n.s. |
|
n.s. |
|
||
|
Lime.variety |
3.26 |
|
0.016 |
|
||
|
Other interactions |
n.s. |
|
n.s. |
|
||
P uptake data were not available at the time of writing.
Discussion
Wheat yield ranged from 1.5 t/ha to 1.9 t/ha without liming or added P depending on variety. Such a good yield on such a high Al soil is probably due to the 2013 season at Merredin, in particular the good spring rainfall (September-October 63 mm). Cultivars responded to P fertiliser (except Magenta) and were, on average, significantly more responsive on unlimed than limed soil might be due to immediate availability of P fertiliser to plants. Magenta had maintained the grain yield on the acidic soils and as such not responded to liming treatment and P applications.
Relative anthesis biomass on unlimed acid soils (as a percentage of the anthesis biomass on limed soil) ranged from 70% for Estoc and Westonia, 100% for Calingiri and Emu Rock to 108 % for Wyalkatchem (Table 1). By adding 30 kg P on acid soils, the relative anthesis biomass ranged 100% for Estoc to 130% for Calingiri, whereas all other tested varieties produced between 110% and 120%.
Similarly, the relative grain yield on unlimed acid soils (as as a percentage of the grain yield on limed soil) ranged from 90% for Calingiri, Estoc and Westonia to 100% for all other tested varieties (Table 2). By adding 30 kg P on acid soils, the relative yield ranged 110% for Calingiri to 130% for Estoc, Emu Rock and Westonia, whereas all other tested varieties yielded between 110% and 120%.
All varieties produced high screenings and the harvest index; however liming reduced screenings and increased the harvest index for most of the varieties. P uptake data is not yet available at reporting, therefore, economic implications are not presented.
During 2013, substantial varietal variation in response to soil acidity (low soil pHCa and high Al) liming and P fertiliser on acidic loamy sand soils was observed for anthesis biomass, grain yield and quality. All varieties yielded very well in acid soils at Merredin, Therefore, as such no current WA varieties exhibited poor tolerance to soil acidity and soil aluminium at Merredin. Therefore, growers can choose two or three current WA varieties of different traits to spread the production risks while adopting the strategy of applying lime for cropping acidic soils.
Key words
Soil pH, Al–tolerance, cultivars, wheat agronomy
References
Amjad M, 2013. Can we predict the best wheat varieties for low ph, high Aluminium soils in WA? Agribusiness Crop Updates, Perth.
Tang C, Nuruzzaman M, Rengel Z, 2003. Screening wheat genotypes for tolerance of soil acidity. Australian Journal of Agricultural Research, 54, 445-452.
Acknowledgments
This research is jointly funded by DAFWA and GRDC through “Wheat Agronomy-building system profitability in the Western Region”. Thanks to Bruce Haig and Matthew Harrod for trial management and technical support. Special thanks to Chengdao Li for setting up the site at Merredin Research Station and allowing us to conduct the wheat trial in 2013. Special thanks and acknowledgement to Greg Shea and Chris Gazey for their valuable advice on acidic soils and Mario D’ Antuono for spatial analyses of data.
GRDC Project No.: (DAW00218)
Paper reviewed by: Geoff Anderson, Doug Abrecht and David Bowran