Free living nematodes as indicators of biological soil health
Free living nematodes as indicators of biological soil health
Author: K. Linsell , G. Stirling, A. Stirling, D. Hartley, Herdina, A Cheshire, J. Nobbs, A. McKay, and K. Ophel Keller | Date: 23 Jul 2014
Take home messages
- Free living nematodes can act as indicators of soil health.
- Farming management practices impact free living nematode communities, especially nutrient inputs, soil moisture, organic matter additions and tillage.
- SARDI has developed free living nematode DNA tests that are sensitive, quick and robust tools for assessing nematode communities and thus provide a useful indication of a soil’s biological status.
- PreDicta B can detect and quantify pathogenic and beneficial soil organisms to give a more balanced measure of soil biological health.
Background
In order to know the status of the soil’s health we need to measure it. Nematodes can act as indicators of the status of the soil microbial community to give us a snapshot of the degree of the soil’s structure and enrichment.
Most growers know that nematodes are important pests of cereal crops, but are probably not aware that soils also contain non-parasitic nematodes. These nematodes, free-living nematodes, provide a wealth of information on a soil’s biological status and are therefore useful indicators of soil health.
Free living nematodes have several attributes that make them useful indicators in comparison to other soil microbes.
Nematodes are found in all soils in high numbers and with high diversity. Even in relatively poor soils, there will be up to a million individuals in every square metre. They are relatively easy to extract from soil and taxonomically identify based on their morphology (looking at their mouthparts determines what they eat). They represent four major groups; bacterial and fungal feeding, predatory and omnivores.
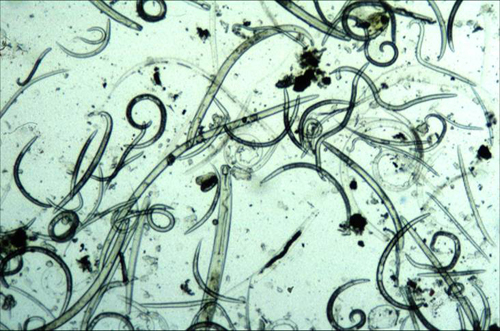
Figure 1. Free living nematode community extracted from soil viewed with light microscopy.
Free living nematodes have central positions at various levels in soil food webs. They are important in nutrient cycling within the soil as they feed on microbes releasing nitrogenous compounds which are then available to plants. However, most importantly they have well-defined responses to soil changes and disruptions. Their abundance reflects presence of their food sources (soil microbes) and since the availability of these food sources determines the number and types of nematodes in soil, analysis of the nematode community provides information on the status of the soil food web.
Some nematodes can survive harsh, disturbed environments better than others, and some have short life cycles and respond to environmental changes rapidly. Bacterial-feeding nematodes are relatively small, they complete their life cycles in only a few days and have high reproductive rates. They colonise habitats following disturbance or inputs of organic matter, multiply rapidly to high population densities and then decline when their food source is exhausted. Fungal feeding nematodes are also relatively small but have slightly longer life cycles. They live on the fungi associated with surface litter and decomposing organic matter, and also feed fungal plant pathogens. At the other end of the spectrum, the omnivores and predators are much larger nematodes, and they take one to several months to complete their life cycles. These nematodes help regulate nematode populations but are sensitive to disturbance. Once they are lost from the soil food web, it may take months or years for them to return.
All soils have a baseline level of bacterial and fungal feeding nematodes. If the soil becomes enriched (nutrients or a disturbance) then bacterial feeding nematodes increase rapidly. As the soil becomes better structured and more mature you begin to see higher trophic groups of bacterial and fungal nematodes but also the larger predatory and omnivorous nematodes (Figure 2).
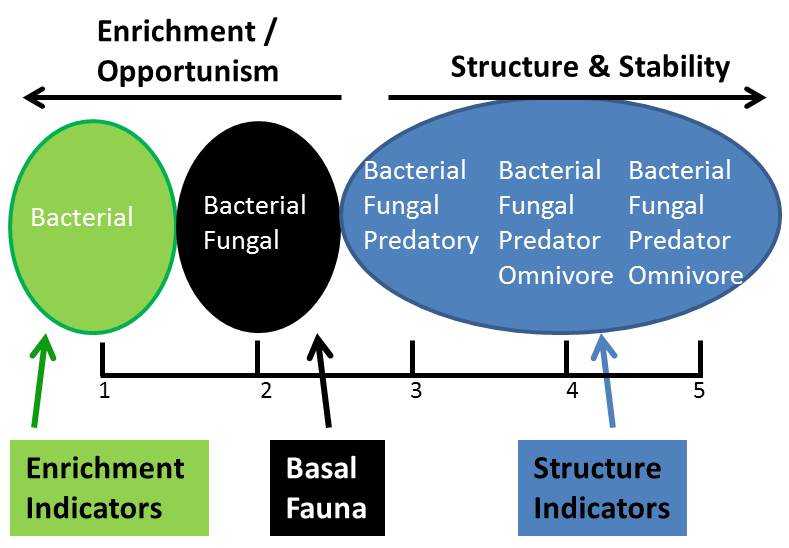
Figure 2. Qualitative conditions of soils and associated nematodes.
The composition of communities, so the presence/absence and quantity of certain nematodes, can provide information of the microbial status of the soil. A ‘healthy soil’ that is enriched and well-structured will have an abundant and diverse range of free living nematodes with a good balance between bacterial and fungal feeders and will also contain omnivorous and predatory nematodes.
The problem with using nematodes as soil health indicators is that the microscopic characterisation of free living nematodes is time consuming and requires specialised taxonomic expertise which only a handful of people have worldwide. Thus only small numbers of samples can be assessed. Therefore, in order to use free living nematodes as soil health indicators on a large scale and routinely we need to use technology that can detect and quantify free living nematodes quickly and robustly. One way to do that is through DNA assays.
In this GRDC funded project we have developed a suite of DNA tests that can detect and quantify the major free living nematode groups in Australian cereal soils. These DNA tests will be a part of SARDIs PreDicta B DNA based soil testing service for growers and agronomists. PreDicta B currently offers tests to identify soilborne pathogens, both fungal and nematode, which pose a significant risk to broadacre crops. We also have been developing DNA tests for beneficial organisms such as Mycorrhizal and Tricohderma fungi and the free living nematode tests, developed in this project, in order to monitor soil health so that growers can better plan and manage their cropping options. PreDicta B measures the pathogen level DNA and uses that along with the environmental data, farming management practices and the susceptibility of the crop, to predict disease. We want to do the same thing but measure free living nematode community DNA levels and along with the environment and farming management practices, measure and monitor soil health.
What we did?
In this project we looked at the status of the soil’s physical, chemical and biological factors in order to get an idea of soil health. We collected 450 soils from 22 sites across the Northern, Southern and Western cropping regions of Australia.
To investigate a range of physical variables, soils were collected from various soil types (Vertosol, Sodosol, Calcarosol, Tenosol, Ferrasol, Kandosol and Chromosol) and rainfall regions ranging from 200-700 mm per year. At many of these sites, soils were collected from multiple seasons and some for up to three years. We also sampled different tillage (conventional, reduced and no till) and stubble (burnt and retained) management practices. In terms of chemical variables we measured the nutrients applied as fertilisers and also the nutrient and pH levels in the soil (pH, electrical conductivity, organic carbon, nitrate & ammonium N, P, K and S). For biological variables we sampled from different cropping plant rotations and organic matter additions.
Soil samples were collected with a corer to a depth of 10 cm from each treatment in replicate. The soil was sub divided into a portion for microscopic taxonomic nematode analysis and DNA nematode analysis. For the microscopic analysis, nematodes were extracted from the soil and a sub sample of 100-150 randomly-selected individual nematodes were identified to 40 different groups at the family or genera level by using their morphological features (length, mouth, tail). They were then separated into groups based on their feeding habits. Several indices were also calculated to characterise nematode communities from a functional point of view.
The other soil subsample was dried and DNA was extracted by the SARDI diagnostic service and analysed using the developed free living nematode tests but also the PreDicta B disease tests for nematode and fungal pathogens.
From the nematodes that were extracted from the soil , individual nematodes were hand-picked into tubes and the DNA was extracted and sequenced to provide further confirmation of the ID but also to generate sequence information for the designing the DNA tests.
A multivariate approach was used to analyse this large and complex soil data set to determine:
1) Which free living nematode groups/taxa are good indicators of soil health?
2) How different management practices and environments effect free living nematode communities and thus soil health?
Results and discussion
Nematode indicators
A statistical test was used to identify the nematode taxa primarily providing the discrimination between two farming managements/environments. The analyses identified 22 out of the 40 free living nematode groups analysed by the microscopic analysis as key indicators. Using the DNA sequence information that we had generated, DNA tests were designed for 14 of the free living nematodes that were chosen as good indicators.
Nine DNA tests were developed to detect and quantify the 14 free living nematodes (Table 1). Some of the tests covered multiple nematode groups. The tests cover the four major feeding groups and we predict that they cover 80% of free living nematodes actually present in the soils analysed, thus they provide good coverage of the nematode community.
Table 1. Free living nematode DNA tests and the group of nematodes they detect.
|
Nematode DNA Test |
Feeding group |
|---|---|
|
Dorylaimida |
Omnivore |
|
Mononchida |
Predator |
|
Aphelenchidae |
Fungivore |
|
Aphelenchoididae |
Fungivore |
|
Cephalobidae |
Bacterivores |
|
Panagrolamidae |
Bacterivores |
|
Rhabditinae |
Bacterivores |
|
Mesorhabditinae |
Bacterivores |
|
Tylenchinae |
Root Hair Feeder/ Fungivore |
In order to show that are DNA tests were working we needed to validate them against the manual microscopic taxonomic analyses. We were able to do this as the DNA extraction and microscopic analyses were performed on the same soil.
A statistical test called a mantel test determined the probability of the two data sets (the microscopic and the DNA nematode community analyses) not being equal as P = 0.001. This showed that there is a very strong level of concordance between the microscopic counts and the DNA assays. What this says is that our nine DNA tests (14 free living nematodes) can differentiate between the different environments and farming managements and produce the same free living nematode community structure as the microscopic counts (40 free living nematodes). Therefore, our DNA tests are useful tools for monitoring nematode communities.
Management and environmental impacts on free living nematodes and soil health
Using our DNA tests we then identified the effects of the different management practices and environments on the free living nematode communities and thus soil health.
A statistical test was performed which selects environmental variables "best explaining" the free living nematode community pattern by ranking them in order (Table 2). So when the biological (free living nematode counts) and environmental datasets were compared 10 out of 10 times nutrient additions of N,P,K and S were key drivers in impacting free living nematodes, as well as recent and annual rainfall. In addition, nematode communities change within different soil types which are correlated to regions. The inclusion of fallows and pulses in to the cropping rotations impacts free living nematodes as well as the additions of organic matter and different tillage regimes.
Table 2. Farming managements and environments that impact free living nematode communities.
|
Rank |
Management/Environment |
|
Ranking solution |
|---|---|---|---|
|
1 |
Nitrogen |
Nutrients |
10 |
|
Potassium |
Nutrients |
10 |
|
|
Sulphur |
Nutrients |
10 |
|
|
Phosphorus |
Nutrients |
10 |
|
|
Rain 1 m pre sowing |
Rainfall/Moisture |
10 |
|
|
Rain 3 m pre sowing |
Rainfall/Moisture |
10 |
|
|
Rain 12 m pre sowing |
Rainfall/Moisture |
10 |
|
|
2 |
Region |
Region/Soil Type |
6 |
|
Soil type |
Region/Soil Type |
6 |
|
|
Pulse 2 yrs |
Cropping rotations |
6 |
|
|
Pulse 1 yr |
Cropping rotations |
6 |
|
|
Fallow 2 yrs |
Cropping rotations |
6 |
|
|
Fallow 1 yr |
Cropping rotations |
6 |
|
|
3 |
Organic Matter |
Organic Matter |
5 |
|
4 |
% Moisture at sampling |
Rainfall/Moisture |
4 |
|
5 |
Tillage |
Tillage |
3 |
In order to analyse how free living nematode communities are changed by these different managements and environments a statistical analyses called multi-dimensional scaling was performed. In the plots below, the closer together the points are, which represent soil samples, the more similar the samples are in terms of their free living nematode communities.
The analysis of nitrogen fertiliser addition found that there are three different free living nematode communities for the three different applied nitrogen rates (Figure 3). The highest rate at 60-90 kg/h had higher total free living nematodes but also bacterial and fungal feeding nematodes which you would expect in enriched soils. However, the 60-90 kg/h N soils had the lowest numbers of the larger omnivores suggesting some of these nematodes are sensitive to high nitrogen levels.
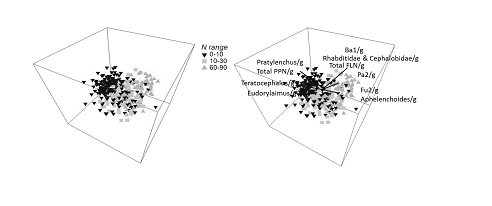
Figure 3. Multi dimensional scaling plot of free living nematode communities in soils with different applied nitrogen rates kg/h N.
The analysis of recent rainfall, three months prior to sowing, showed that the soils with the highest rainfalls of 300-400 mm, which also correlated to the soils with the highest clay contents, were the only soils to support the large predatory nematodes, Mononchidae.
It was found that organic matter additions also changed free living nematode communities. The organic matter soils had distinctly different communities to the no organic matter and rundown treatments (no organic matter added for two or more years) and also the burnt stubble. The organic matter amended soils had higher, P, K and C and thus these enriched soils were dominated by bacterial and fungal feeding nematodes, particularly Panagrolaimus and Aphelenchoides, which are opportunists taking advantage of the flux of bacteria and fungi associated with the litter decomposition.
The analysis of tillage at a Southern Australian site showed two distinct free living nematode communities (Figure 4). The conventionally tilled soils had higher plant parasitic nematode, Pratylenchus, and also bacterial feeding nematodes. The no till community were characterised by fungal feeding nematodes and the large omnivorous nematode, Eudorylaimus, indicating a more structured community which you would expect with less disturbance. The no till soils had higher organic C and generally higher yields which may explain the fungal dominance as there would be more organic matter retained on the surface than conventionally tilled soils, which would be largely decomposed by fungi.
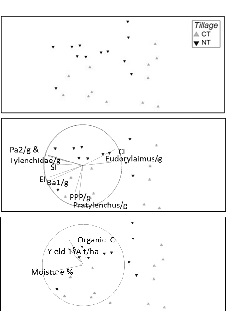
Figure 4. Multi dimensional scaling plot of free living nematode communities in soils with different tillage managements, conventional (CT) and no till (NT).
Conclusion
The free living nematode DNA tests are sensitive, quick and robust tools for assessing nematode communities and thus provide a useful indication of a soil’s biological status.
Farming management practices impact free living nematode communities especially nutrient inputs, soil moisture, organic matter additions and tillage.
Before implementing these DNA tests as part of SARDIs PreDicta B diagnostic service for monitoring soil health, further regional validation is required. In addition, we need to look at the impact of other farming management practices like compaction and herbicide/pesticide applications on nematode communities.
However, most importantly we need to work on information delivery to growers. We need to find the best way to communicate the complex results in a way that is simple but informative. We need to develop a soil health rating based on a traffic light or index system with associated recommendations for improving biological soil health.
Contact details
Katherine Linsell
SARDI, Plant & Soil Health
GPO Box 397, ADELAIDE , South Australia 5001
83039459, 0417889253
GRDC Project Code: DAS00111,