Stubble impact on fallow water efficiency in western zones 2014 and 2015
Stubble impact on fallow water efficiency in western zones 2014 and 2015
Author: Lawrie Price and Brendan Burton, Northern Grower Alliance | Date: 25 Feb 2016
Background
The western cropping areas of North West NSW (e.g. the Walgett region) have had a run of consecutive low or patchy rainfall years that have reinforced the critical importance of maximising fallow water accumulation and conservation. However, even under these patchy rainfall conditions soil moisture levels under header trash trails were frequently sufficient to at least establish, and perhaps grow, a crop.
In late 2013, the NGA Local Research Group at Walgett prioritised an issue to “help quantify what level of extra moisture could be accumulated under increased stubble loads”. The intention was - if the scale of the moisture difference was sufficient - to then evaluate approaches to manage stubble residue in field that may allow cropping of ‘zones’ in the paddock.
The concept is really an extension of skip row style production, where stubble load is concentrated in the zones where the next crop will be sown.
Method
Two small plot ‘proof of concept’ trials were established in Jan 2014, near Walgett and Bullarah. Both trials were established in paddocks that had already been fallowed from wheat in 2012 but with a dry profile. Soil cores were taken to 120cm and split into 5 depths for gravimetric analysis.
The majority of treatments were imposed by adding straw at rates from 5 to 40t/ha with the straw held down by wire. One other treatment had the existing stubble removed by hand.
Table 1. Treatment description
|
Treatment |
Groundcover (%) |
Thickness of ground cover (cm) |
|
Stubble removed |
5 |
0 |
|
Untreated (standing stubble, ~ 3t/ha) |
15 |
0 |
|
5 t/ha straw added |
75 |
1 |
|
10 t/ha straw added |
98 |
2 |
|
20 t/ha straw added |
100 |
5 |
|
40 t/ha straw added |
100 |
10 |
Bullarah: Photographs of key treatments (Soil type - grey vertosol)
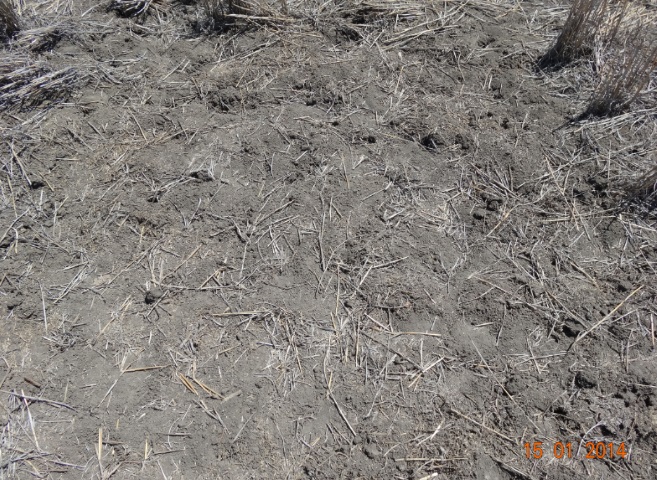
Figure 1. Stubble removed (Start of trial, Jan 2014)
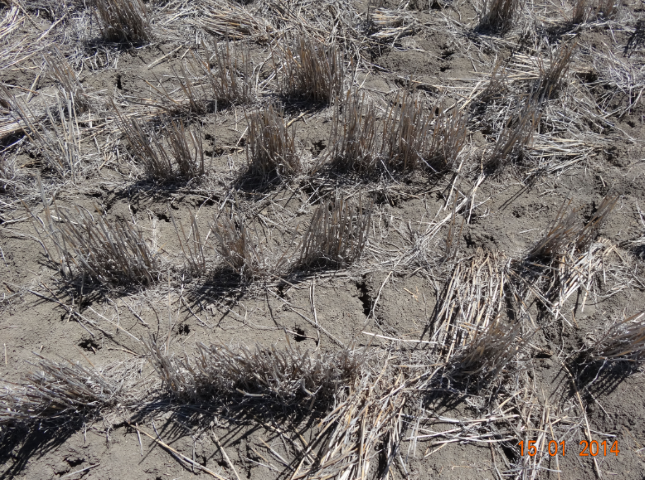
Figure 2. Standing stubble (Start of trial, Jan 2014)
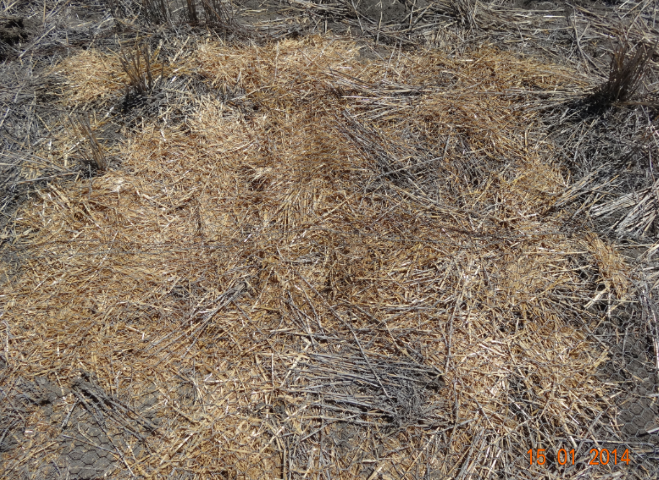
Figure 3. Straw added at 5t/ha (Start of trial, Jan 2014)
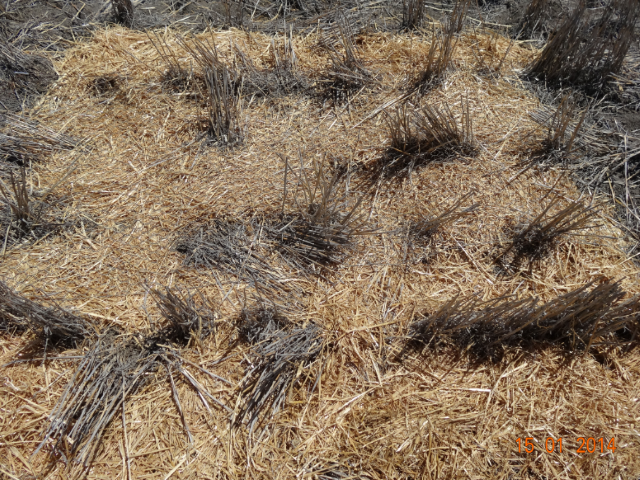
Figure 4. Straw added at 10t/ha (Start of trial, Jan 2014)
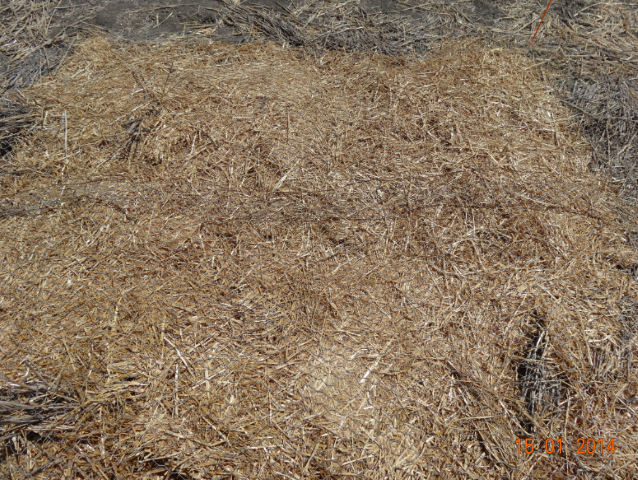
Figure 5. Straw added at 20t/ha (Start of trial, Jan 2014)
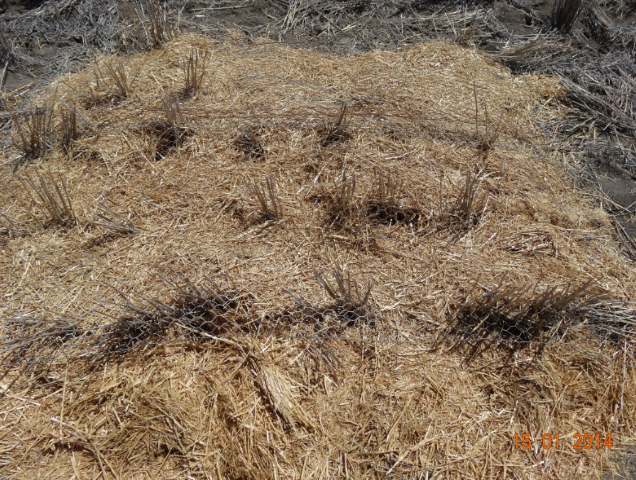
Figure 6. Straw added at 40t/ha (Start of trial, Jan 2014)
Bullarah soil moisture results
An interim measure of moisture was made in both April and November 2014 using a push probe. Each plot was probed five times (April) or seven times (November), with the depth of soil moisture measured.
The April sampling was shortly after ~184 mm in late March. Figure 1 shows the differences in depth of wet soil between treatments. It is likely that the increased depth of wet soil under the added straw treatments was due to improved infiltration caused by the ground cover. There was little improvement in infiltration once the ground cover exceeded 75% (straw added at 5t/ha).
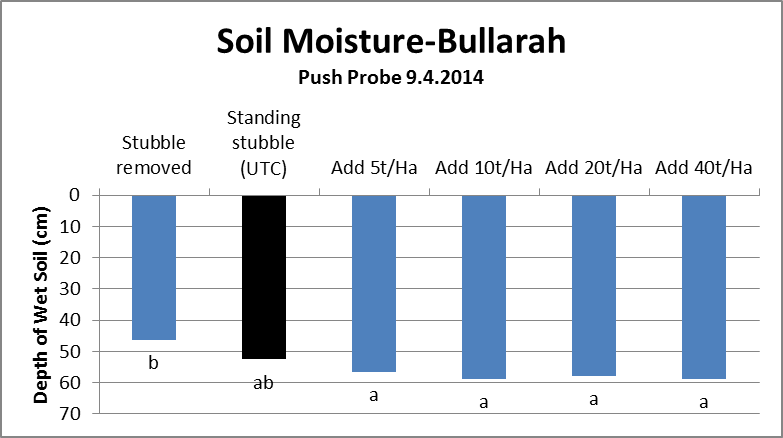
Figure 7. Depth of wet soil at Bullarah, April 2014
The second assessment in November 2014 was after a long dry spell (100mm in previous 7 months). The results indicated a reduction in depth of wet soil, presumably by evaporation, from the standing stubble or stubble removed treatments (see Figure 8). Where straw had been added, the depth of wet soil was similar to April 2014.
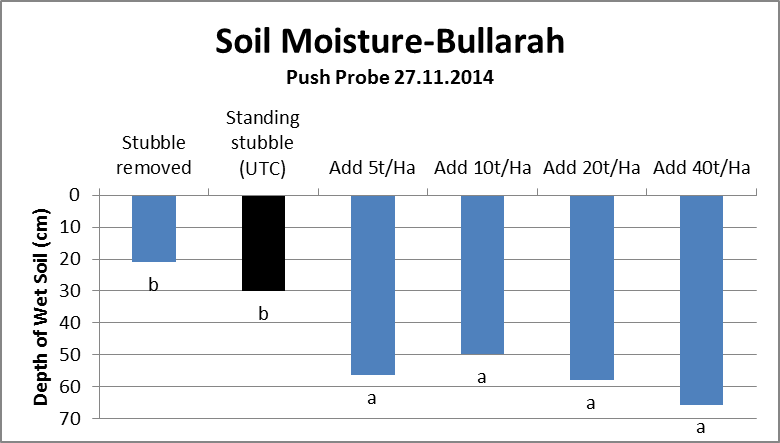
Figure 8. Depth of wet soil at Bullarah, November 2014
Final measurements of soil water were made in May 2015, this time measuring gravimetric water to 120cm to calculate both volumetric water and fallow efficiency. Figure 3 shows the volumetric results from deep coring and includes the starting moisture profile together with Drained Upper Limit (DUL) and the Wheat Lower Limit. Table 2 shows the fallow efficiency over the 16 months of the trial.
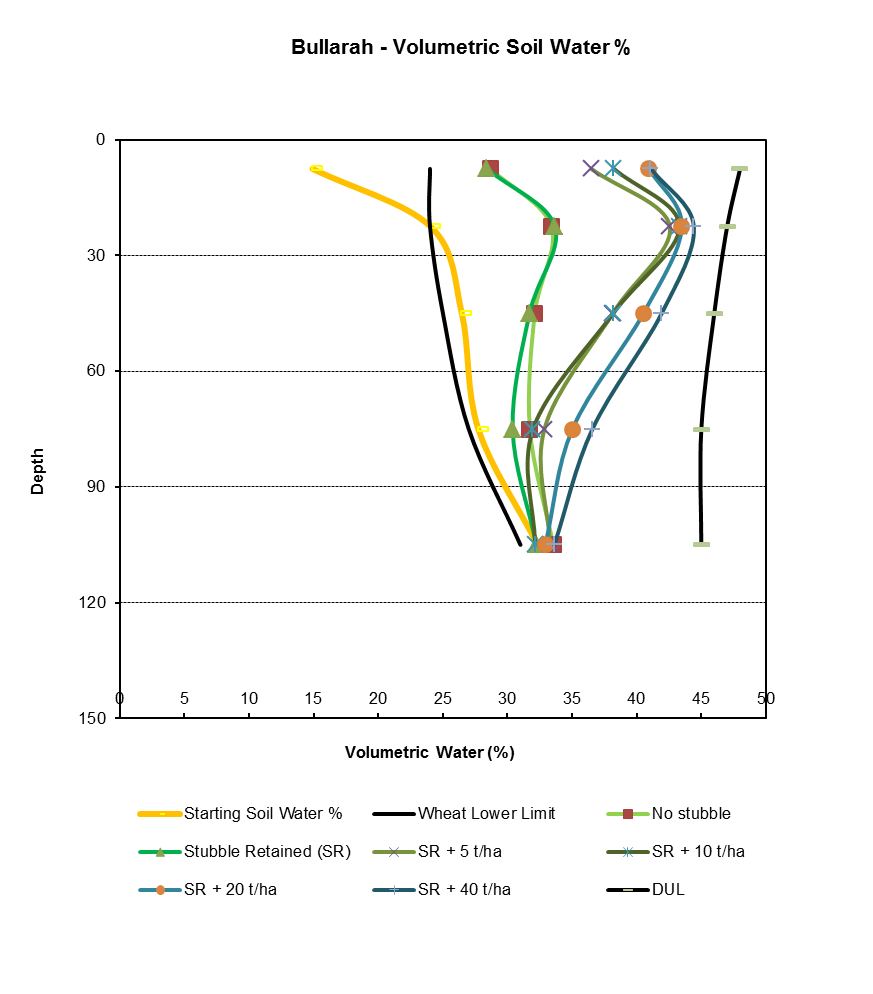
Figure 9. Volumetric soil water at Bullarah, May 2015
Table 2. Increase in available water and fallow efficiency over 16 month period
|
Treatment |
Available Soil Water (mm) |
Fallow efficiency (%) |
||||
|
13/5/2015 |
Water stored |
|||||
|
Stubble removed |
66 |
c |
55 |
10 |
||
|
Standing stubble |
57 |
c |
46 |
8 |
||
|
Additional 5t/ha straw |
110 |
b |
100 |
18 |
||
|
Additional 10t/ha straw |
109 |
b |
98 |
18 |
||
|
Additional 20t/ha straw |
131 |
ab |
120 |
22 |
||
|
Additional 40t/ha straw |
144 |
a |
133 |
24 |
||
|
P= |
0.00 |
|||||
|
LSD = |
29.5 |
|
||||
NB Starting soil water, Jan 2014 = 11mm, total rainfall during trial = 551mm
Key points
- At this site there was little difference in amount of water stored or fallow efficiency between the stubble removed and standing stubble treatments
- Significant increases in depth of wet soil and available soil water/fallow efficiency from all treatments with added straw
- Adding 5 or 10t/ha straw increased the available soil water by ~50mm and raised the fallow efficiency from ~9-18%
- Increasing the straw load from 5 or 10 to 40 t/ha significantly increased final available soil water, with the increase in water between 30-90cm soil depths, i.e. deep moisture
- Suspected that some of the improvement in fallow efficiency was due to reduced evaporation because of the thick mulch layer.
Measurements of soil nitrogen were taken in May 2015. Surprisingly there were no significant differences between the treatments in total N kg/ha to 120cm. However, between 0-15 and 15-30cm the stubble removed treatment recorded significantly higher nitrogen levels than all added straw treatments.
Soil samples were also analysed for Pratylenchus thornei from a subset of treatments. Mean numbers of Pt ranged from 6 to 10 Pt/g soil with no significant difference, although the lowest mean number was recorded under the 40t/ha added straw treatment.
Walgett results
The Walgett site has received less rainfall and the trial will continue. Push probing in April 2015 (15 months after the trial started) found 18cm of wet soil in the bare fallow and 39cm of wet soil in the 40 t/ha added straw treatment. The pattern was similar to the final available soil water at Bullarah, with a significant increase in depth of wet soil from all added straw treatments, but an additional increase from the 20 and 40t/ha rates.
Conclusions
Too early to make a call but an encouraging level of benefit at the Bullarah site. Even if repeated, the issue will still be, 'can we create and manipulate straw/stubble loads to enable zone farming?'.
Acknowledgements
The research undertaken as part of this project is made possible by the significant contributions of growers through both trial cooperation and the support of the GRDC, the author would like to thank them for their continued support.
Contact details
Lawrie PriceNorthern Grower Alliance
Level 1, 292 Ruthven Street
Toowoomba 4350
Ph: 07 4639 5344
Email: lawrie.price@nga.org.au
