Understanding and managing N loss pathways
Author: Mike Bell (QAAFI), Graeme Schwenke (NSW DPI) and David Lester (DAF Qld) | Date: 23 Feb 2016
Take home message
- Over the past 3 years, we have had 6 experiments with isotope-labelled (15N) urea fertiliser in northern NSW and a further 11 in southern Qld, all focussed on measuring the fate of applied N fertiliser in summer sorghum. Normal fertiliser contains 14N so the use of 15N allows us to trace the fate of urea-N applied to the soil from sowing through to harvest.
- Between 56 and 100% of the applied N was found in the soil and plant at harvest, with in-season rainfall (both timing and amount) and soil C and N status having a major impact on the seasonal loss potential.
- Avoiding unnecessarily high N rates, delaying or splitting N fertiliser so that peak N availability coincides with peak crop N demand and relying on residual N from legume rotations all significantly reduced gaseous N losses from dryland sorghum, although the effectiveness of any management strategy varied with seasonal conditions.
- Nitrification inhibitor-coated urea significantly reduced nitrous oxide emissions in all studies, but did not improve grain yields enough to justify the additional cost on an agronomic basis.
- Depending on the season, delaying/splitting N applications gave either no yield benefit (dry season) or a significantly greater yield (good in-crop rainfall). Much of the unused N after a dry season remained in the soil and, provided loss events were not experienced during the fallow, significantly benefited the following crop.
Why the focus on N losses?
Fertiliser is a major contributor to crop variable costs, particularly in the northern parts of the region where soil organic matter and associated mineralisable N reserves continue to decline. This will continue to be the case unless the legume frequency in crop rotations increases substantially compared to that typically used (i.e. typically 1 legume crop in every 4-6 crops grown – Edwards et al. 2012).
Given the substantial investment in N fertilisers, there needs to be considerable attention to factors that affect the efficiency of use of applied N (NUE), with indices such as crop recovery of applied N (kg fertiliser N accumulated in the crop or in the grain/kg N applied) and the agronomic efficiency of N use (kg additional grain produced/kg N applied) used to benchmark NUE. Any loss of applied N will affect NUE by reducing the pool of N that a crop can use to produce biomass and grain yield. Understanding the loss pathways and how they are influenced by seasonal conditions and management strategies are an important first step in optimising NUE for a given situation.
A recent survey of advisors throughout NSW and Qld (>150 advisors in total) showed the overwhelming majority recognized that N losses exist and can be significant, with a perception of increasing risks of losses in summer compared to winter cropping. There was also a perception of greater potential N losses (as much as 20-40% of applied N) in the northern part of the region, but given the unpredictability of environmental conditions that favour losses few advisors actually factor those losses into fertiliser recommendations. The results from our projects conducted in the recently completed NANORP initiative, funded by GRDC and the Department of Agriculture) provide some interesting insights into these losses in summer sorghum cropping.
Where do losses occur, how big are they & what are the drivers?
Essentially, nitrogen can be lost from cropping soils via downwards, sidewards or upwards movement. Downward movement of nitrate [NO3-] via leaching is a greater problem in lighter textured soils than in the medium–heavy clays dominating the northern grains zone, but previous research has demonstrated some N losses, albeit small on an annual scale, can occur via this pathway.
Sideways movement can occur rapidly through erosion of organic matter rich topsoil during intense rainfall events, or more slowly through lateral subsoil movement of nitrate-N in soil water. The main upwards N loss pathways consist of gaseous losses through either ammonia volatilisation or denitrification of nitrate.
Ammonia volatilisation losses can occur soon after fertiliser is applied to soil, primarily when that fertiliser is surface applied. In previous research on northern NSW clay soils, we found losses from broadcast urea averaged 11% (5–19%) when applied to the surface of fallow paddocks, 5% (3–8%) when applied in a wheat crop (mostly dry soils), and 27% when applied to pasture. Ammonia N loss from pastures was higher as there was little rain after spreading. Nitrogen losses from ammonium sulfate were less than half the losses from urea at 2 pasture sites and 5 out of 8 fallow paddocks on non-calcareous soils, but were higher than urea (19–34% N loss) from fallowed soils with more than 10% calcium carbonate (Schwenke 2014).
A range of factors influence the actual amount of N lost through ammonia volatilisation. Fillery and Khimashia (2015) recently published a simple model to predict ammonia volatilisation losses from fertiliser applied to moist soils. Their model starts with a maximum potential loss figure which is then discounted according to input factors including clay content, soil pH, fertiliser rate, rainfall in the week after application, presence of a crop canopy, and the placement of the fertiliser. Their model predicted the losses we measured in our fallow studies fairly accurately, but was not used on our studies in wheat paddocks where the potential for loss was deemed minimal due to the dry surface soil. In our field study we found that wind-speed after fertiliser application was also related to the amount of N lost over time.
Nitrate denitrification losses can be large, but require the simultaneous occurrence of low soil oxygen availability (an extreme examples is when soil is waterlogged for an extended period), high soil nitrate concentration (soon after soils have been fertilized) and readily available (labile) carbon to support an active microbial community. Clearly these set of circumstances do not coincide every year, but when they do, denitrification losses can be high, with rates of loss typically higher when soils are warmer in spring and summer rather than late autumn and winter. Interestingly, this is consistent with the survey information that the risk of N losses in the region was perceived to be greater in summer cropping and in the (warmer) northern cropping areas.
Unlike ammonia volatilisation, it is more difficult to quantify total N losses due to denitrification. This is because variable proportions of those losses can occur as N2 or as N2O, and direct measurement of denitrification losses in the field has so far only been able to quantify losses as N2O. There are reports in the literature of the ratio of losses as N2:N2O being anything from 1:1 to 70:1, depending on soil and environmental conditions. To put this uncertainty into perspective, this means the NANORP measurements of annual N2O losses at fertiliser N rates delivering maximum yield of 1-2 kg N2O-N/ha could be indicative of total denitrification losses ranging from negligible to >100 kg N/ha. The use of nitrogen fertilisers labelled with the 15N isotope allows the fate of applied N to be studied in greater detail, with the difference between fertiliser N applied and that recovered in the plant (tops and roots) or remaining in the soil after harvest representing fertiliser N lost to the environment. In soils where fertiliser N has been banded below the soil surface and leaching losses are minimal (such as in the alkaline Vertosols), most of the unaccounted-for fertiliser N is presumed to have been lost via denitrification. When cumulative N2O emissions data are available (such as in 12 of the 18 NANORP sites in Qld and NSW where 15N was used), the ratio of total N lost (from 15N results) to that lost as N2O can be used to estimate the ratio of N2 to N2O for these summer cropping systems.
The impact of N source on loss susceptibility
Nitrogen for crop production can come from (a) soil organic matter, (b) crop residues—especially legumes, (c) manures, and (d) fertiliser. To minimise N losses, managers need to match zones and times of N supply with N demand (from crop production). Ideally, the N would be produced or added as the crop needs it, but it must also be available where the plant roots can access it, i.e. in soil with available moisture for active roots.
Mineralisation of organic matter, residues and manures to plant available N forms requires moist soil and warm temperatures, so rates of N produced are greater during summer than winter. How much mineral N much is produced depends on the amount of organic matter in the soil, the amount of crop residues remaining and their N concentration, and the amount and type of manure applied, its N concentration and its method of application. In contrast, fertiliser N is either immediately available for plant use (in ammonium or nitrate forms) or soon available after conversion in soil (e.g. from urea to ammonium and nitrate).
Under non-waterlogging conditions nitrate [NO3-] is the N form that is produced in the soil regardless of the original source, and will accumulate over time if no significant N losses occur. So, the principal impact of N source is in the timing and rate of mineral N accumulation in the soil. If a loss event occurs while mineral N is still being produced, only that already present as nitrate will be subject to loss. If a loss event occurs after all mineralisation or urea conversion through to nitrate has taken place, then the original source will have little influence on how much is lost. An advantage of mineralisation-sourced N is that its slower-release may see it progressively distributed throughout the soil profile by fallow rainfall, rather than being present in a concentrated zone if applied all at once from fertiliser.
Managing N losses from any of these sources requires matching the times-of-year the N becomes available with potential for intense rainfall events and the time-of-year that the N will be required by the crop. Since applying N fertiliser at sowing creates a pool of nitrate N in the soil that is largely not accessed by the crop during the first 2 months post-sowing, this nitrate is at risk of denitrification losses. In splitting N application between sowing and booting, we have demonstrated reductions of 58–81% in N2O emitted (largely from denitrification), compared to urea all-at-sowing. In a dry growing season, the late-applied N may not have sufficient rainfall to enable its uptake for crop production, as we found in 2013-2014 sorghum season. However, in situations where there are no major loss events between one crop season and the next, this unused N may be available to the following crop in the rotation sequence. An example of this is discussed for unused fertiliser N from a split N application in NSW in 2013/14 season.
Use of urease & nitrification inhibitors to limit fertiliser N losses
Urease is a naturally occurring enzyme that increases the rate of conversion [hydrolysis] of urea [CO(NH2)2] to ammonium [NH4+]. Urease inhibitors are applied with urea to delay this conversion and keep the urea in the urea form. When hydrolysis occurs it creates a localised zone of highly alkaline pH which further converts some of the ammonium to the gaseous form ammonia [NH3], which can be lost from the soil surface by volatilisation. The greatest risk of volatilisation loss occurs when urea is broadcast onto a moist soil surface and is not incorporated into the soil via rainfall or soil covering. While there are many compounds that can inhibit the urease enzyme, the main one available for use in Australian agriculture is NBPT [N-(n-butyl) thiophosphoric triamide], although it is actually the breakdown product of NBPT that is the inhibitor. Urea coated with NBPT has been shown to reduce ammonia volatilisation loss in a range of crop and pasture situations.
Nitrification is the process of conversion of ammonium [NH4+] to nitrate [NO3-] in the soil, so the use of a nitrification inhibitor with an applied fertiliser aims to delay this process and keep more of the nitrogen in the ammonium form. The reason for applying this inhibitor is to prevent N loss via nitrate leaching or nitrate denitrification, which occurs in anaerobic soil conditions (e.g. waterlogging). Losses from denitrification in dryland cropping are sporadic, but can result in up to 50% of the applied fertiliser N being lost to the atmosphere, mainly as di-nitrogen gas [N2]. The greenhouse gas nitrous oxide [N2O] is also emitted from the soil during denitrification. Unlike ammonia volatilisation, which only occurs at the surface, denitrification occurs within the soil wherever nitrate and labile carbon (as an energy source for the microbes which drive this process) are present. Denitrification gases [N2, N2O] are not retained by soil adsorption, unlike ammonia [NH3] which is easily adsorbed by soil surfaces. Some of the chemicals that can be used for nitrification inhibition include 3,4-dimethylpyrazole phosphate (DMPP), dicyandiamide (DCD), and 2-chloro-6-(trichloromethyl) pyridine. Urea coated with DMPP (commercially available as Entec®) has been shown in 4 northern NSW and 4 Qld trials to reduce N2O emissions by an average of 85% (range: 65–97%) compared to uncoated urea. Despite the reductions in N2O loss, there have generally been marginal or no benefits to grain production or gross margins from using DMPP that justified its additional cost compared to untreated urea.
Measurement of fertiliser N losses with 15N-isotope-labelling experiments (2012-2015)
During the past 3 years we have used isotope-labelled (15N) urea fertiliser to trace the fate of applied N in 6 season-long mini-plot field experiments with sorghum near Tamworth and Quirindi/Breeza in NSW, and in 11 experiments on the Darling Downs and Inland Burnett regions in Qld (Kingsthorpe, Kingaroy, Kupunn, Bongeen and Irongate). Normal fertiliser contains 14N so the use of 15N allows us to trace the urea-N applied into the harvested grain, the plant residues, large roots, and the soil profile after harvest. The difference between what we applied and the total of what was found after harvest was assumed to be the N lost by denitrification, as the urea was mixed/banded into the soil to minimise ammonia volatilisation, adjacent crop rows and soil were sampled to quantify any lateral movement and/or the mini-plots had raised steel borders to minimise surface runoff. Possible leaching of applied N was accounted for by deep coring of the mini-plots and measurement of mineral N to 150 cm depth.
Trial results
NSW sites (see Figure 1)
In 2012-13 experiments, total gaseous loss (N2 + N2O) ranged from 28–45% of applied N. At the Tamworth (drier) site, there was no effect of N fertiliser rate on the proportion lost (21%), while at the Quirindi (wetter) site, N losses were 43%, 44% and 27% from the 40, 120 and 200 kg N/ha treatments, respectively. It is likely that the proportion lost from the 200 N rate was lower because some of the excess nitrate N moved lower in the soil during the heavy rainfall period rather than being denitrified. Evidence for this was seen in the greater uptake of applied N into the grain protein in this treatment.
In 2013-14, a much drier sorghum-growing season, we used 15N either as (a) urea at sowing, (b) as urea applied at 7-leaf stage, or (c) as urea applied at sowing with a nitrification inhibitor. At the Tamworth site, there was no difference in total N lost between treatments (26%), but of the N applied only 10% was found in plant tissue at harvest when applied at the 7-leaf stage, compared to an average of 36% in the plant when N was applied at sowing. This is because there was only one rainfall event after the late-applied N fertiliser, so limited opportunity for plant N uptake after the topdressing. At the Quirindi site, there was only 4% total N loss from the inhibitor treatment, compared to an average N loss of 20% from urea either applied at sowing or at 7-leaf stage. The main difference between the urea and the inhibitor treatment was in the extra 15% of applied N found in the soil at harvest in the treatment where the inhibitor had been used, compared to ordinary urea. Only 13% of the late-applied N was found in the plant tissue (including grain) at harvest, compared to an average of 28% in the other treatments applied at sowing.
In 2014-15, an ideal summer for sorghum growing (after a dry start), our treatments compared (a) urea added at sowing, and (b) urea split between sowing (33%) and 7-leaf stage topdressing (67%). At the Tamworth site, there were also two different N rates applied, depending on whether the previous crop was sorghum (120 kg N/ha) or soybean (40 kg N/ha).
Overall N losses averaged 29%, and were not affected by the previous crop, but were 4% greater when the N was applied all-at-sowing. The difference in N loss was an extra 4% found in the top 0-10 cm of the soil of the split N treatments; there was no difference in N recovery in the crop.
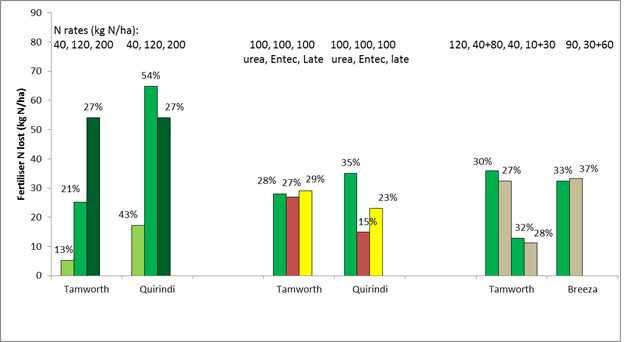
Figure 1. Losses of applied urea-N in field trials on Vertosol soils in northern NSW during the NANORP project. Losses were calculated from recoveries of 15N labelled urea in soil and plant material.
Qld sites (see Figure 2)
In a very wet 2012-13 season, total gaseous loss (N2 + N2O) ranged from 23–48% of N applied prior to or at sowing on black and grey Vertosols but was minimal with split applications on a brown Ferrosol near Kingaroy with very low soil N reserves. On the Vertosol sites at Kupunn (sown early October) and Kingsthorpe (sown late November) losses tended to increase with fertiliser N rate, representing 23%, 40% and 47% at Kupunn and 34%, 46% and 48% at Kingsthorpe for the 40, 80 and 120 kg N/ha rates, respectively. The high losses in the 80 and 160 kg N/ha rates at Kupunn emphasised the vulnerability of any excess fertiliser N supply (optimum N rate was 80N at that site) remaining in the soil during a late season wet event (block received 100mm and was flooded near physiological maturity). Conversely, the N2O-N emissions monitored at Kingsthorpe suggested most losses occurred in response to prolonged wet (not waterlogged) soil in the 6-8 week period following sowing and fertiliser application (i.e. before most crop N uptake occurred). For this site-season combination the optimum N rate was ~170 kg N/ha.
At the Kingaroy site the interaction between rotation history (grass or legume ley pastures) and N rate was explored, with the higher fertiliser N requirement after the grass ley (100 kg N/ha versus 70 kg N/ha after the legume ley) resulting in similar crop yields but emissions intensities (kg N2O-N/t grain yield) twice as high as in the legume history.
The 2013-14 season was much drier, as in NSW. Experiments again looked at losses in response to urea-N rate (Bongeen), while also comparing responses to urea to those from urea with a nitrification inhibitor (Kingaroy and Kingsthorpe). The impact of the inhibitor was assessed in terms of crop performance (growth, yield and N uptake), but total gaseous N losses determined using 15N were only assessed for the urea treatments. Losses were lower at all the Vertosol sites (13-30% of applied urea-N), but slightly higher in the Kingaroy site (15-25% of applied N), with the latter requiring frequent sprinkler irrigations (totalling 160mm) to provide enough water to grow the crop. The relationship between losses and N rate evident in 2012/13 was not as consistent in 2013/14, and was perhaps most evident at the irrigated Kingaroy site, where 14%, 18% and 28% of applied N was lost in the 40, 80 and 120N rates, respectively (optimum N rate at this site was ~120 kg N/ha). In the Vertosol sites the lower yields and crop demands (and hence lower optimum N rates) did not lead to large N losses during the growing season as there were few (2 at Kingsthorpe and only one, near physiological maturity, at Bongeen) significant rainfall events and most ‘surplus’ fertiliser N could be found as NO3-N in the soil profile after crop harvest.
Despite 65-70% reduction in annual N2O emissions in the treatments with the nitrification inhibitor at both sites, there was little agronomic benefit other than a slight (10-15 kg N/ha) reduction in the optimum N rate and a slight increase in yield (the latter at Kingaroy only) with the inhibitor. These responses were not sufficient to cover the price premium charged for the commercial nitrification inhibitor product (i.e. ~20% more/kg N applied).
2014-15 turned out to be a great sorghum growing season after a dry start that caused poor crop establishment and a replant at one early-sown trial site. We ran 5 experiments, with 3 again comparing rates of urea with urea and a nitrification inhibitor. The other sites either simply looked at urea N rate (Irongate early sown) or the interaction between N rates and crop rotation history (Kingaroy). In the later sown Vertosol sites that experienced wet conditions during early growth (Irongate late and Kingsthorpe) losses again increased with N rate, although not always as a proportion of N applied. Losses ranged from 15-45% of applied N, depending on site, with the contrast between the early and late sown Irongate sites particularly interesting. Fertiliser N was applied at the same time at both sites (planting of the successful early sown block), but there was no effective rainfall after that until flowering in the early block (and re-sowing of the late block). The lower losses of fertiliser N in the early sown block were related to the strong sink present (a well grown sorghum crop near flowering) when the fertiliser N was converted to nitrate-N by in-season rainfall, compared to the late sown block where nitrate rapidly became available but there was effectively no crop uptake for a period of 4-6 weeks, during which soils remained wet.
Once again, the reduction in N2O emissions from use of the nitrification inhibitor was much greater than any effect on crop growth or fertiliser N requirement. The effect of grain legumes in the crop rotation on fertiliser N requirement, N2O emissions and N losses was also consistent with the ley pasture trial in 2012/13 – fertiliser N requirements were less and N2O emissions intensity was lower (by 25%) in the legume systems compared to back to back sorghum.
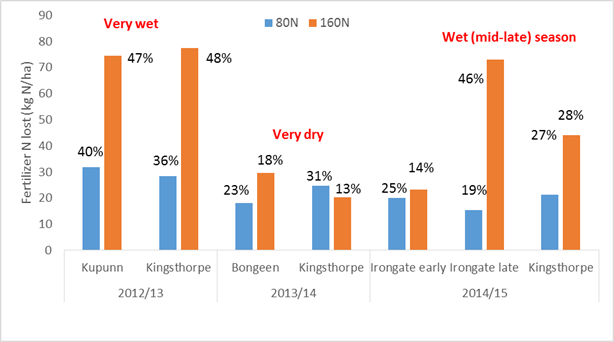
Figure 2. Losses of applied urea-N in field trials on Vertosol soils in Queensland during the NANORP project. Losses were calculated from recoveries of 15N labelled urea in either soil or plant material.
Local case studies illustrating management strategies to reduce N losses
NSW – Impact of timing of N application (Courtesy of Maurie Street and Ben O’Brien, GOA)
In 2015, two central-west wheat trials on nitrogen rate and timing of application showed poor crop N uptake by wheat when urea was pre-applied in late December 2014. At both sites (Narromine, Nyngan), the urea was drilled into sandy clay loam topsoils. The sites had already had 40-50 mm during December and another 30-40 mm followed in the week after N was applied. Another 140-180 mm of rain fell from January until sowing in early May 2015. The aim of these trials was to compare pre-applied N, at-sowing N and in-crop N applications on wheat production and grain protein. While the crop data is not yet available, in-crop sensing results (NDVI) indicated that the pre-applied N treatments were not showing the N-rate responses seen in the at-sowing N treatments.
Pre-sowing soil testing conducted in the pre-applied N plots was unable to account for 2–91% of the N applied in December, with greatest apparent losses in the 200 kg N/ha treatments at both sites. Profile results indicated little or no downward movement of mineral N below 30 cm depth in the soil. Nitrate denitrification was presumed to have caused much of these losses since the urea was incorporated into the soil. However, some ammonia may have volatilised from the soil surface of these light-textured soils. Weed N uptake and N immobilised by microbial breakdown of crop residues may also have accounted for some of the applied N.
Qld – Impact of legume N on fertiliser requirement and N2O emissions
An experiment was established at Kingaroy to explore the impact of crop rotation (grain or grain legume pre-histories) on fertiliser N requirement and NUE during a subsequent sorghum crop in 2014/15. The pre-histories were sorghum, as well as peanut or soybean in the 2013/14 summer, and all were harvested for grain. In the second summer crop year (sorghum), the fertiliser N rate required to achieve maximum sorghum grain yield (6.3 t/ha) was reduced by at least 50% after a peanut rotation (i.e. 60 kg N/ha compared to 120 kg N/ha) or eliminated totally after a soybean crop (i.e. no fertiliser N response). Fertiliser N losses determined using 15N recovery were negligible at the optimum N rate in each history (<5 kg N/ha), with 65-70% of the applied N accumulated in crop biomass at this high yielding site. Regardless, cumulative N2O emissions during the growing season and the emissions intensity (kg N2O N/t grain produced) were 35% higher in the sorghum history with 120 kg N fertiliser/ha than in legume histories with 60 kg N fertiliser/ha.
Acknowledgements
This research was funded by the Australian Government Department of Agriculture, as part of the National Agricultural Nitrous Oxide Research Program (NANORP). However it was made possible by the significant contributions of growers through both trial cooperation and the support of the GRDC, and the authors would like to thank them for their continued support. In NSW, we gratefully thank Ian Carter for the use of “Connemara” and “Romney Vale” on the Liverpool Plains. Other trials were located on NSW DPI Research Stations near Tamworth and Breeza. In Qld we would like to thank Warakiri Ag Trust Manager Scott Reichelt, Andrew Ruhl and Peter Bach for the use of ‘Myola’, ‘Seacres’ and ‘Craigielee’, with other trials located on the DAF Research Stations at Kingsthorpe and Kingaroy.
Many people assisted with various aspects of field operations, sample processing and sample analyses. In NSW this included Matthew Gardner, Rick Graham, Peter Formann, Mustafa Kamal Hossain, William Keene, Kelly Leedham, Annabelle McPherson, Adam Perfrement, Peter Sanson, Zara Temple-Smith, Wayne McPherson, Guy McMullen, and Loretta Serafin (NSW DPI, Tamworth), while Leanne Lisle (UNE), Brad Keen, Stephen Kimber and co-workers (NSW DPI, Wollongbar) conducted various analyses.
In Qld the project team also included Prof Peter Grace, Dr Clemens Scheer, Dr David Rowlings and Dr Max de Antoni Migliorati (QUT), while the field program was managed by Gary Harch, Peter Want, Lawrie Smith, Peter Aegis, Rod Obel and Trish Balzer. Julie Renwick, Alice Strazzabosco, Rachael Nicholls and John Taylor (QUT) are recognized for their analytical work.
References
Fillery IRP, Khimashia N (2015) Procedure to estimate ammonia loss after N fertiliser application to moist soil. Soil Research (online early) http://dx.doi.org/10.1071/SR14073
Schwenke G (2014) Nitrogen volatilisation: Factors affecting how much is lost and how much is left over time. http://grdc.com.au/Research-and-Development/GRDC-Update-Papers/2014/07/Factors-affecting-how-much-N-is-lost-and-how-much-is-left-over-time
Contact details
Mike Bell
University of Queensland
Gatton Campus, Gatton 4343
Ph: 07 5460 1140
Email: m.bell4@uq.edu.au
Graeme Schwenke
NSW DPI
4 Marsden Park Road, Tamworth
Ph: 02 6763 1137
Fx: 02 6763 1222
Email: graeme.schwenke@dpi.nsw.gov.au
DAF Qld
Leslie Research Centre, Toowoomba 4350
Ph: 07 4639 8886
Email: david.lester@daf.qld.gov.au
GRDC Project Code: NANORP codes: 01202.027, 0102.004,
Was this page helpful?
YOUR FEEDBACK