How can we ameliorate water repellent soils cost-effectively? Indications from three trials in WA
How can we ameliorate water repellent soils cost-effectively? Indications from three trials in WA
Author: Giacomo Betti, Stephen Davies and Chad Reynolds Department of Primary Industries and Regional Development (DPIRD), Geraldton (WA) | Date: 26 Feb 2018
Key messages
- Results from two seasons showed that spading and one-way ploughing are the most cost-effective treatments for amelioration of water repellent deep sands in the West Midlands region of the WA Wheatbelt, thanks to their significant impact on yields and their medium-low cost.
- On water repellent sandy gravel, deep tillage using one-way plough was a more cost-effective treatment than shallower tillage using off-set discs, particularly when combined with clay spreading at low rates (50 t/ha).
- Clay spreading improved crop establishment and yields and can be a very cost-effective treatment when combined with spading or one-way plough at low rates (50 t/ha in sandy gravel and 100 t/ha in deep sand).
Aims
To determine the most cost-effective soil modification options for the improvement of various water repellent soil types.
Method
Trials description and sampling
In 2016 we established three trials on different water repellent soil types in the West Midlands region of the WA Wheatbelt: 1) a deep pale sand near Badgingarra , 2) a sandy gravel near Moora (named Moora-1) and 3) a deep pale sand near Moora (named Moora-2). At all sites, the treatments were a combination of four clay rates with two or more incorporation (tillage) methods, as summarised in Table 1. A more detailed description of establishment of the trials is available in Betti and Davies (2017).
The trials were intentionally designed with similar layouts in order to enable the comparison of their results and to better understand the treatment response on various soil types over multiple seasons.
The average clay content of the subsoils used for clay spreading was above 30% (Table 1), considered the minimum clay content for effective treatment. The soil chemical analysis showed that all the subsoils used had very low cation exchange capacity (CEC<10meq/100g). This was not completely unexpected, as the dominant clay minerals in the region are usually Kaolinite and Illite (Viscarra Rossel 2011), both known for their low CEC. Moreover, Colwell K was found to be very low in the subsoils used at both Moora-1 and Moora-2 (61 and 36 mg/kg respectively), while the Badgingarra clay had more adequate values (160 mg/kg). Nevertheless, because of the subsoil chemical characteristics, claying was not expected to have a large effect in increasing the nutrient holding capacity of the topsoils.
In 2016, Badgingarra, Moora-1 and Moora-2 were sown to Barlock lupin, Hydra wheat and La Trobe barley, respectively, and in 2017 to Mace wheat, Hyola 559TT canola and Barlock Lupin.
The 2016 and 2017 growing seasons had contrasting seasonal conditions. The first year was characterised by above-average cumulative rainfall during the growing season, while 2017 experienced below-average rainfall and was particularly dry during seeding and crop emergence (March-June). Because of this, expression of soil water repellence at the trial sites was reduced in the wet 2016 season, in contrast to the dry start in 2017 that increased expression of soil water repellency and the typical issues associated with it. These contrasting seasons were nevertheless ideal for the experiments as they allowed for a better comprehension of treatment effects (particularly clay spreading) on crop growth.
The performance of the treatments were monitored using several sampling methods including: severity of water repellence using the Molarity of Ethanol Droplet (MED) method, plant counts, head counts, soil and tissue tests, NDVI, ground cover, soil moisture, canopy air temperature, grain yield and grain quality.
However, due to limited space this paper mainly discusses the cost-effectiveness of the treatments and their effects on soil water repellence, early plant establishment (plants/m) and grain yields.
Trial name: Badgingarra Location: Badgingarra, WA Soil type: repellent deep pale sand Subsoil spread mean clay content: 49.7 % | Trial name: Moora-1 Location: Moora, WA Soil type: repellent sandy gravel Subsoil spread mean clay content: 31.2% | Trial name: Moora-2 Location: Moora, WA Soil type: repellent deep yellow sand Subsoil spread mean clay content: 31.0% | ||||||
|---|---|---|---|---|---|---|---|---|
Subsoil clay (t/ha)* | Combined with→ | Incorporation method (tillage) | Subsoil clay (t/ha)* | Combined with→ | Incorporation method (tillage) | Subsoil clay (t/ha)* | Combined with→ | Incorporation method (tillage) |
0 | → | 1. No incorporation 2. Spader 3. Spader (2 passes) 4. Off set disc 5. One-way plough | 0 | → | 1.Offset disc 2. One-way plough | 0 | → | 1. No incorporation 2. Spader 3. Spader (½ speed) 4. Off set disc |
100 (50) | → | 1. No incorporation 2. Spader 3. Spader (2 passes) 4. Off set disc 5. One-way plough | 50 (16) | → | 1.Offset disc 2. One-way plough | 100 (31) | → | 1. No incorporation 2. Spader 3. Spader (½ speed) 4. Off set disc |
150 (74) | → | 1. No incorporation 2. Spader 3. Spader (2 passes) 4. Off set disc 5. One-way plough | 100 (31) | → | 1.Offset disc 2. One-way plough | 150 (47) | → | 1. No incorporation 2. Spader 3. Spader (½ speed) 4. Off set disc |
250 (123) | → | 1. No incorporation 2. Spader 3. Spader (2 passes) 4. Off set disc 5. One-way plough | 150 (47) | → | 1.Offset disc 2. One-way plough | 250 (78) | → | 1. No incorporation 2. Spader 3. Spader (½ speed) 4. Off set disc |
Total of 20 treatments (10mx18.8m each), replicated in 3 randomised blocks (each block with 8 extra control plots) | Total of 8 treatments (17mx18.8m each), replicated in 3 randomised blocks | Total of 16 treatments (17mx18m each), replicated in 3 randomised blocks (each block with 8 extra control plots) | ||||||
* Values in brackets after the rates of subsoil clay represent the mean quantity of actual clay (t/ha) incorporated in the soil, based on the mean clay content of the subsoil
Cost analysis
For the cost analysis, the approximate tillage and the clay spreading costs were firstly estimated using local information (Table 2).The cost-effectiveness of the treatments was then assessed by estimating the percentage return on investments (ROI), using as the initial investment the whole running costs for growing the crop (direct costs and soil amelioration costs) according to the following formula:
Crop market price is the best available market price (excluding transport, $/t) for each crop in the December 2016 and January 2018. Farm costs ($/ha) includes all annual direct production costs associated with growing each specific crop, such as seeding, chemical treatments, fertilisers and harvest. Farm costs were estimated from personal communication with collaborating growers for each season and location. Annual treatment cost (tillage ± clay spreading, $/ha) was calculated as a 10 years amortisation of the mean total cost of the treatment applying an interest rate of 6% per annum. The 2016 and 2017 ROIs were averaged to calculate the short term ROIs of each treatment based on 2 years results.
Cost of treatments | |||
|---|---|---|---|
Clay spreading | Incorporation | ||
Rate of subsoil clay (t/ha) | Est. cost ($/ha)* | Tillage | Est. cost ($/ha) |
50 | 120 (106-135) | Off-set disc | 20-25 |
100 | 241 (212-270) | One-way plough | 25 |
150 | 364 (320-408) | Spading | 110 |
250 | 643 (566-721) | Spading x 2 runs or at ½ speed | 200 |
Grains market prices ($/t) | |||
Lupin 2016 | 275 | Wheat 2017 | 271 |
Wheat 2016 | 250 | Canola 2017 | 520 |
Barley 2016 | 230 | Lupin 2017 | 290 |
*Values in brackets represent the range (minimum and maximum) of the estimated mean costs based on local information.
Results
Effect of the treatments on the severity of water repellence
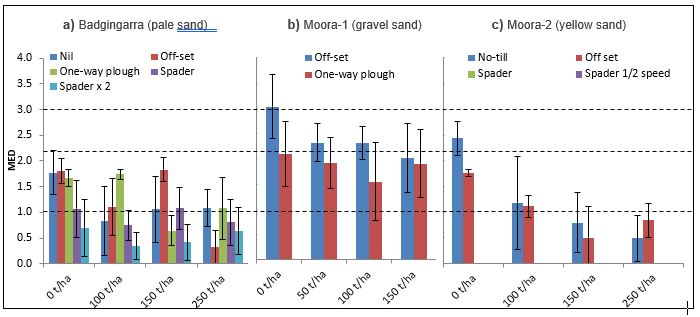
The initial severity of soil water repellence (SWR) at all sites was very variable (Fig 1). The average MED values for the control soil at the Badgingarra site were within “moderate” repellence (King 1981), although there was great variability with values ranging from “low” repellence to “severe” repellence. The gravel soil at Moora-1 was classified as “severe” to “very severe” water repellence and the sand at the Moora-2 site as “moderate” to “severe”.
At all sites, the effects of tillage, clay spreading and their combination on reducing SWR were all statistically significant (p<0.05). At the Badgingarra site, the high variability of SWR was probably affected by soil sampling and may explain the unexpectedly poor results from the treatments with one-way plough at 100 t/ha clay and the off-set at 150 t/ha of clay (Fig 1a). Nevertheless, both claying and tillage reduced significantly SWR.
The effects of the treatments on reducing SWR were particularly clear at the Moora sites (Fig 1 b and c). As expected, at both sites the more intensive tillage methods (one-way plough and spader) were more effective in reducing SWR. This was particularly evident at the Moora-2 site were all the spading treatments, regardless the combination with subsoil clay, completely removed water repellence (MED=0, bars not visible in Fig 1c).
a) Badgingarra (pale sand) b) Moora-1 (gravel sand) c) Moora-2 (yellow sand)
Figure 1. Effect of the treatments on the severity of water repellence assessed by the molarity of ethanol droplet test (MED). Dashed line indicate the MED thresholds for the rating of water repellence (King 1981) : i) Moderate (>1). ii) Severe (>2.2). iii) Very severe (>3).
2016 season
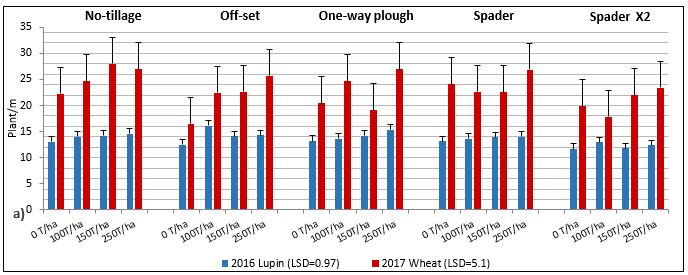
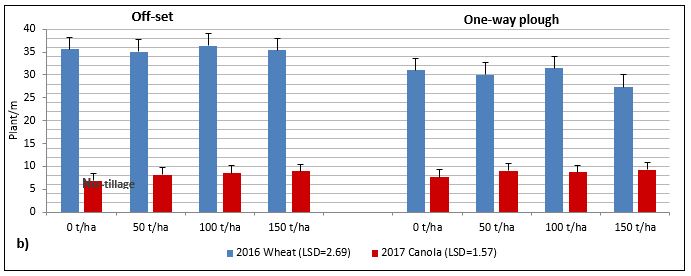
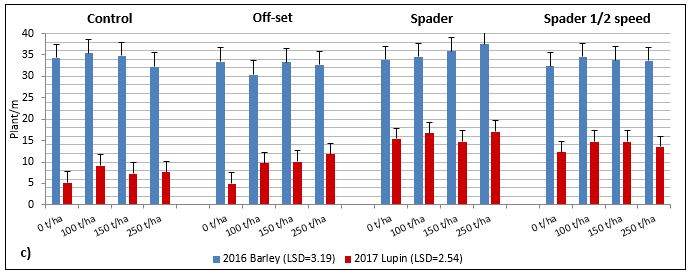
Early crop establishment in the first year of the trials was variable from site to site (Fig 2 a, b and c). A wet start to the season reduced soil water repellence and so impact of treatments on improving plant establishment was less evident. On the other hand, seeding depth negatively impacted crop establishment in the treatments with greater soil disturbance, such as spading at the Badgingarra site (Fig 2a) and one-way ploughing at the Moora-1 site (Fig 2b). As a result, in most cases there was no significant difference in plant numbers between the soil modification treatments and the control.
Nevertheless, at all sites crops recovered from slow early establishment and in 2016 all the soil modifications produced similar or higher yields compared to the control treatments (Table 3).
At Badgingarra, one-way ploughing and 100 t/ha of subsoil clay significantly (at p=0.05) yielded more than 0.5 t/ha of lupin compared to the control treatments. This was followed by the other one-way plough treatments combined with 150 and 250 t/ha of clay. Thanks to the significant yield increase and low annual cost, in 2016 the one-way plough treatments with 100 and 0 t/ha of clay had respective ROIs 20% and 16% higher than the control, followed by the off-set disc treatment (+10%). In contrast, all spading treatments resulted in lower ROIs than the control due to the lower yields and the high initial investment.
At Moora-1 site, all the treatments with one-way plough produced higher yields than those with off-set disc, particularly when combined with the lower rate of subsoil clay (50 t/ha). This latter treatment however produced the second highest ROI, closely behind the cheaper one-way plough treatment without clay spreading (Table 3).
The Moora-2 site recorded the most substantial increase in yields, with the spading treatments (with or without clay spreading) significantly increasing the yield of barley by more than 1 t/ha (Table 3). At this site, it was also observed that at least one frost event affected the trial in October 2016 (Betti and Davies 2017). Assessment of frost damage using the floret sterility test (FIS) showed that clay spreading and, in particular, spading significantly reduced frost damage (p=0.05). As a result, only the treatments with standard spading (with 0-250 t/ha of clay) and spading at ½ speed (with 0-150 t/ha of clay) produced positive ROIs (Table 3) while all other treatments and control recorded a financial loss.
2017 season
Seasonal conditions in 2017 were much drier compared to 2016 and therefore soil water repellence was more expressed. Moreover, the issue with seeding depth in the newly renovated soils observed in 2016 was not repeated in 2017. As a result, the effect of soil modifications on reducing water repellency and improving early plant establishment was clearer in 2017 compared to the previous season (Fig 2a, b and c).
In general, increasing rates of clay improved early crop establishment, in particular at both Moora sites. However, at those sites it was also observed a trend with declining numbers of plants at the highest rates of clay (150 t/ha at Moora-1 and 250 t/ha at Moora 2), particularly at the Moora-2 site. This was attributed to excessive amount of subsoil clay creating a hard crust that affected crop emergence and increased surface evaporation.
Yield trends in 2017 were consistent with the previous year at both Moora sites (Table 3). However, at the Badgingarra site the treatments with spading yielded more than the one-way plough ones (unlike 2016).
At Moora-1, on the sandy gravel, all the one-way plough treatments combined with any rate of clay were significantly higher than the off-set treatments. As in 2016, the highest yield was again obtained with one-way plough combined with the lowest 50 t/ha rate of clay that also had the highest ROI followed by the one-way plough treatment with no clay (respectively 56% and 53% higher than the untreated paddock average).
Lupin grain yields at Moora-2 were consistent with the 2016 results. Highest yields were obtained from all spading treatments with or without clay. Nonetheless, the highest yielding treatment was the combination of spading with 100 t/ha of clay, that produced 0.6 t/ha more that the control treatments. Similarly to 2016, occurrence of several nights with temperatures below zero near the lupin canopies (recorded using Tinytags® temperature loggers) probably affected yield potential. The combination of dry weather during crop establishment followed by frost events throughout the maturity stage negatively impacted the yields of lupin in such a way that only three treatments with spading were able to produce positive ROIs (Table 3).
Cost-effectiveness of soil amelioration approaches after 2 years
The overall cost-effectiveness of each soil modification treatment was assessed by averaging the 2016 and 2017 ROIs.
The results indicated that on the pale sand at Badgingarra the most cost-effective treatment was the spading alone (0t/ha of clay), closely followed by one-way ploughing combined with 0 or 100 t/ha of clay (Table 3).
On sandy gravel at Moora-1 the most cost-effective treatment was the combination of one-way plough with the lowest rate of clay (50 t/ha) followed by the one-way plough at 0 and 100 t/ha clay.
The challenging weather conditions experienced at Moora-2 affected overall cost-effectiveness of the treatments. With the exception of spading at ½ speed in combination with 150 and 250t/ha of clay, only the treatments with spading (standard and ½ speed) had mean positive ROIs over two years. Nevertheless, results clearly showed that the most cost-effective treatment was the standard spading (ROI=+15%), followed by standard spading with 100 t/ha of clay (ROI=+10%) and spading at ½ speed without clay spreading (ROI=+5%). This result was primarily due to the fact that spading alone increased yields and decreased frost as well as the other clay spreading + spading treatments but at a substantial lower cost.
Figure 2. Early plant establishment (June 2016 and 2017) at the Badgingarra site (a), Moora-1 site (b) and the Moora-2 site (c).
Trial name | Clay rate (t/ha) | Tillage (incorporation) | Yields | Annual treatment cost1 | 2016 ROI | 2017 ROI | Average ROI | ||
|---|---|---|---|---|---|---|---|---|---|
2016 (t/ha) | 2017 (t/ha) | ($/ha) | |||||||
Lupin | Wheat |
| |||||||
Badgingarra (pale deep sand) | 0 | Nil (control) | 2.97 | 2.05 | 0 | 133% | 39% | 86% | |
100 | Nil | 3.22 | 2.34 | 32 | 132% | 47% | 89% | ||
150 | Nil | 3.21 | 2.35 | 48 | 122% | 42% | 82% | ||
250 | Nil | 3.34 | 2.33 | 86 | 111% | 30% | 71% | ||
0 | Off-set | 3.12 | 2.20 2.38 | 3 | 143% | 48% | 95% | ||
100 | Off-set | 3.06 | 35 | 118% | 48% | 83% | |||
150 | Off-set | 3.05 | 2.50 2.48 | 52 | 109% | 50% | 79% | ||
250 | Off-set | 3.18 | 89 | 99% | 37% | 68% | |||
0 | One-way plough | 3.20 | 2.44 | 3 | 149% | 64% | 106% | ||
100 | One-way plough | 3.54 | 2.41 2.61 | 35 | 153% | 50% | 102% | ||
150 | One-way plough | 3.42 | 52 | 134% | 57% | 95% | |||
250 | One-way plough | 3.41 | 2.63 | 89 | 113% | 46% | 80% | ||
0 | Spading | 2.92 | 2.96 | 15 | 120% | 94% | 107% | ||
100 | Spading | 3.10 | 2.87 | 47 | 115% | 74% | 95% | ||
150 | Spading | 3.06 | 3.00 | 63 | 104% | 75% | 90% | ||
250 | Spading | 2.88 | 2.73 | 100 | 76% | 48% | 62% | ||
0 | Spading X2 | 2.54 | 2.92 | 27 | 86% | 86% | 86% | ||
100 | Spading X2 | 2.71 | 3.05 | 59 | 83% | 80% | 82% | ||
150 | Spading X2 | 2.70 | 3.14 | 75 | 75% | 79% | 77% | ||
250 | Spading X2 | 2.74 | 2.83 | 112 | 63% | 50% | 56% | ||
(LSD 5%) | (0.56) | (0.47) | |||||||
Wheat | Canola |
| |||||||
| control2 | n.a. | 2.07 | 0 | n.a. | 67% | - | ||
Moora-1 (gravel sand) | 0 | Off-set | 4.18 | 2.39 | 3 | 107% | 92% | 100% | |
50 | Off-set | 4.10 | 2.63 | 19 | 98% | 105% | 102% | ||
100 | Off-set | 4.32 | 2.52 | 35 | 102% | 93% | 97% | ||
150 | Off-set | 4.26 | 2.61 | 51 | 93% | 95% | 94% | ||
0 | One-way plough | 4.54 | 2.68 | 3 | 126% | 115% | 120% | ||
50 | One-way plough | 4.62 | 2.85 | 19 | 123% | 123% | 123% | ||
100 | One-way plough | 4.55 | 2.76 | 35 | 113% | 110% | 112% | ||
150 | One-way plough | 4.64 | 2.78 | 52 | 111% | 107% | 109% | ||
(LSD 5%) | (0.21) | (0.20) | |||||||
Barley | Lupin |
| |||||||
Moora-2 (deep yellow sand) | 0 | Nil (control) | 1.41 | 1.36 | 0 | -35% | -20% | -27% | |
100 | Nil | 1.79 | 1.53 | 32 | -23% | -15% | -19% | ||
150 | Nil | 1.95 | 1.37 | 49 | -18% | -26% | -22% | ||
250 | Nil | 1.92 | 1.33 | 86 | -25% | -33% | -29% | ||
0 | Off-set | 1.36 | 1.48 | 3 | -38% | -13% | -25% | ||
100 | Off-set | 1.92 | 1.46 | 35 | -18% | -19% | -19% | ||
150 | Off-set | 1.94 | 1.38 | 52 | -19% | -26% | -23% | ||
250 | Off-set | 2.06 | 1.34 | 89 | -20% | -33% | -26% | ||
0 | Spading | 2.70 | 1.91 | 15 | 21% | 10% | 15% | ||
100 | Spading | 2.68 | 1.97 | 47 | 13% | 6% | 10% | ||
150 | Spading | 2.71 | 1.90 | 63 | 11% | 0% | 5% | ||
250 | Spading | 2.93 | 1.88 | 100 | 12% | -8% | 2% | ||
0 | Spading ½ speed | 2.51 | 1.84 | 27 | 10% | 3% | 7% | ||
100 | Spading ½ speed | 2.52 | 1.86 | 59 | 4% | -2% | 1% | ||
150 | Spading ½ speed | 2.60 | 1.61 | 75 | 4% | -17% | -7% | ||
250 | Spading ½ speed | 2.63 | 1.64 | 112 | -1% | -21% | -11% | ||
(LSD 5%) | (0.48) | (0.29) | |||||||
110 years amortisation at 6% p/a interest rate. 2Moora-1 used the average results from the untreated paddock as the control. Underlined bold values represent the top three results in each category. Negative ROIs are in italics.
Conclusion
Tillage, clay spreading and their combination have the potential to significantly improve crop growth and increase yields in water repellent soils. Understandably, the yield gains must compensate the high initial costs of these treatments, in particular when clay spreading is added to the tillage.
The initial investment is the primary factor influencing the overall cost-effectiveness of the soil amelioration treatments and our results showed that although intensive tillage (i.e. spading twice or at ½ speed) and high rates of clay increase yields compared to the control, their very high initial costs substantially reduce the return on investment (ROI).
On the other hand, we showed that even the cheaper shallow tillage, the off-set disc, in some case did not promote significant yield gains, resulting in low cost-effectiveness or even financial loss.
The use of deeper tillage methods, such as the one-way plough and spading, showed to be very cost-effective for the management of water repellent soils as they significantly increased the yields and required medium-low initial investments.
Clay spreading improved crop growth and increased yield but the high cost involved with this method can significantly reduce its cost-effectiveness. Nevertheless, our experiment showed a significant result: at low rates of clay (50 t/ha in the sandy gravel and 100 t/ha in the deep sand) clay spreading can also be one of the most cost-effective soil ameliorations when combined with one-way ploughing or spading. This is particularly important, and further research is required to better understand the long-term impact of the presence of clay subsoil in combination with these soil modifications and the productivity of water repellent soils.
Acknowledgments
This research is funded by DPIRD and GRDC through DAW00244 soil water repellence, part of GRDC’s Soil Constraints West portfolio of projects. Thanks to Graeme White, Erin Cahill, Colin McAlpine, Jonathan Lampp (Lawson Grains) and Mark Drake (Lawson Grains) for clay spreading, undertaking tillage treatments and provision of trial sites. Thanks also to Joanne Walker, Chad Reynolds and Larry Prosser (DPIRD) for the technical support. Thanks to Ben Biddulph and the frost project for floret sterility assessment and advice
Paper reviewed by: Liz Petersen
GRDC Project Number: DAW00244
References
Betti Giacomo and Davies Stephen (2016) Cost-effectiveness of combinations of clay spreading and strategic tillage for management of repellent soils: first year impacts on soil properties and crop productivity. Proceedings 2017 GRDC Grains Research Updates, 27-28 February, Perth, Western Australia. www.giwa.org.au/2017researchupdates_papers_not_for_presentation
King PM (1981) Comparison of methods for measuring severity of water repellence of sandy soils and assessment of some factors that affect its measurement. Soil Research 19, 275-285.
Viscarra Rossel, R. A. (2011), Fine-resolution multiscale mapping of clay minerals in Australian soils measured with near infrared spectra, J. Geophys. Res., 116, F04023, doi:10.1029/2011JF001977
GRDC Project Code: DAW00244,


