Farming system impact on nitrogen and water use efficiency, soil-borne disease and profit
Farming system impact on nitrogen and water use efficiency, soil-borne disease and profit
Author: Lindsay Bell (CSIRO), Kaara Klepper (formerly DAF, now GRDC), Jack Mairs (DAF), John Lawrence (CSIRO), Andrew Zull (DAF) | Date: 06 Mar 2018
Call to action/take home messages
- Start examining the performance of the whole crop sequence, not just individual crops. We propose using system WUE as a useful metric i.e. $ GM/mm water used (rain + change in soil water).
- Alternative legume and break crops have legacy benefits for soil nitrogen (N) and soil-borne pathogens.
- Crop sequences involving alternative break crops (e.g. canola, fababean and durum wheat) can achieve similar or higher returns per mm of water used to conventional crop sequences.
- Double-crop mungbeans have legacy impacts on soil moisture and root lesion nematode populations for subsequent crops.
- Consider the risks of mungbean yield reductions where root lesion nematode (RLN) is a problem and particularly if they follow susceptible crops (e.g. wheat) in double crops.
- Low crop intensity < 0.6 crops per year are showing lower system WUE, but differences due to crop intensity at higher crop frequencies so far are small.
Introduction
The northern farming systems projects are investigating how several modifications to farming systems will impact on the performance of the cropping system as a whole over several crops in the sequence. This involves assessing various aspects of these systems including water use efficiency, nutrient balance and nutrient use efficiency, changes in pathogen and weed populations and changes in soil health. The key modifications we are examining involve changes to:
- Crop intensity – ie. the proportion of time that crops are growing which impacts on the proportion of rainfall transpired by crops and unproductive water losses. This is being altered by changing soil water thresholds that trigger planting opportunities. High crop intensity systems have a lower soil water threshold (30% full profile); moderate intensity systems have a moderate soil water threshold of 50% full profile, and low intensity systems require a profile > 80% full before a crop is sown and higher value crops are used when possible
- Increased legume frequency – crop choice aims to have every second crop as a legume across the crop sequence, with the aim of reducing fertiliser N inputs required
- Increased crop diversity – crop choice aims to achieve 50% of crops resistant to root lesion nematodes (preferably 2 in a row) and crops with similar in-crop herbicide mode of action can’t follow each other. The aim is to test systems where the mix and sequence of crops are altered to manage soil-borne pathogens and weeds in the cropping system
- Nutrient supply strategy – by increasing the fertiliser budget to achieve 90% of yield potential for that crop compared with a 50% of yield potential with the aim of boosting background soil fertility, increasing N cycling and maximising yields in favourable years
- Using non-crops to build soil resilience – by using cover crops or ley pastures in the cropping rotation to increase soil C inputs, biological activity and maintaining soil cover > 50%.
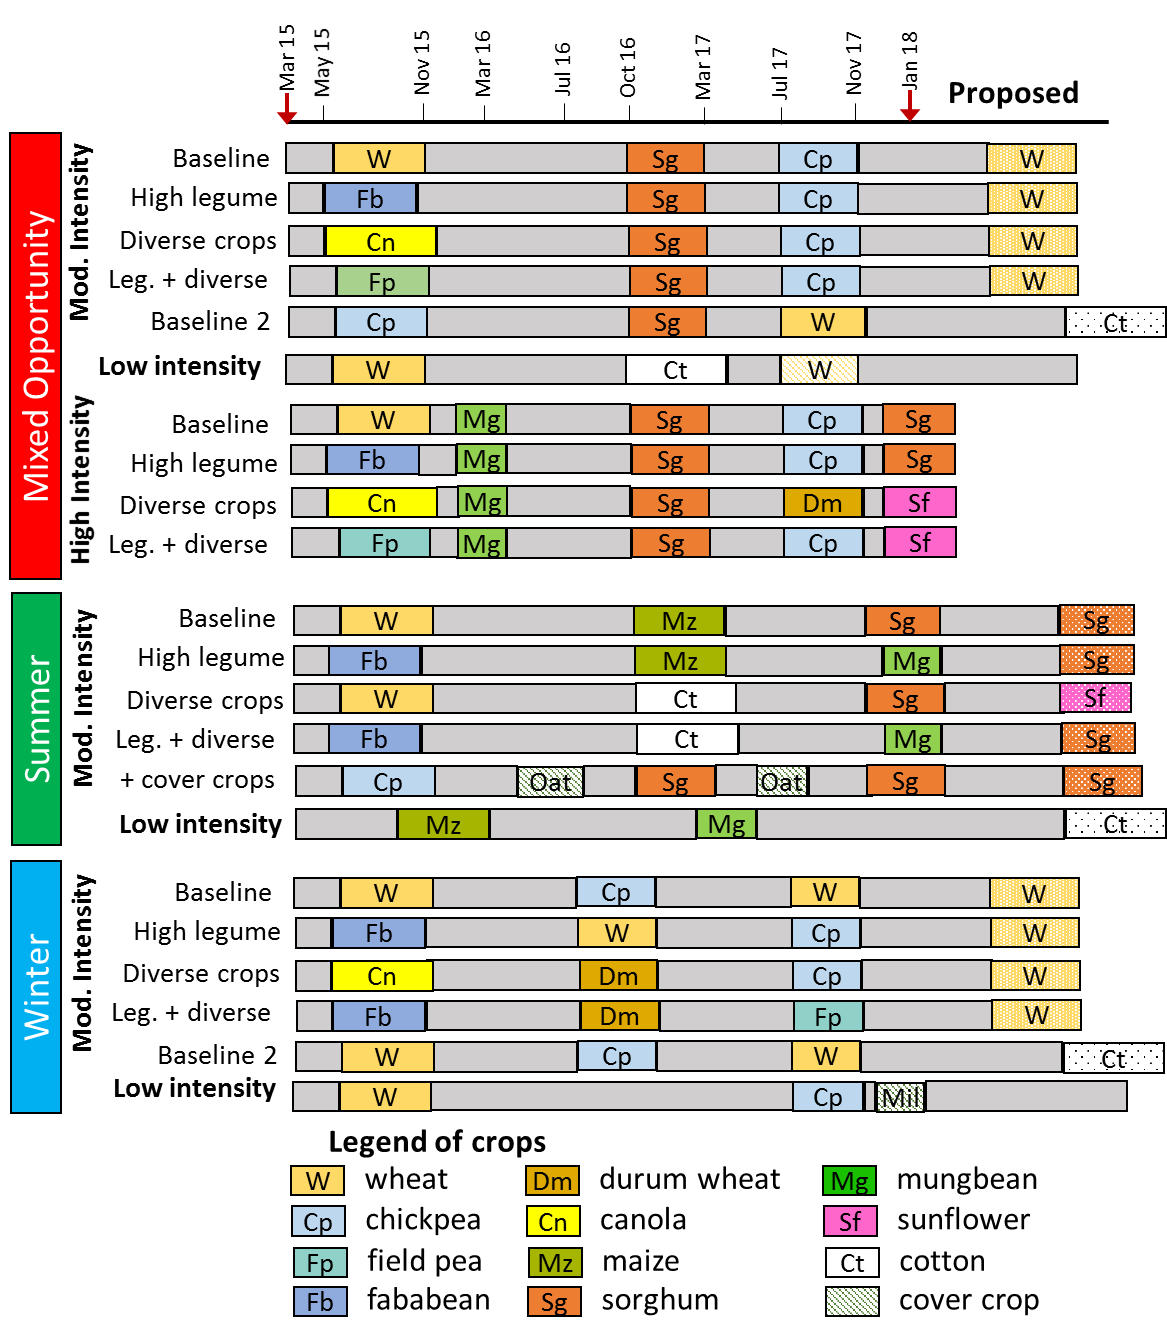
This range of system modifications are being tested across 7 locations spanning from Central Queensland to the central west of NSW. The core experimental site, located near Pampas on the eastern Darling Downs, aims to explore the interactions amongst these various modifications to the cropping systems across a range of crop sequences that occur across the northern grains region. This experiment is comparing 34 different system treatments. Crop sequences have begun to diverge, which allows comparisons of the crop sequences on different aspects of the farming system. Figure 1 shows the crop sequences that have been deployed so far based on the above modifications.

Figure 1. Timeline of different crop sequences deployed over the first 2.5 years (from Mar 15 to Jan 18) at the core farming systems experiment. Different crop sequences have emerged based upon soil water availability triggering a sowing opportunity, rules that dictate crop choice across systems aimed to represent winter dominated, summer dominated or mixed opportunity cropping systems.
This paper will focus on some of the key differences associated with these different crop choices that have emerged over the first 2.5 years of this experiment. Firstly, information on the legacy of different crops used in crop sequences and, secondly, analysis of system water use and nitrogen use efficiencies across the whole crop sequence.
Understanding legacy of different crops in crop sequences
Yield responses
Two clear examples of where crop sequence has impacted on subsequent crop yields have been associated with a) the effect of previous crop on the grain yield of a following mungbean double crop and b) a yield penalty for sorghum following the double-crop mungbean compared to where a long-fallow had been maintained.
1. Canola benefited subsequent mungbean yields
Yield of mungbean following canola was 0.3 -0.4 t/ha higher than following wheat or fababean (Table 1). There was no clear difference in soil water amongst these previous crops to explain this difference, however there was a significantly lower population of root lesion nematodes (P. thornei) after canola compared to the other winter crops. Fusarium wilt was also slightly less severe after canola. While this observation requires some further testing, this suggests that double-crop mungbean are highly susceptible to RLN in systems where they are double-cropped, which is likely to be amplified under dry growing conditions. The other observation here was the difficulty in controlling volunteer field peas in the mungbean double crop, which contributed to the lowering mungbean yield.
Table 1. Impacts of previous crop on double cropped mungbean yields in summer 15/16.
Previous crop | Mungbean Grain yield(t/ha) | Fusarium wilt incidence (%) | P. thornei at mungbean sowing (number/g soil) |
|---|---|---|---|
Canola | 0.81 | 39 | 8.4 |
Wheat | 0.48 | 42 | 18.0 |
Fababean | 0.44 | 55 | 13.8 |
Fieldpea | 0.28 | 58 | 12.4 |
2. Sorghum yield reduced by mungbean double-crop
Sorghum sown in October 2016 was preceded by a range of previous winter crops followed by either a long-fallow or a double crop of mungbeans. We observed no significant difference in sorghum grain yield between winter crops followed by the long-fallow, all crops yielding around 6.2-6.5 t/ha (Table 2). There was no evidence of long-fallow disorder following the non-mycorrhizal canola which was also then followed by a long-fallow before the subsequent sorghum crop; probably owing to the high soil P content at our site. Potential benefits of additional N provided after legumes were only small and hence not significant; there was also no response to any additional fertiliser N in this season.
On the other hand, sorghum yields were reduced by >0.7 t/ha when they followed the mungbean double-compared to the long-fallow (Table 2). This was likely attributed to 50-60 mm less soil water at sowing in these systems. Larger yield penalties were observed in sorghum following fababean-mungbean due to residues of Spinnaker® herbicide which reduced sorghum plant densities by 50%. Also notable here was that a cover crop following chickpea, had a similar effect of reducing yield of the subsequent sorghum crop by 0.8 t/ha compared with maintaining a long fallow.
Table 2. Sorghum crop yields in Feb 2017 following either long-fallow or double cropped mungbean
Previous crop sequence(X ≈ 6 month fallow) | Soil water at sowing (mm) | Sorghum grain yield(t/ha) |
|---|---|---|
Wheat-X-X- | 225 | 6.25 |
Canola-X-X- | 215 | 6.28 |
Fababean-X-X- | 196 | 6.22 |
Fieldpea-X-X- | 188 | 6.49 |
Chickpea-X-X- | 199 | 6.45 |
Wheat-Mungbean-X- | 156 | 5.56 |
Canola-Mungbean-X- | 125 | 5.51 |
Fieldpea-Mungbean-X- | 142 | 5.50 |
Fababean-Mungbean-X- | 133 | 3.95 |
Chickpea-X-Cover crop- | 151 | 5.58 |
Nematode populations
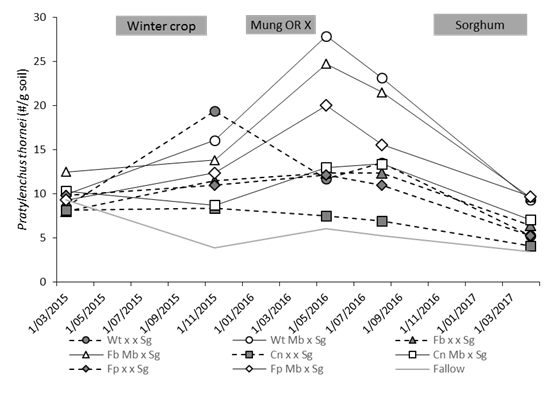
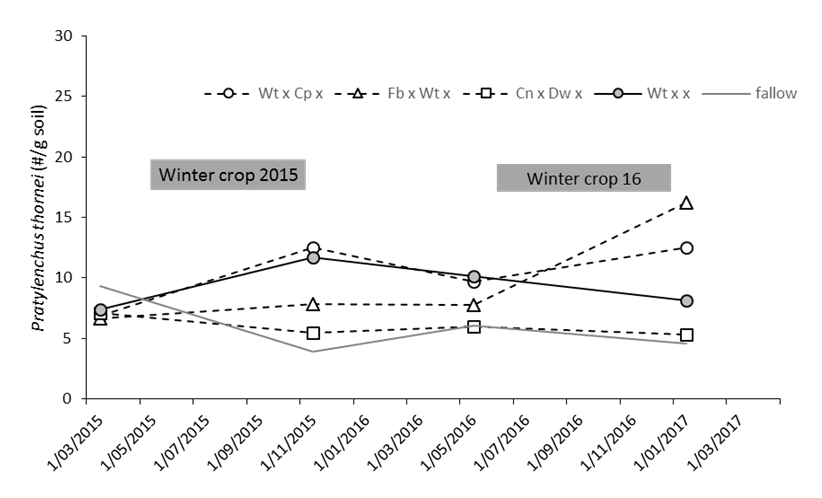
The experimental site initially had moderate levels of root lesion nematodes (RLN) (7-9 per gram). Some clear differences in the dynamics of nematode populations have been observed across the range of crop sequences that have been grown so far (Figure 2 & 3).
1. Winter crop effects on RLN populations
In winter crops in 2015 and 2016, we found that wheat cv. Gauntlet, the most tolerant and resistant wheat cultivar currently available, increased RLN populations by 2-2.5 times, significantly more than other crops. The grain legumes, Warda fababean, HatTrick chickpea and Percy field pea increased RLN populations but less than Gauntlet. Canola and durum wheat did not increase RLN populations, which declined slowly.
2. RLN populations magnify with susceptible double-crops
We found that RLN populations greatly increased during the mungbean double crop of Jade. This increase was far greater when the mungbean double crop followed susceptible crops of wheat or fababean (11-14/g) compared to when it followed canola (5/g) (Figure 1). This demonstrates that extending the period of host crops in the system, by double-cropping with two susceptible crops in a row, can further propagate the RLN population and bring about dramatic increases in their numbers. RLN populations then declined during the subsequent fallow and a sorghum crop after the mungbeans, but they remain higher where mungbean double crops were grown than in the systems that remained fallow after the first winter crop.3. Resistant crops and fallows reduce RLN populations
Our data confirm the role of resistant crops like canola, durum wheat, sorghum or fallow periods for reducing RLN populations. Two years after starting the experiments, crop sequences of canola-x-durum wheat, and canola-x-x-sorghum are the systems that have the lowest RLN populations. However, even where we have grown a sequence of canola – long fallow – sorghum, i.e. no susceptible crops for 2 years, the reductions in RLN populations are slow (declining from 7-8/g to 4/g). Despite increased levels of RLN after the susceptible winter crops, we have seen that a long-fallow followed by sorghum have reduced RLN populations back to below initial numbers (Figure 2).

Figure 2. Changes in root lesion nematode population between different opportunity crop sequences where various winter crops in 2015 of wheat (Wt), fababean (Fb), canola (Cn), field pea (Fp) or chickpea (Cp) were followed by either a long-fallow (x x) or a double-crop of Jade mungbean (Mb), and a sorghum crop (cv. MR-Taurus) in summer 2017.

Figure 3. Changes in root lesion nematode population over 5 different winter crop sequences involving either susceptible crops, wheat-chickpea (Wt x Cp x) and fababean-wheat (Fb x Wt x) compared to two resistant crops, canola-durum wheat (Cn x Dw x) or a wheat followed by a long fallow (Wt xxx).
Fallow N accumulation
We have calculated the net accumulation of mineral N over the fallows following the various crops/crop sequences. This demonstrates some interesting legacy impacts of the various crops.
- Mineralisation after canola was found to be higher than other winter crops, particularly during the summer period – due to rapid decomposition of canola leaves where much of the N is stored. When canola was followed with a mungbean crop, soil mineral N content and the N accumulation afterwards was also higher after the mungbean crop.
- Fieldpea resulted in an additional 40 kg of N accumulated over a subsequent long-fallow compared to chickpea and fababean. Chickpea and fababean increased N accumulation by 30-35 kg N/ha compared to following wheat. In the first year, soil N at harvest was 30-40 kg lower after chickpea or fababean than wheat, so this was sufficient to make up for this difference.
- Following the various summer crops in 2016/17 we found no increase in soil mineral N during the fallow following sorghum or maize; cotton was slightly higher. This is presumably due to N immobilisation with their high C:N residues. However, higher rates of N accumulation occurred after the mungbean crop (40-60 kg N/ha) compared to the other non-legume summer crops.
Table 3. Net accumulation of available soil N (kg soil mineral N increase) over fallows following different previous crops under standard nutritional strategy.
Previous crop | Summer | Winter | Total long fallow |
|---|---|---|---|
2015 | Nov-Apr | Apr-Sept | |
Wheat | + 21 | + 40 | + 60 |
Fababean | + 47 | + 42 | + 89 |
Chickpea | + 40 | + 52 | + 92 |
Field pea | + 39 | + 88 | +127 |
Canola | + 84 | + 49 | +132 |
Canola - High N (+90 kg N) | +120 | + 83 | +203 |
2016 | Dec-May |
|
|
Fallow | + 43 | ||
Wheat | + 53 | ||
Chickpea | + 89 | ||
2015/16 |
| Apr-Sept |
|
Wheat-mungbean | +76 | ||
Fababean-mungbean | +69 | ||
Canola-mungbean | +96 | ||
Maize | +67 | ||
2016/17 |
| Apr-Oct |
|
Mungbean | +54 | ||
Maize/sorghum | -14 | ||
Cotton | +17 |
Whole crop sequence performance
System water-use-efficiency
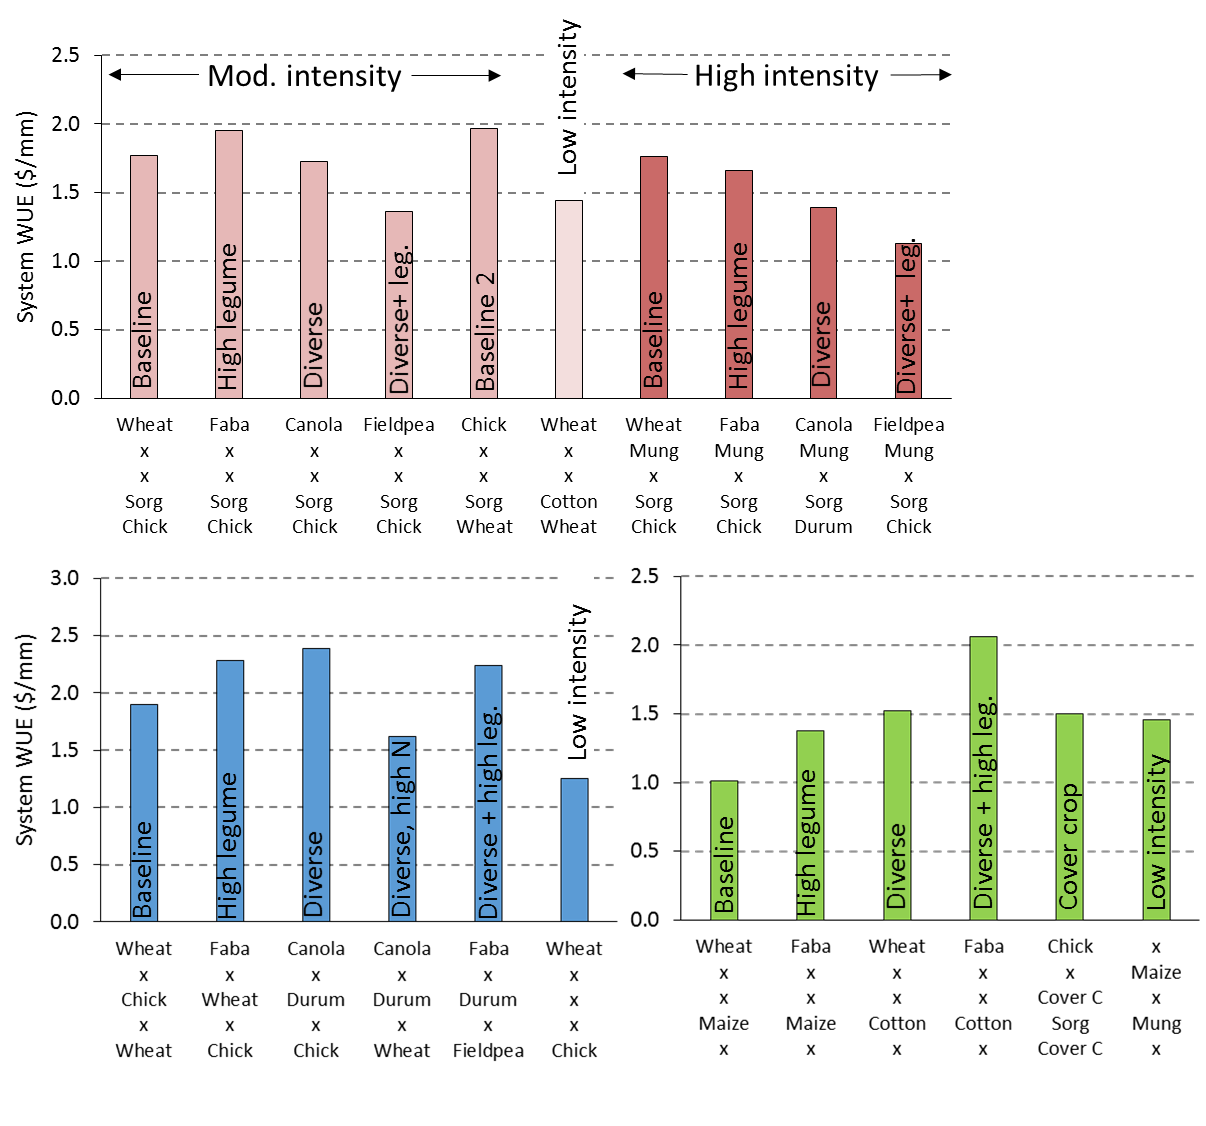
While crop water use efficiency (kg grain/mm crop water use) is a useful metric to compare performance of individual crops, it fails to account for the efficiency of soil water accumulation in the previous fallow, or legacy effects after a particular crop either in the form of residual soil water at harvest, or impact on subsequent fallow efficiency. Hence, to account for the efficiency of the farming system over time, we have calculated system water-use efficiency for the various systems over the first 2.5 years of this experiment. We define system water use efficiency as the $ gross margin return per mm of water used (i.e. rainfall + change in soil water). Gross margin over the whole crop sequence was calculated from the sum of yield multiplied by the 10-year average price for each crop, minus variable costs (fertiliser, seed, herbicides, and operations) accumulated over the whole crop sequence (Figure 4).

Figure 4. System water use efficiency ($ gross margin/mm water used) for the period from March 2015 to Sept/Dec 2017 for different crop sequences modified to increase or decrease crop intensity, increase legume frequency and/or crop diversity. Opportunity cropping systems (in red) are at the top, b) winter cropping systems (in blue) on bottom left and c) summer cropping systems (in green) on bottom right. Note summer systems are only calculated to September 2017 and have had one less crop so should not be compared with winter or opportunity systems at this time. Crop prices per tonne yield (11% moisture) farm gate after grading and transport costs ($40/t) used were: wheat - $264 (APH), sorghum - $225, mungbean - $710, maize - $285, durum wheat - $284, chickpea - $569, fababean - $394, fieldpea $280, canola - $355.
In the opportunity cropping systems, only small differences have been observed between several of the key system modifications, with 6 of the 10 systems presented here showing WUE of between $1.7 and $1.95/mm. Most notably are that the systems with high legume frequency and with increased crop diversity have similar or higher WUE than the baseline comparisons. The systems with greater crop intensity, at this stage having had an only an additional mungbean crop, have no advantage compared to the moderate intensity farming systems, and in some cases the system WUE is lower ($0.25-0.35/mm). This is due to the sorghum yield penalty was sufficient to balance the gross margin of the mungbean crop. However, the low intensity systems are currently behind in terms of system WUE, this is largely owing to the poor performance of the wheat crop following cotton, while chickpea crops double-cropped after sorghum performed much better. Systems aiming to achieve both crop diversity and high legume frequency objectives were sown to fieldpea in the first year, which had returns $700-1100 less than other crops, and subsequent benefits have not been sufficient to make up this initial cost.
In the summer and winter dominated cropping systems, several of the modifications to the farming system are showing benefits in terms of system WUE. Increased legume frequency and increased use of alternative crops has so far achieved significantly higher WUE than the baseline system. For example, in the winter systems, three of the systems where canola, durum wheat and fababeans have been used are achieving system WUE of $2.25-2.40/mm, which is 20-25% higher than a system involving a crop sequence of wheat-chickpea-wheat. The low crop intensity system, which failed to meet the required soil water to sow a crop in 2016, has significantly lower WUE than the other systems. In the summer systems, fababeans has increased WUE compared to wheat when it was followed by either maize or cotton; low maize yields (3 t/ha) in summer 16/17 has greatly reduced the profitability of these systems.
System nitrogen use efficiency
The nutrient balance (net export of nutrient) and the nutrient use efficiency (kg N exported/kg N used) of the various cropping systems are also being monitored. As with water-use-efficiency, we are attempting to quantify the efficiency that nitrogen is used amongst the various cropping systems. We have calculated this as the ratio of grain N that is removed from the system (yield x grain N content) to the net N used (i.e. the change in soil mineral N plus fertiliser additions). This means that a system NUE of > 1 means that the grain N exported is greater than can be accounted for from N applied or soil mineral N depletion. Hence, these systems have either used fixed N or have effectively utilised N mineralised from the soil. Conversely, systems with a NUE< 1 indicate that additional N has been removed from the system compared to the total N outgoing. This indicates that some N has either been lost or tied up in organic N sources that have not yet become available. Because of differences in timing of results, comparisons between summer, winter and opportunity cropping systems are not meaningful. That is, sampling here for the winter systems is at the end of a fallow and hence NUE is higher than systems sampled at crop harvest.
Fababean and chickpea exported more N and had lower N for subsequent crops than wheat or canola. The high pulse crop yields (3.5 t /ha of chickpea and 4.5 t/ha of fababean) meant they exported more grain N than the corresponding non-legume crops. This demonstrates that grain legumes do export a large amount of N and in the first year, with high levels of soil mineral N, they utilised soil N to a similar degree to the non-legume crops. However, somewhat surprisingly was the lower soil N following the legume grain crops, which resulted in the need to add additional N to meet crop budgets following these crops. Similarly, mungbean double crop also exported around 20 kg N/ha and reduced available N for subsequent crops. Soil N after mungbeans was 40-75 kg lower than the equivalent systems that remained fallow prior to sowing the subsequent sorghum crop, which required an additional 20-25 kg of N to be applied to meet sorghum N requirements.
Despite the high N removal from the legumes, increased cycling of N to subsequent crops and/or inputs of fixed N has increased system NUE relative to systems where less legumes were used. Increasing crop diversity through non-legume crops (e.g. canola or cotton) have had a negative impact on system NUE, presumably due to their higher N uptake relative to the N removed as product.
Table 4. Calculated system grain N exported, nitrogen use (applied N + change in soil mineral N (∆ SMN)), N applied (kg/ha) and system nutrient use efficiency (kg grain N/kg N used) between March 2015 and Apr 2017 across a diversity of crop sequences.
Crop sequence (X ≈ 6 month fallow) | Net grain N exported (kg/ha) | ∆ SMN + applied N (kg/ha) | N applied (kg/ha) | System NUE (kg grain N/kg N used) |
|---|---|---|---|---|
Wheat-X-X-Sorghum | 203 | 251 | 0 | 0.81 |
Wheat-X-X-Maize | 151 | 72 | 62 | 1.23 |
Wheat-X-X-Cotton | 142 | 121 | 28 | 1.06 |
Fababean-X-X-Sorghum | 259 | 189 | 23 | 1.22 |
Fababean-X-X-Maize | 212 | 93 | 92 | 1.15 |
Fababean-X-X-Cotton | 211 | 116 | 28 | 1.47 |
Canola-X-X-Sorghum | 176 | 189 | 0 | 0.93 |
Fieldpea-X-X-Sorghum | 186 | 205 | 0 | 0.91 |
Chickpea-X-X-Sorghum | 227 | 236 | 18 | 0.90 |
Wheat-Mungbean-X-Sorghum | 211 | 188 | 23 | 1.00 |
Canola-Mungbean-X-Sorghum | 177 | 201 | 0 | 0.88 |
Fababean-Mungbean-X-Sorghum | 248 | 187 | 46 | 1.07 |
Fieldpea-Mungbean-X-Sorghum | 182 | 196 | 28 | 0.82 |
Wheat-X-Chick-X- | 233 | 161 | 0 | 1.15 |
Fababean-X-Wheat-X- | 290 | 181 | 0 | 1.61 |
Fababean-X-Durum-X- | 322 | 249 | 0 | 1.29 |
Canola-X-Durum-X- | 202 | 173 | 0 | 1.17 |
Wheat-X-X-X- | 117 | 72 | 0 | 1.63 |
Acknowledgements
The research undertaken as part of this project is made possible by the significant contributions of growers through both trial cooperation and the support of the GRDC, the author would like to thank them for their continued support.
We would also like to thank specifically our co-operators and hosts at ‘Anchorfield’ who assist us implement this experiment in a variety of ways (too many to mention) that are most appreciated. We must also thank Jon Thelander, Seednet for helping source and supply much of the seed used, Paul McIntosh (Pulse Australia and AHRI) for his advice and help with our pest management program, Wes Judd and Craig Antonio who have helped with cut and conditioning hay form pasture treatments and Department of Agriculture and Fisheries farm staff for their help and patience harvesting and planting the crops.
Contact details
Lindsay Bell, CSIRO
PO Box 102, Toowoomba Qld
Mb: 0409 881 988
Email: Lindsay.Bell@csiro.au
Varieties displaying this symbol beside them are protected under the Plant Breeders Rights Act 1994
® Registered trademark
GRDC Project Code: CSP1406-007RTX,
