Understanding the physiological basis for improved wheat seedling growth on dispersive sodic soils
Understanding the physiological basis for improved wheat seedling growth on dispersive sodic soils
Take home messages
- Genetic differences in the speed of seedling germination and emergence are important factors determining whether seedlings can emerge from surface crusted sodic soils
- Selection of wheat genotypes with greater seedling emergence force and greater hypocotyl cross sectional area may potentially help to improve wheat seedling emergence in surface crusted sodic soils
- Selection for narrow seminal root angle may potentially help to identify wheat genotypes that are better adapted to sodic soils
- Wheat tolerance to the chemical constraints of sodicity might be governed by the ability of genotypes to take up calcium in roots.
Introduction
Globally, 581 million hectares (ha) of land is affected by sodicity. Australia has the most widespread area of sodic soils in the world, covering 340 million ha (Rengasamy & Olsson 1991; Rengasamy 2002). Soil sodicity is a major constraint limiting grain production, occurring in nearly 60% of the soils used for grain cropping in Australia. It is estimated to cost Australian growers $1460 million/year in forfeited grain yields (Orton et al., 2018), with grain yield on sodic soils often less than 50% of the potential yield. Rengasamy (2002) reported that grain yield decreased linearly with increasing sodicity in surface soils. Similarly, Dalal et al. (2002) found that actual wheat yield in the north-eastern grain growing region decreased from 3.5 t/ha to <2 t/ha as a result of sodicity (expressed as exchangeable sodium percentage (ESP) increasing from 4 to 16 in the topsoil (0-10 cm soil depth).
The pressure to increase the use of sodic soils for productive agriculture poses a range of challenges. Approximately 105 M ha of land, representing about 14 % of Australia, has a sodic surface soil [0 to 15 cm; (Searle 2014). These sodic surface soils are often prone to surface crusting and hard setting. Soil crusting is a major problem in the semi-arid tropics particularly when heavy showers are followed by rapid drying after sowing (Richards 1953; Parker & Taylor 1965). This surface crust imposes a mechanical resistance to emerging seedlings. If the emergence force exerted by the seedling is lower than the mechanical resistance of the surface crust, seedlings will fail to emerge (Awadhwal & Thierstein 1985). Previous studies have reported the impact of soil crust on emergence of a range of crop species, including wheat, pearl millet (Pennisetum glaucum), maize (Zea mays), sorghum (Sorghum bicolor) and barley (Hordeum vulgare) (Hanks & Thorp 1956; Chaudhary & Prihar 1974; Soman et al., 1984; Braunack & Dexter 1988; Abu-Awwad & Kharabsheh 2000).
Root system characteristics are of fundamental importance to a plant for soil exploration and below-surface resource acquisition, and hence are strongly related to plant adaptation to sub-optimal conditions (Manschadi et al., 2006). The distribution of roots in the soil influences the pattern of water and nutrient uptake. The seminal root angle has been associated with temporal and spatial acquisition efficiency of soil resources (Manschadi et al., 2008). Nakamoto and Oyanagi (1994) demonstrated significant genotypic variation in the angle of wheat seminal roots and argued that deeply-rooted wheat genotypes exhibit narrower seminal root angles, while genotypes with a shallower root system tend to grow their seminal roots more horizontally. Thus, wheat genotypes with a narrow seminal root angle may be more likely to extend deeper into the soil, which could provide an advantage for plants growing in sodic soils.
In addition to the physical constraints caused by dispersion, sodic soils can also have chemical constraints, including sodium and chloride toxicity, and deficiencies in essential plant nutrients, e.g. calcium, potassium. Calcium deficiency can particularly be a problem in Australian sodic soils, where calcium concentrations in the soil solution are often very low (<1 mM) (Reuter & Robinson 1997), and high sodium: calcium ratios can potentially cause a nutritional imbalance. Similarly, potassium is also often found at low levels, although potassium can be released in many sodic soils because of the presence of illite and borate (Cartwright et al. 1986). Numerous studies have shown that an increase of ESP causes a significant decrease in potassium availability and an increase of sodium in plant tissue of various crop plants, e.g. cotton (Gossypium) (Dodd et al., 2010; Rochester 2010), rapeseed (Brassica napus) (Porcelli et al., 1995), sugarcane (Saccharum officinarum) (Dang et al., 1999), rice (Oryza sativa) (Qadar 1995 ), aloe vera (Aloe barbadensis miller) (Rahi et al., 2013), barley (Hordeum vulgare) (Dang et al., 2016) and wheat (Triticum aestivum .L) (Chhipa & Lal 1995; Wright & Rajper 2000).
Improving our ability to manage sodic soils requires innovative approaches. Rather than ameliorating sodic soils, a complementary approach can be to identify genotypes with improved productivity in these soils. In general, the development of genetic approaches for improving productivity in sodic soil requires the expression of tolerance to several soil constraints. Therefore, to develop sodicity tolerant crops and genotypes, both the physical and chemical constraints of sodic soils need to be considered. Identification of crop genotypes tolerant to physical and chemical impacts of sodic soils might be beneficial in improving crop productivity in these soils.
This study aimed to determine if the differences in seedling emergence between wheat genotypes grown in soils with a surface crust could be related to traits associated with superior emergence from sodic soils e.g. kinetics of seed germination, seedling emergence force, root traits and adaptability of these genotypes. It is intended that the information from this study will assist breeders, researchers and agronomists to improve wheat production on sodic soils.
Materials and methods
Experiment 1: Characterising seed germination
A total of 38 wheat genotypes were selected (Appendix A, Table A1), many widely grown in Australia. All seed samples originated from a harvest site at the Queensland Government research farm at Kingsthorpe, Queensland, Australia (27.52 °S, 151.79 °E) in 2015. Laboratory germination tests (Petri dish assays) were used to test the germination of wheat genotypes in the absence of soil constraints. Germination was assessed by placing 100 seeds of each genotype on filter paper in Petri dishes moistened with 5 ml deionized water, with two replicates per treatment. The Petri dishes were maintained at 20 °C, being in the dark for the first 5 d and then in a light/dark regime (12 h / 12 h) for a further 3 d. Relative germination proportion was calculated by counting the number of germinated seeds after 3 and 5 d. After a total of 8 d, seeds without visible swelling due to imbibing water were considered as non-germinating seeds.
Experiment 2: Impact of surface crust of sodic soils on emergence of wheat genotypes
The aim of this experiment was to determine the impact of surface crust on seedling emergence. A soil was chosen to be representative of the sodic dispersive soils affecting wheat crops in the western Darling Downs cropping region of Queensland. This sodic dispersive soil was collected from a property near Goondiwindi in southern Queensland (28.23 °S, 150.31 °E). Surface soil samples (0-10 cm depth) were air-dried and ground to pass through < 2 mm sieve. Soil pH (ISO 1994) and electrical conductivity (ISO 2005) were measured in 1:5 soil:water extracts. Exchangeable sodium concentrations and the cation exchange capacity were determined using a 1 M NH4Cl (pH 8.5) extracting solution (Tucker 1954). Field water holding capacity was calculated using the column method (Asher et al., 2002), and bulk density measured in the field using the method described by McKenzies et al. (2002). Prior to extraction, soluble salts were removed by pre-washing with 60% aqueous alcohol. The extracts were analysed for the exchangeable cations on an inductively coupled plasma-optical emission spectrometer. Exchangeable sodium percentage ESP was calculated from the amount of exchangeable sodium relative to the cation exchange capacity (Tucker 1985).
The experiment consisted of 76 treatments, resulting from the factorial combination of 38 wheat genotypes and two soil crust strengths, with each treatment having six replicates. For the 38 genotypes with six replicates, a total of 19 pots per soil crust treatment were required, in total 38 pots for two crust treatments. Each pot was randomly allocated a strong or weak crust treatment. Each genotype was randomly allocated to one of the twelve positions within each pot where the position is the experimental unit for genotype. A single seed was allocated to each position within a pot. The air-dried surface soil was placed in rectangular plastic pots, 70 cm long × 22 cm wide × 11 cm deep (overall pot depth of 16 cm). Soils were watered to 70 % of field capacity by repeatedly spraying deionized water evenly onto the soil over a 24 hr period. After wetting the soil to 70 % field capacity, seeds were placed on the surface of this soil. Once the seeds were placed on the surface of the soil in the appropriate pots, they were then covered with an additional 3 cm of dry soil .
The pots were then placed in the spray cabinet and two rainfall treatments were used to create crusts of two different strengths. Specifically, we used total rainfall treatments of 10 mm/pot and 24 mm/pot. Hereafter, these two treatments are referred to as ‘weak crust’ (10 mm/pot) and ‘strong crust’ (24 mm/pot). After treatments, pots were removed from the spray cabinet and placed in the glasshouse. In order for both treatments to receive the same total amount of water, the weak crust treatments were further watered manually (lightly sprayed on the soil surface) to provide an extra 14 mm/pot, with this water applied 2 and 3 days after the simulated rainfall treatment. The pots were left in the glasshouse for a total of 12 days to allow the seeds to germinate and emerge, during which time we measured soil crust strength and thickness, seedling emergence and time of emergence.
Experiment 3: Emergence force of 16 genotypes in the absence of growth-limiting factors
This experiment examined 16 wheat genotypes, comparing their emergence force in controlled conditions to determine if genetic variability exists in the ability of the seedling coleoptile to push or displace superficial mechanical obstacles. These 16 wheat genotypes were selected from those found previously to differ markedly in their emergence in Experiment 1.
This experiment was performed in a laboratory, maintained at a constant temperature of 20 °C. To determine differences in seedling emergence force, 16 wheat genotypes were randomly allocated to blocks using a randomised block design with a total of six replicates. A mechanical device was developed (Figure 1) to record the force exerted by the seedling coleoptile. The device consisted of a stainless-steel beam of 0.4 mm thickness and a width of 20 mm suspended above a seed. A strain gauge was attached to the beam to measure the displacement of the beam over time. The wheat seed was placed in a slot cut within a piece of foam that was held underneath the stainless-steel beam. A 100 mL container of 1 mM CaCl2 [ionic strength (I) of 0.003 M L-1] was placed underneath the foam and cotton strings coming out from the foam were placed in the solution. The simple nutrient solution contained 1 mM CaCl2 as it is known that a root elongation requires a continuous supply of calcium due to its low mobility in the phloem (Burstrom 1953; Amor & Marcelis 2003). By using this approach, the foam remained moistened and provided a continuous supply of calcium. The wheat seeds were germinated inside the foam and grown for total 14 days. When the seedling emerged, it pushed against the beam, with the strain gauge measuring the movement of the beam from which the emergence force of the seedling could be calculated. The strain gauge was connected to a data logger (Quantum X data acquisition system DA, MX840B, HBM, Germany). To convert measured strain to emergence force (N) a calibration was developed, with strain measured at loads ranging from 0 to 9 N at 1.0 N intervals.
After completion of the seedling emergence force experiment, each seedling was carefully removed from the foam and cleaned to assess the cross-sectional area of the hypocotyl. This was measured by collecting images of each seedling . The images were analysed to determine the cross-sectional area. The measured emergence force of each genotype was correlated with the hypocotyl cross sectional area to quantify any significant correlation between seed parameters and seedling emergence force.
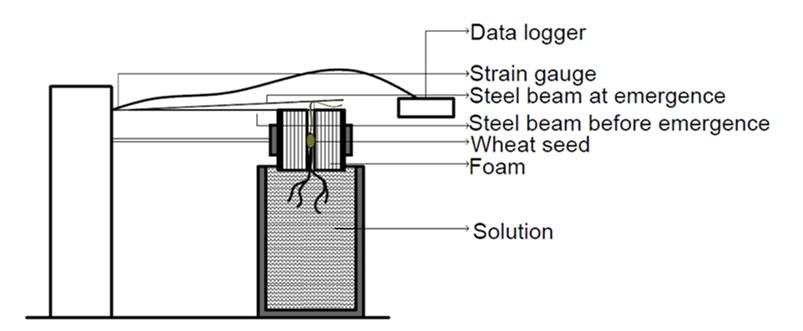
Figure 1. Experimental device designed to measure seedling emergence force
Experiment 4: Variation in root angles of 16 wheat genotypes
Experiment 4 aimed to determine whether wheat genotypes vary in seminal root angle in sodic soils. This experiment consisted of 16 genotypes grown in a soil with an ESP of 10% and a bulk density of 1.2 g/cm3, with nine replicates in a complete randomised design. Each pot contained 24 positions and each position contained one seed of a randomly allocated genotype. Root angle were measured using the “clear pot” method described by Richard et al. (2015). Transparent plastic pots of 200 mm diameter and 190 mm height (3 L) were used for the experiment, each one filled with a soil of ESP 10.
Prior to filling the pots, soils were moistened to 70% of field capacity using deionized water and left overnight at room temperature. During planting, pots were filled with soil to 4.5 cm depth before the seeds were carefully placed along the pot wall to ensure root growth would be visible during growth. The pots were then filled to the brim with soil before being placed inside 4 L black pots to exclude light from the developing coleoptile. During the course of the experiment, soil water was maintained at field capacity, and the pots were placed in a controlled growth cabinet of constant temperature at 20°C. The root angle of each seedling was recorded daily for 14 days, starting 3 days after sowing. Images were taken from each pot. The root angle and maximum coleoptile length was measured.
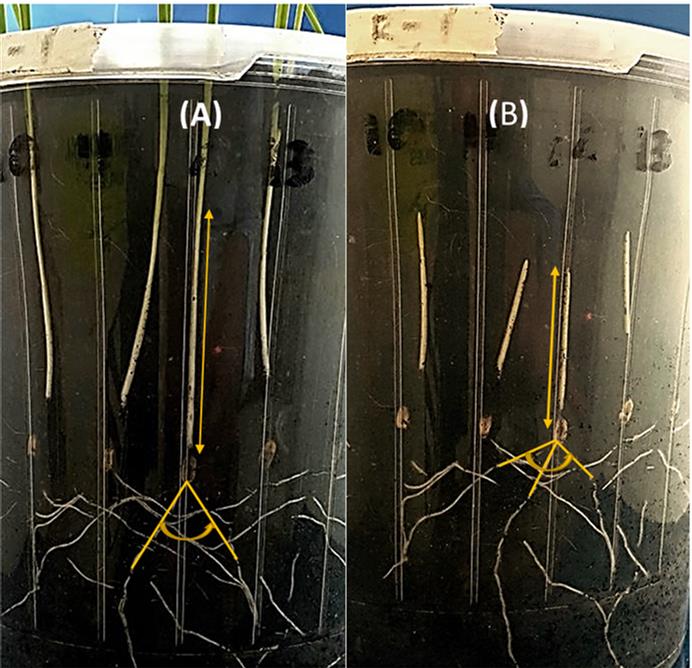
Figure 2. Maximum coleoptile length and seminal root angles (yellow lines) of wheat genotypes in Experiment 1 on 14 days after sowing in soil with ESP values of (A) 4 % and (B) 17 %
Experiment 5: Wheat seedling response to ionic imbalance
This study aimed to determine the impact of high sodium concentrations on seedling emergence, sodium-induced calcium deficiency, nutrients concentration in youngest mature leaf (YML) and root, shoot and root growth of four selected wheat genotypes (Baxter, EGA Gregory, Spitfire and Ventura) at five different sodium adsorption ratio (SAR) values (0, 10, 20, 30, and 60) using solution culture.
A solution culture experiment was conducted to investigate the impact of high SAR conditions on growth of wheat. The five different SAR values (0, 10, 20, 30 and 60 (mmolcL-1)0.5) tested, were equivalent to soil ESP values of 0, 13, 23, 31 and 47. These ESP values are commonly found in many of the surface and subsoils of the region (Dang et al. 2006).
For each genotype, 10 seeds were placed on piece of shade cloth that was supported using foam cups and were suspended in the 10 L buckets. There were four cups in each bucket, yielding 40 seeds per genotype in each replicate. This allowed seeds to take up moisture from below but ensured that they were not covered by the solution. Seeds were then covered by white polypropylene beads. At the end of the experimental period, 14 days after sowing, plants were harvested before being separated into root, stem plus petiole, and youngest mature leaf (YML). Images were taken of the roots from each pot. Root length were measured from these images. Roots were washed in deionized water to remove any adhering solution. The various plant parts were dried at 65 °C for 72 hrs and the dry matter (DM) of the shoots and roots recorded before measurement of concentrations of Ca, Cu, Fe, K, Mn, Mg, Na, P, S and Zn in the youngest matures leaves and root tissues.
Results
Experiment 1: Characterising seed germination in absence of soil constraints
All 38 genotypes were found to have ≥ 80 % germination other than Batavia (76 %) and Jandaroi (78 %) (Figure 3). There was significant interaction between genotypes and day of germination (P<0.0001), indicating that not only did the genotypes differ in the proportion of seeds that germinated, but that there were differences in how quickly they germinated. Specifically, genotypes that germinated quickly included Westonia, Ventura, Wallup, Trojan, Yitpi, Tammarin Rock, Gladius, Krichauff, Hydra and Viking (all having > 80 % germination after 3 days), while Jandaroi, Emu Rock, Impala, Magenta, Suntop, Aurora, Axe and Pelsart all had < 50 % germination after 3 days.
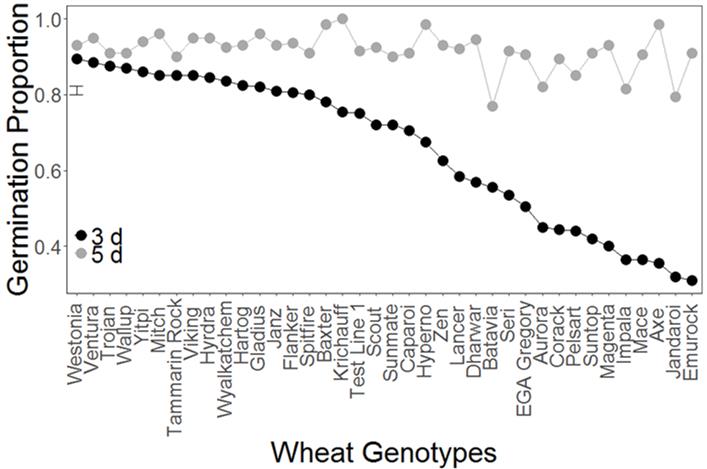
Figure 3. Germination of wheat genotypes after 3 and 5 days in a Petri dish (Experiment 1). The analysis showed that there was a significant interaction effect between genotype and time (days) (P<0.001). The vertical bar on the left indicates the LSD between genotypes. Varieties Ventura , Trojan, Wallup, Yitpi, Mitch, Tammarin Rock, Viking, Hydra, Wyalkatchem, Gladius, Flanker , Spitfire, Scout, Sunmate, Caparoi, Hyperno, Zen, Lancer, EGA Gregory, Aurora, Corack , Suntop, Magenta, Impala, Mace, Axe, Jandaroi and Emu Rock are protected under the Plant Breeders Rights Act 1994.
Experiment 2: Seedling emergence of wheat genotypes varied in crusted sodic soils
Soil crust strength and thickness in Experiment 2 varied between the two crust treatments (weak and strong). For the weak crust treatment (10 mm/pot) the increase of crust strength and thickness over time was slower compared to the strong crust treatment. At the time of seedling emergence (from 4 to 10 days), soil strength ranged from 0.78 to 1.2 kg/cm2 (76 to 117 kPa) in the weak crust treatment, whereas it ranged from 1.47 to 2.69 kg/cm2 (144 to 263 kPa) in the strong crust treatment. Importantly, the crust strength in the strong crust treatment was close to that recorded in the field in June 2016. The crust thickness also increased with time. At the time of emergence, crust thickness ranged from 0.51 to 0.95 cm in the weak crust treatment and from 1.37 to 2.16 cm in the strong crust treatment.
Seedling emergence differed significantly between the two crust treatments (P<0.001) with the average emergence in the strong crust treatment (20% emergence) being significantly lower than in the weak crust treatment (69% emergence, Figure 4). For example, the genotype Ventura had high overall emergence, but emergence in the strong crust treatment (69%) was lower than in the weak crust treatment (100%, Figure 4). Similarly, Aurora, Axe, Baxter, Corack, and EGA Gregory all had emergence > 50% greater than 0.50 proportional emergence in the weak crust treatment but did not emerge in the strong crust treatment (0% emergence).
Experiment 3: Emergence force of 16 genotypes
Significant differences (P<0.001) were observed between the emergence forces of the 16 wheat genotypes when grown in a simple nutrient solution of 1 mM CaCl2, varying almost five-fold from 0.07 to 0.36 N (Figure 5). The genotypes Ventura, Viking, Seri and Spitfire were found to have a relatively higher emergence force than the other genotypes (mean emergence force >0.18 N). Genotypes Corack, Batavia, Wyalkatchem, Impala, Krichauff, Dharwar and Lancer tended to have intermediate emergence force (0.11 to 0.17 N), while EGA Gregory, Aurora, Baxter, Mitch and Axe had low emergence forces (ranging from 0.07 to 0.10 N) (Figure 5).
Significant differences (P<0.001) were also observed between the hypocotyl cross sectional area of the 16 wheat genotypes when grown in a simple nutrient solution, varying almost three-fold from 1.26 to 3.45 mm2 (Data not shown). The genotypes Ventura, Viking, Seri and Spitfire
have relatively large hypocotyl cross sectional areas compared to the other genotypes (mean hypocotyl area > 2.88 mm2). A positive relationship was observed between hypocotyl cross sectional area and seedling emergence force of the 16 wheat genotypes (R2=0.54).
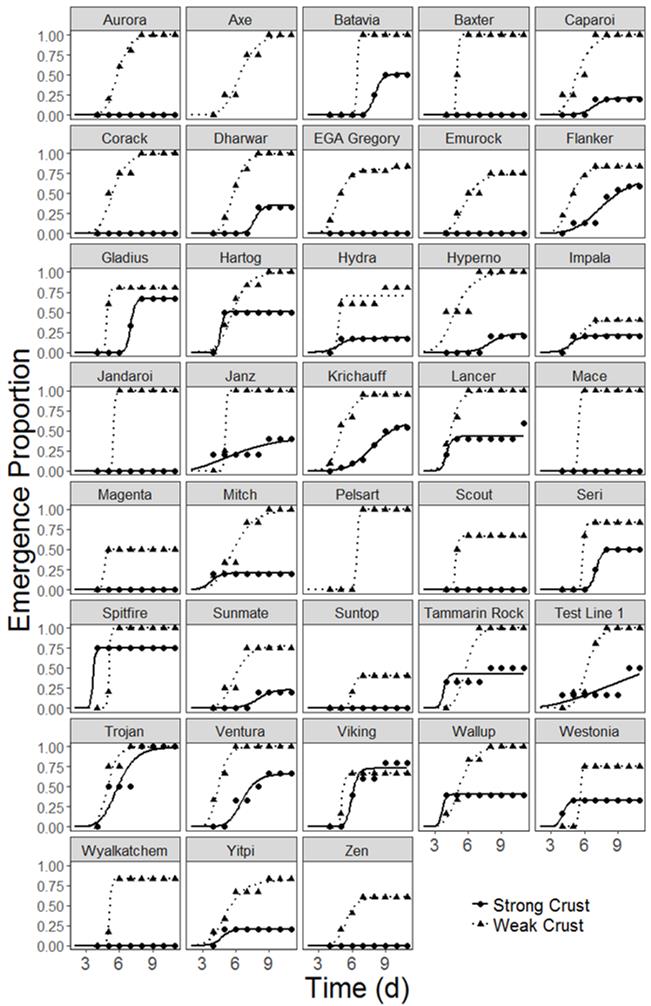
Figure 4. Seedling emergence proportion of wheat genotypes in the weak and strong crust treatments along with time. Genotypes (Axe, Pelsart) which exhibited insufficient germination in the strong crust treatment are excluded from this analysis, and the line is not shown (Experiment 2). Varieties Ventura, Trojan, Wallup, Yitpi, Mitch, Tammarin Rock, Viking, Hydra, Wyalkatchem, Gladius , Flanker, Spitfire, Scout, Sunmate, Caparoi, Hyperno, Zen, Lancer, EGA Gregory, Aurora , Corack, Suntop, Magenta, Impala, Mace, Axe, Jandaroi and Emu Rock are protected under the Plant Breeders Rights Act 1994.
Experiment 4: Variation in coleoptile length and root angles of 16 wheat genotypes
Significant differences were observed in the root angle for different genotypes (P<0.001, Figure 6). The root angle of 16 wheat genotypes ranged from 88° to 126°. Wheat genotypes Wyalkatchem, Corack, Mitch, Aurora, Axe, Baxter, Impala, Lancer , Batavia and EGA Gregory had wider root angles ranging from 109° to 126°, whereas Ventura, Viking and Spitfire had narrower root angles ranging from 88° to 91°. Wheat genotypes Seri, Dharwar and Krichauff had intermediate root angles ranging from 103° to 105°.
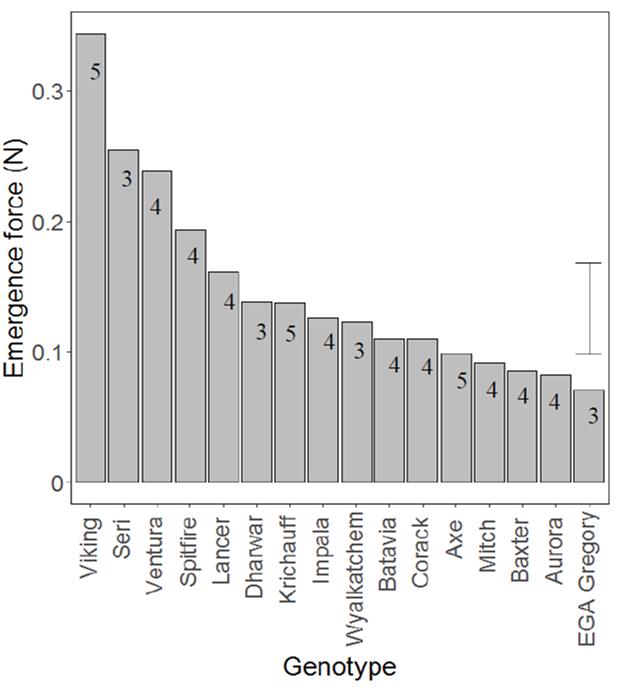
Figure 5. The emergence force for 16 wheat genotypes in Experiment 1. There were significant differences between genotypes (P<0.001), with the vertical bars showing the LSD between genotypes. Values inside the bars represent the number of seeds germinated out of six replicates of each genotype sown (Experiment 3). Results were analysed based on the germinated seeds only. Varieties Viking, Ventura, Spitfire, Lancer, Impala, Wyalkatchem, Corack , Axe, Mitch, Aurora and EGA Gregory are protected under the Plant Breeders Rights Act 1994.
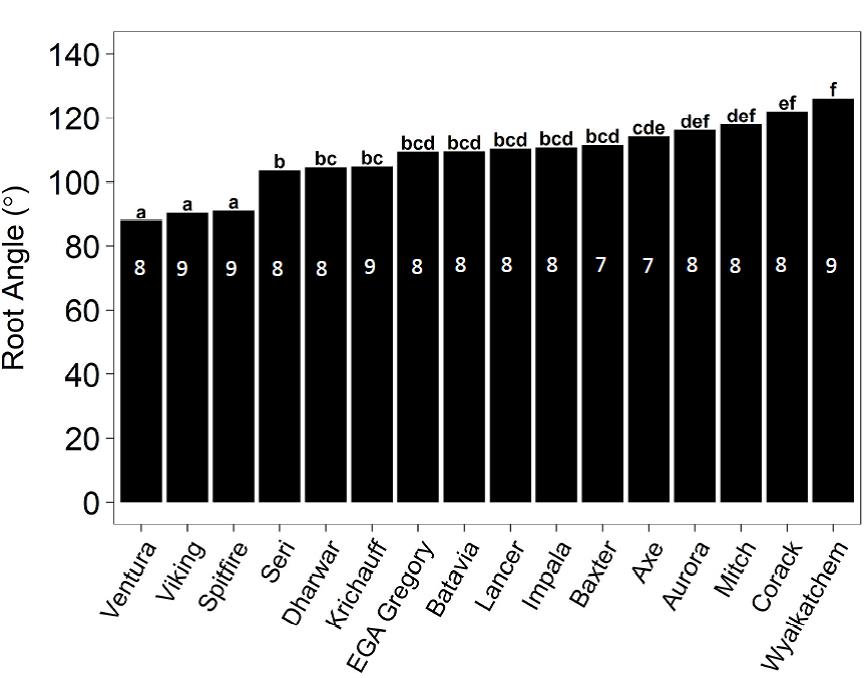
Figure 6. Mean root angle of wheat genotypes in sodic soil (ESP 10 %, bulk density 1.2 g/cm3), Experiment 4. Treatments with the same letter are not significantly different. Numbers inside the bars represent the number of seeds germinated for each genotype out of nine replicates sown. Varieties Ventura, Viking, Spitfire, EGA Gregory, Lancer, Impala, Axe, Aurora, Mitch , Corack and Wyalkatchem are protected under the Plant Breeders Rights Act 1994.
Experiment 5: Wheat seedling response to ionic imbalance
A significant (P<0.001) negative correlation was found between seedling emergence and SAR of the solutions for all four genotypes (P<0.0001). At a SAR value of 0, all the four genotypes had ≥ 80% seedling emergence. The emergence rate decreased significantly as SAR increased, with significant differences between the four genotypes at SAR 60 (P<0.05). Shoot dry matter of all the four genotypes was reduced with increasing SAR (P<0.0001). At SAR 0, shoot dry matter of the four genotypes ranged from 0.26 to 0.31 g, while at SAR 60, shoot dry matter ranged from 0.04 to 0.13 g. A significant interaction was found for root dry matter, with the pattern of decrease in root dry matter with increasing SAR depending upon the genotype (P<0.001). Specifically, for Baxter, Spitfire, and Ventura, root DM decreased from 0.21-0.25 g at SAR 0 to 0-0.03 g at SAR 60, while for EGA Gregory the root DM remained constant (0.2-0.23 g) irrespective of SAR.
For all four genotypes, the calcium concentration of the youngest mature leaves tended to decrease as SAR increased. This decrease was largest for Ventura (decreasing from 0.68 to 0.04%). and smallest for Spitfire (decreasing from 0.58 to 0.33%). For all four genotypes, the potassium concentration of the youngest mature leaves tended to decrease as SAR increased. This decrease was largest for Ventura (decreasing from 3.83 to 0.42 %) and smallest for EGA Gregory (decreasing from 4.14 to 3.01 %). In contrast to calcium and potassium, the concentration of sodium in the youngest mature leaves increased significantly with increasing SAR till 30 for all the four genotypes. Though no significant variation (P=0.09) was observed between the genotypes in sodium concentration. A significant difference was found in the potassium: sodium ratio in wheat youngest mature leaves between treatments (P<0.0001).
For all four genotypes, the calcium concentration of the roots tended to decrease as SAR increased (Figure 7). This decrease was largest for Ventura (decreasing from 0.45 to 0.18%). and smallest for EGA Gregory (decreasing from 0.45 to 0.29%). Significant differences in potassium root concentration were observed for all the four genotypes in response to SAR (P<0.01, Figure 7). This decrease was largest for Ventura (decreasing from 3.96 to 1.11%) and smallest for Spitfire (decreasing from 2.58 to 2.01%). In contrast to calcium and potassium, the concentrations of sodium in the roots were significantly higher for all four wheat genotypes grown in SAR 10, 20 and 30 as compared to SAR 0 (P<0.0001, Figure 7). The average sodium concentration in roots was almost 11-fold higher in SAR 30 compared to SAR 0 (Figure 7). However, for genotypes Baxter and Spitfire the concentration of sodium concentration in roots was lower at SAR 60 compared to SAR 30. EGA Gregory and Spitfire (1.34 and 1.99%) trended towards higher sodium concentration in the roots than Ventura and Baxter (0.43 and 0.39%, Figure 7).
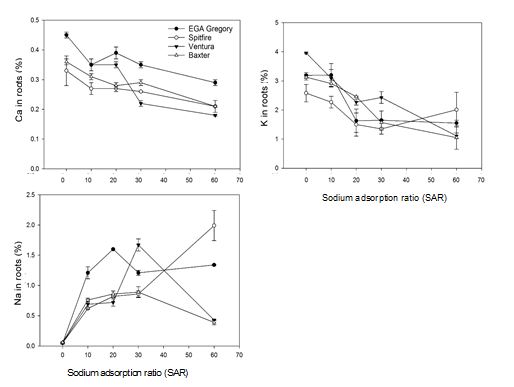
Figure 7. Nutrient concentration in roots of four wheat genotypes in five different SAR treatments averaged over four replicates (Experiment 5). The bars in the graphs present the standard error between the replicates. Varieties EGA Gregory, Spitfire and Ventura are protected under the Plant Breeders Rights Act 1994.
Discussion
Surface soil crust and seedling emergence
One of the major physical constraints that occur in sodic soils is the formation of surface crusts. In southern Queensland wheat is often grown on sodic soils. In this region, wheat is generally sown in May or early June. Seedling emergence generally occurs within 14 days after sowing. Probability analysis of average rainfall for a typical location (Burilda Station) in this region (Figure 8) from 15th May to 14th June over 58 years showed that the probability of getting rainfall ≥ 30 mm is more than 50% in the period of plant emergence or just after sowing, which might create a surface crust of strength 1.47 to 2.69 kg/cm2.
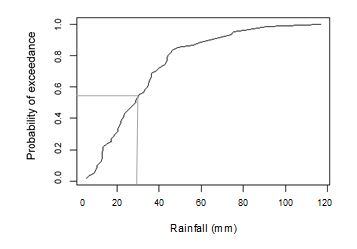
Figure 8: Probability of exceedance of rainfall (from 15th May to 14th June) (mm) data
of Burilda station (28.16°S, 150.28°E), from 1960 to 2018;
(Australian Government. Bureau of Meterology 2016)
In Experiment 2, surface crusting relevant to field condition was shown to reduce the capacity of wheat seedlings to emerge through the thicker layer of a ‘strong crust’. All the wheat genotypes tested achieved higher seedling emergence when planted in a soil with a ‘weak crust’ compared to those with a ‘strong crust’. In the ‘weak crust’, seedlings of most of the wheat genotypes tested emerged easily within four to seven days (Figure 4). In ‘strong crust’, the thickness and strength of the crust increased with time and genotypes showed variability in their ability to emerge. Four different scenarios were observed in the strong crust. Firstly, some genotypes emerged easily and achieved higher seedling emergence in strong crust (Figure 9a), e.g. Spitfire. Secondly, seedlings of some wheat genotypes were able to push against the thick surface crust, which resulted in successful but delayed emergence (Figure 9b), e.g. Trojan. Thirdly, the coleoptiles of some genotypes started growing underneath the crust and searched for a crack through which to emerge, which resulted in delayed emergence (Figure 9c), e.g. Ventura. Finally, seedlings of some genotypes were unable to achieve any of these three successful outcomes and remained curled up underneath the crust. Thus, seedling emergence was prevented even though successful germination occurred (Figure 9d), e.g. EGA Gregory.
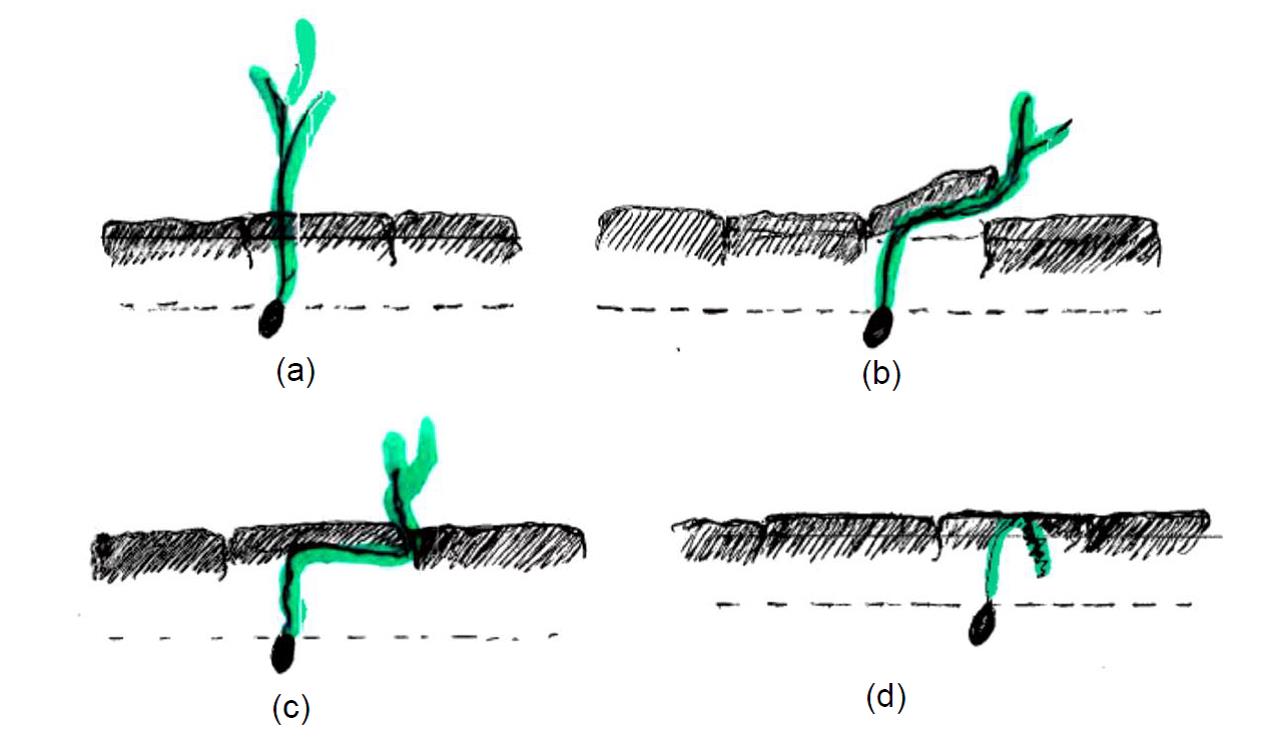
Figure 9. Four different mechanisms of seedling emergence that occurred in the strong crust condition of sodic soils in Experiment 2
Overall seedling emergence was reduced in the strong crust condition (Figure 4). The significant variation in the ability of different genotypes to emerge through a ‘strong crust’, indicated that particular traits must exist to allow these genotypes to emerge more successfully through crusted soil.
Relation with seedling emergence in the field
The results from the current study were compared to field results made available from a study performed independently of this work. In 2016, University of Queensland researchers conducted a field trial on the property “Binara”, near Goondiwindi in southern Queensland (28.23 °S, 150.31 °E). Soils used to measure seedling emergence in Experiment 2 were collected from the same property. At the site, 38 wheat genotypes were sown in 6m x 2m plots. Genotypes were chosen to represent cultivars that were available to growers in the region, as well as cultivars known to vary in adaptation to the prevailing soil stress conditions. Seedling emergence was counted at the early tillering stage of the crops for each plot and compared to the target population of 100 plants per square metre of area. The mean proportional emergence [(seedling/m2)/100] of seedlings of each genotype was compared with the seed emergence rate obtained from the glass house study in Experiment 2 at two different crust conditions (Figure 10).
A significant positive relationship was observed between seedling emergence in the field and seedling emergence from the strong crust treatment in Experiment 2 (R2=0.82). Field crust strength ranged from 1.2 to 3 kg/cm2, which was close to the range of 1.47 to 2.69 kg/cm2 for strong crust created for the pot experiment. In contrast, the emergence rate was higher in the weak crust pot experiments compared to the field with no clear correlation (R2=0.07) as the crust strength of the weak crust treatment was lower than the field situation (Figure 10).
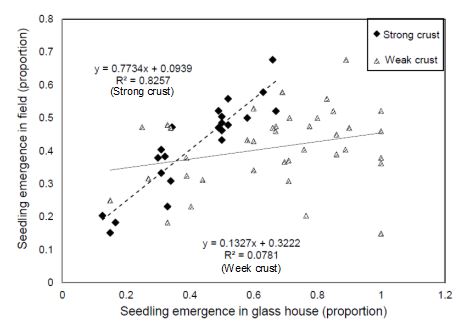
Figure 10. Correlation between seedling emergence in control environment (strong crust and weak crust, Experiment 2) and relative field emergence
Plant traits influence seedling emergence from crusted soil
Rapid germination allowed seedlings to emerge before crust was fully developed
The seedlings that germinated quickly successfully emerged before full crust strength was developed. Correlation between seed germination rate on day 3 using Petri dish assays in the control treatment (indicated that early germination of wheat genotypes can be an important factor driving seedling emergence in surface crusted sodic soils. In the absence of soil constraints , the germination of seedlings did not vary significantly between genotypes after 5 days. However, the germination rate on day 3 showed that some genotypes were able to germinate earlier (e.g. Ventura) was earlier than others (e.g. Mace). The genotypes that germinated on day 3 were able to emerge through the soil crust while crust strength and thickness were still relatively low (strength of <1.3 kg/m2 and thickness <1.3 cm) (Figure 11) and thus emerge easily (Figure 9a). The seeds that germinated on day 6 however, had to emerge through a higher crust strength (≥2 kg/cm2) and thickness (≥1.5 cm) (Figure 11). As a result, some genotypes (e.g. Mace, Suntop) that germinated later had delayed or even failed emergence (Figure 9c and d).
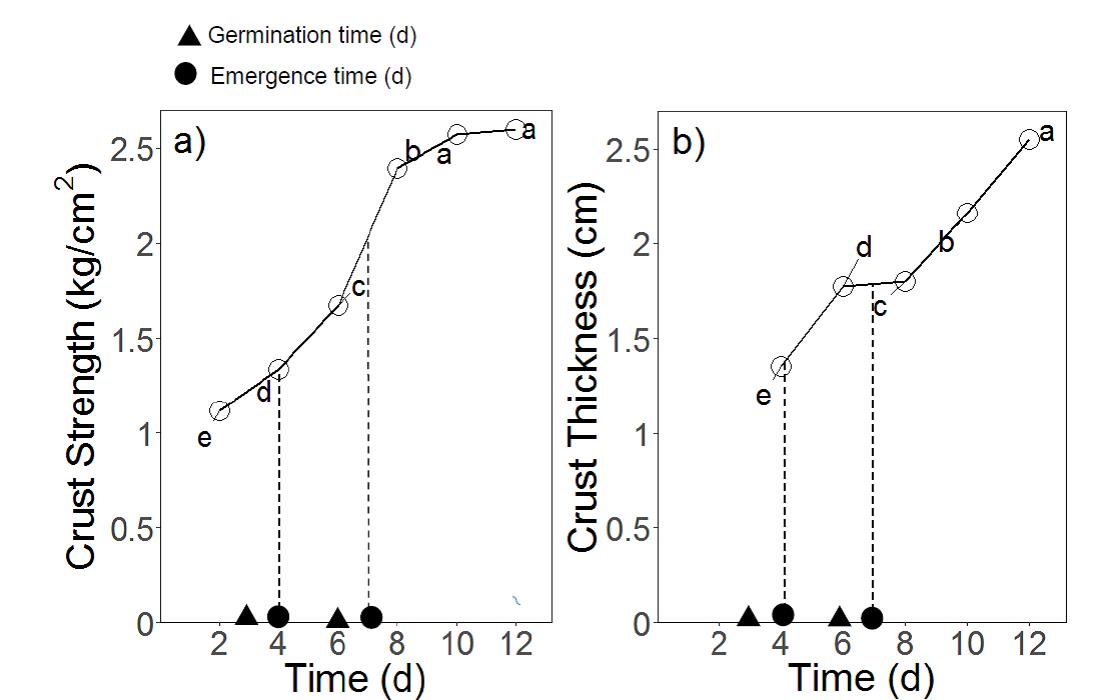
Figure 11. Development of (a) crust strength and (b) thickness along with time of strong crust (Experiment 2) and time of seed germination and seedling emergence along with time. Letters in figures present least significant difference (LSD) between times
Germination results of wheat genotypes suggest that early seed germination can be a driving factor to achieve higher emergence in the presence of a surface soil crust. These results have been supported by many studies that have found that in the presence of soil crusts, rapid germination can be beneficial for seedling emergence (Maguire 1962; Agarwal et al. 1986).
Higher seedling emergence force led to improved seedling emergence
Some seedlings were also able to emerge through soil crust by displacing the crust. Studies have reported that seedling emergence force can be a driving trait for seedling emergence in surface crusted soil (Gerard 1980) and variation in emergence force between species can occur (Sinha & Ghildyal 1979). As a result, the seedling emergence force of 16 wheat genotypes was examined to determine if variation between genotypes contributed to the differences in emergence observed (Experiment 3). At the time of emergence, if the seedling force (F2) is greater than the opposing force from the crust (F1), the seedling will be able to emerge. In Experiment 3, the maximum deflection of a beam at the time of emergence indicated the magnitude of seedling emergence force. Certain genotypes (e.g. Ventura, Spitfire) were able to exert higher emergence forces (F2 > F1) and emerge through the strong crust (Figure 9b). On the other hand, where F2<F1, genotypes failed to push through the crust and resulted in reduced or delayed emergence (Figure 9c and d).
In order to understand why differences in seedling emergence force existed between genotypes, the relationship between seedling emergence force and hypocotyl cross sectional area was examined. A positive correlation was observed between seedling emergence force and hypocotyl cross sectional area, which indicated that genotypes with thicker hypocotyl diameters are able to produce greater force (R2=0.54). This finding is supported by Gerard (1980) who found a significant linear relationship (R2 = 0.95) between emergence force and hypocotyl cross sectional area of cotton seedlings. The greater reserves in the larger hypocotyl might have the potential to produce a stronger seedling with a large emergence force (Sparks 2017).
Narrow root angle was associated with greater seedling emergence through surface soil crust
Significant differences between the seminal root angles were observed between the 16 wheat genotypes in Experiment 3 (Figure 6). This is similar to the results observed by other authors, who have found a significant variation in seminal root angles for different wheat genotypes (McDonald 2010; Christopher et al. 2013; Richard et al. 2015). For example, McDonald (2010) tested the seminal root angles of 52 wheat genotypes and found that seminal root angles ranged from 56° to 113°.
The root angle of wheat genotypes was found to be an important trait that influenced relative seedling emergence through strong sodic soil crust. A significant negative correlation between root angle and relative seedling emergence was reported in Experiment 4 (R2=0.89) indicating that genotypes with a narrower root angle achieved higher emergence through strong soil crust (Experiment 2). Narrower seminal root angles have also been observed to have a positive effect on wheat growth in other studies. Oyanagi (1994) reported that plants with narrow seminal roots angle tended to be more able to use water from the subsoil. Narrow root angles have been identified as proxy traits to select genotypes with drought tolerance for wheat breeding programs (Manschadi et al. 2008; Manschadi et al. 2010; Christopher et al. 2013).
The volumetric moisture content of the soil in the pots with strong crusts in the glasshouse pot experiments described in Experiment 2 varied with depth and time (Figure 12). In Experiment 2, the volumetric moisture content was similar throughout the profile at the beginning of the experiment from 3-11 cm depth (70% bulk density; 1 day). After sowing, the seed was covered with 0-3 cm depth of dry soil. After rainfall simulation, the pots were brought to field capacity. However, when drying started, the top soil formed a crust and dried more quickly than the soil at lower depth. As a result, soils below 5.5 cm had higher moisture content on day 6 and day 14 (Figure 12). Genotypes that had a maximum root depth <5.5 cm, which is more likely with a wider root angle, may thus have had a lower moisture uptake. However, genotypes that had greater root depth, which is more likely with a narrow root angle, may have been able to take up more soil moisture (Figure 9 a, b and c). With increased water uptake such seedlings could potentially have been able to maintain greater turgor pressure and exert more emergence force, leading to a higher proportion of emergence.
The seedling emergence of wheat genotypes through surface soil crust created in pot experiments (strong crust, Experiment 2) was correlated with both seedling emergence force and root angle. Given this, and the fact that these two traits were measured in two different media (i.e. soil versus solution), there is a need to investigate the impact of root angle on seedling emergence force of wheat genotypes when they are grown in the same growth medium. Investigation of seedling emergence force and root angle in soils with a wider range of ESP while measuring seedling emergence in crusted soils in the same experiment might also provide a clearer insight into the relationship between these traits.
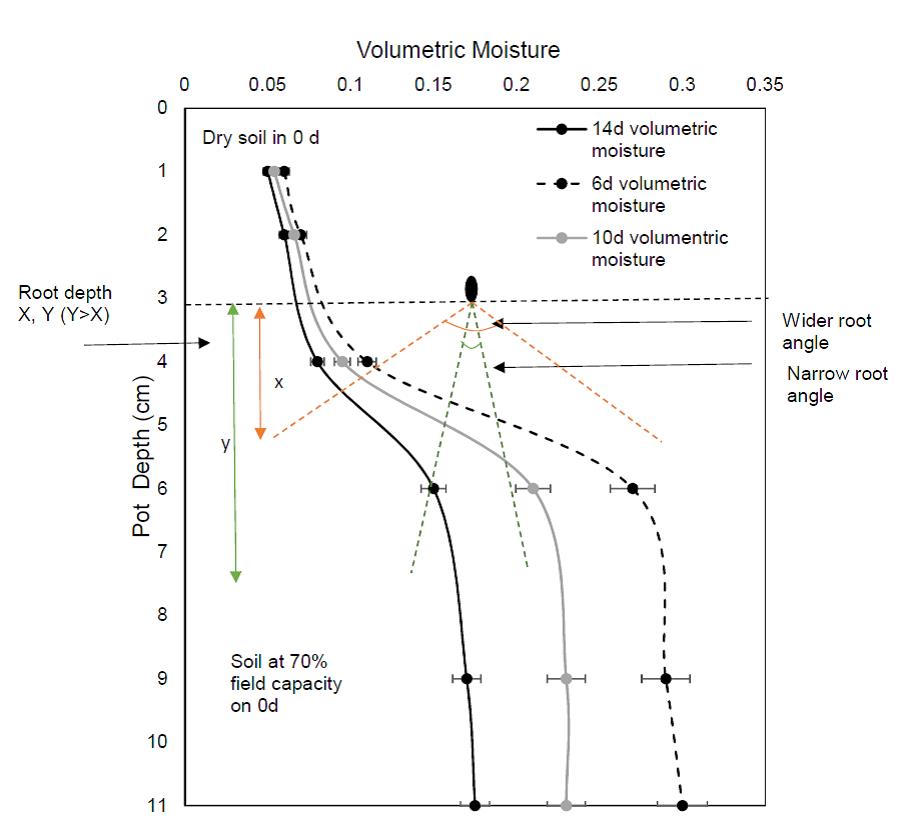
Figure 12. Volumetric moisture content of strong crust pots (Experiment 2) at three different times (6d, 10d and 14d) and a hypothetical presentation of rootangles in the soil profile
Traits to identify genotypes adapted to sodium toxicity and sodium induced calcium deficiency
Higher calcium concentrations in roots was correlated with a greater ability to maintain both root (R2=0.77, Figure 13) and shoot dry matter (R2=0.54). The observed variation in tolerance to the chemical constraints in soil solution might be governed by the calcium concentrations in roots of these genotypes in high sodic conditions (SAR 30 and above). Tolerant genotypes generally had higher calcium concentration in roots, whereas relatively susceptible genotypes exhibited sodium-induced calcium deficiency (at SAR 60). However, concentration of these nutrients in the youngest mature leaves was not a limiting factor below SAR 30 for calcium and SAR 60 for potassium for the more sensitive genotypes. Thus, potassium and calcium concentration in youngest mature leaves might not be a useful trait at common field levels of sodicity (SAR <30). However, calcium concentration in roots may still have potential to be used as an identifying trait of wheat genotypes tolerant to high sodium concentration and calcium deficiency in high SAR solution or in high ESP soils. These findings are supported by other researchers (Kurth et al. 1986; Shen et al. 1993; Reuter & Robinson 1997; Dang et al. 2016) who found positive correlation between calcium concentration in leaves and roots and shoot and root biomass.
However, seedling emergence of genotypes Baxter and EGA Gregory was affected due to the slight increase of SAR (0 to 10) which might cause yield differences in field soils with an equivalent soil ESP. This study only identified the traits considering the chemical constraints of sodic soil in solution culture and these do not necessarily correlate with tolerance to physical constraints of sodic soil, e.g. soil crust. The tolerance of these genotypes under field conditions requires further investigation.
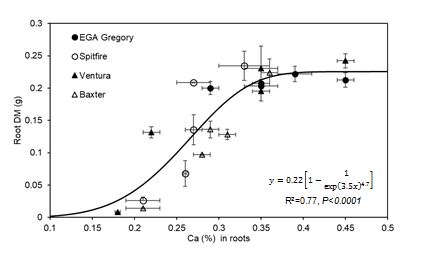
Figure 13. Relationship between root DM and concentrations of Ca (R2=0.77, P<0.001) in root tissues of four wheat genotypes in four replicates grown in five SAR treatments, Experiment 5
Conclusions
We have shown that genetic differences in the speed of seedling germination and emergence are important factors determining whether seedlings can emerge from crusting sodic soils. This study also indicated that wheat seedling emergence can be increased and the surface crusting effects of sodic soils on seedling emergence reduced by i) identifying and developing genotypes that exert more emerging force, and ii) developing genotypes that develop a thicker pushing hypocotyl under stress. Further study suggested that selection for narrow seminal root angle may potentially help to identify wheat genotypes that are better adapted to sodic soils.
We also found that at early growth stage, wheat tolerance to the chemical constraints of sodicity might be governed by the ability of genotypes to accumulate calcium in roots. Tolerant genotypes generally had higher calcium concentration in roots and whereas relatively more susceptible genotypes exhibited sodium-induced calcium deficiency (at SAR >30).
This study indicated that both seedling emergence force and root angle influenced seedling emergence in crusted sodic soils. It seems quite counter intuitive that root angle was more significant than emergence force in determining seedling emergence from crusted sodic soils. Given this, and the fact that these two traits were measured in two different media (i.e. soil versus solution), there is a need to investigate the impact of root angle on seedling emergence force of wheat genotypes when they are grown in the same growth medium. Investigation of seedling emergence force and root angle in soils with a wider range of ESP while measuring seedling emergence in crusted soils in the same experiment might also provide a clearer insight into the relationship between these traits.
References
Abu-Awwad AM & Kharabsheh AA (2000) Influence of supplemental irrigation and soil surface furrowing on barley yield in arid areas affected by surface crust, Journal of Arid Environment, 46(3): 227-37
Agarwal R, Jhorar B, Mati R, Raju P & Peacock J (1986) Effect of soil crusting on seedling emergence in sorghum genotypes, International Journal of Tropical Agriculture, 4:15-22
Asher C, Grundon N & Menzies N (2002) How to unravel and solve soil fertility problems, 83 vols., ACIAR Monograph, Canberra.
Awadhwal, NK & Thierstein, GE (1985) Soil crust and its impact on crop establishment: a review, Soil and Tillage Research, 5:289-302
Bouaziz, A & Bruckler, L (1989a) Modelling wheat seedling growth and emergence, II. Comparison with field experiments, Soil Science Society of America Journal, 53(6):1838-46
Bouaziz, A & Bruckler, L (1989b) Modelling wheat seedling growth and emergence: I. Seedling growth as affected by soil water potential, Soil Science Society of America Journal, 53(6): 1832-8
Braunack, MV & Dexter, AR (1988) The effect of aggregate size in the seedbed on surface crusting and growth and yield of wheat (triticum aestivum L., cv Halberd) under dryland condition, Soil and Tillage Research, 11(2):133-45
Cartwright ,CP, Beavan, MJ, Ruby, FM, De Morais, SM & Rose, AH (1986) Ethanol dissipates the proton-motive force across the plasma membrane of Saccharomyces cerevisiae, Microbiology, 132(2):369-377
Chaudhary, MR & Prihar, SS (1974) Root development and growth response of corn following mulching, cultivation or inter row compaction, Agronomy Journal, 66(3):350-5
Chhipa, B & Lal, P (1995) Na/K ratios as the basis of salt tolerance in wheat, Australian Journal of Agricultural Research, 46(3):533-9
Christopher, J, Christopher, M, Jennings, R, Jones, S, Fletcher, S, Borrell, A, Manschadi, AM, Jordan, D, Mace, E & Hammer, G (2013) QTL for root angle and number in a population developed from bread wheats (Triticum aestivum) with contrasting adaptation to water-limited environments', Theoretical and Applied Genetics, 126(6):1563-74
Daba, S (1998), 'Note on effects of soil surface crust on the grain yield of sorghum in the Sahel ', Field Crops Research, 61(3):193-9
Dalal, R, Blasi, M and So, H (2002) High sodium levels in subsoil limits yields and water use in marginal cropping areas, Canberra
Dang, YP, Christopher, J & Dalal, RC (2016) Genetic diversity in barley and wheat for tolerance to soil constraints, Agronomy Journal, 6(4):55
Dang, YP, Routley, R, Mcdonald, M, Dalal, RC, Singh, DK, Orange, D & Mann, M (1999) Subsoil constraints in Vertosols: crop water use, nutrient concentrations and grain yields of bread wheat, barley, chickpea and canola, Australian Journal of Agricultural Research, 57(9): 983-98
Dodd, K, Guppy, C, Lockwood, P & Rochester, I (2010) The effect of sodicity on cotton: Plant response to solutions containing high sodium concentrations, Plant and soil, 330(1): 239-49
Gerard, CJ (1980) Emergence force by cotton seedlings, Agronomy Journal, 72(3): 473-6
Hanks, R and Thorp, F (1956) Seedling emergence of wheat as related to soil moisture content, bulk density, oxygen diffusion rate, and crust strength, Soil Science Society of America Journal, 20(3): 307-10
ISO, IOfS 1994, Soil quality – Determination of specific electrical conductivity, ISO Standard No.11265, <https://www.iso.org/obp/ui/#iso:std:iso:11265:ed-1:v1:en>.
ISO, IOfS 2005, Soil quality – Determination of pH, ISO Standard No.10390, <https://www.iso.org/obp/ui/#iso:std:iso:10390:ed-2:v1:en>.
Kurth, E, Cramer, GR, Läuchli, A & Epstein, E (1986) Effects of NaCl and CaCl2 on cell enlargement and cell production in cotton roots, Plant Physiology, 82(4):1102-6
Maguire, JD (1962) Speed of germination—aid in selection and evaluation for seedling emergence and vigor, Crop Science, 2(2): 176-7
Manschadi, A, Christopher, J, DeVoil, P & Hammer, G (2006) The role of root architecture traits in adaptation of wheat to water-limited environments, Functional Plant Biology, 823-37
Manschadi, AM, Hammer, G, Christopher, J & DeVoil, P (2008) Genotypic variation in seedling root architectural traits and implications for drought adaptation in wheat (Triticum aestivum L)', Plant and Soil, 303:115-29
McDonald, G (2010) Food security from sustainable agriculture, in H Dove & R Culvenor (eds), Proceedings of the 15th Australian Agronomy Conference, Lincoln, New Zealand., coln, New Zealand
McKenzies, N, Coughlan, K & Cresswell, H (2002) Soil physical measurement and Interpretation for land evaluation, CSIRO Publishing, Collingwood, Victoria
Nakamoto, T & Oyanagi, A (1994) The direction of growth of seminal roots of triticum aestivum L and experimental modification thereof, Annals of Botany, 73:363-7
Orton, TG, Mallawaarachchi, T, Pringle, MJ, Menzies, NW, Dalal, RC, Kopittke, PM, Searle, R, Hochman, Z & Dang, YP (2018) Quantifying the economic impact of soil constraints on Australian agriculture: A case‐study of wheat, Land Degradation & Development, 29(11): 3866-75
Parker, JJ and Taylor, HM (1965) Soil strength and seedling emergence relations i. Soil type, moisture tension and planting depth effects, Agronomy Journal, 57:289-91
Porcelli, CA, Flavio, HGB & Raul, SL (1995) The K/Na and Ca/Na ratios and rapeseed yield, under soil salinity or sodicity, Plant and Soil, 175:251-5
Qadar, A (1995) Potassium and sodium contents of shoot and laminae of rice cultivars and their sodicity tolerance, Journal of Plant Nutrition, 18(11):2281-90
Rahi, TS, Singh, K & Singh, B (2013) Screening of sodicity tolerance in aloe vera: An industrial crop for utilization of sodic lands, Industrial Crops and Products, 44:528-33
Rengasamy, P (2002) Transient salinity and subsoil constraints to dryland farming in Australian sodic soils: an overview, Animal Production Science, 42(3): 351-61
Rengasamy, P and Olsson, KA (1991) Sodicity and soil structure, Australian Journal of Soil Research, 29:935-52
Reuter, D & Robinson, JB (1997) Plant Analysis: An Interpretation Manual, CSIRO publishing
Richard, CA, Hickey, LT, Fletcher, S, Jennings, R, Chenu, K & Christopher, JT (2015) High-throughput phenotyping of seminal root traits in wheat, Plant Methods, 11-3
Richards, L (1953) Modulus of Rupture as an Index of Crusting of Soil 1, Soil Science Society of America Journal, 17(4):321-3
Rochester, I (2010) Phosphorus and potassium nutrition of cotton: interaction with sodium, Crop and Pasture Science, 61: 821-34
Searle, R (2014) The Australian site data collation to support the global soil map, in HJ MN Arrouays D, de Forges ACR, McBratney A (ed.), Globa lSoil Map: Basis of The Global Spatial Soil Information System, CRC Press, The Netherlands
Shen, Z, Wang, J & Guan, H (1993) Effect of aluminium and calcium on growth of wheat seedlings and germination of seeds, Journal of Plant Nutrition, 16(11):2135-48
Sinha, AK & Ghildyal, BP (1979) Emergence force of crop seedlings, Plant and Soil, 51:153-6
Soman, P, Jayachandran, R & Peacock, JM (1992) Effect of soil crusting on seedling growth in contrasting sorghum lines, Experimental Agriculture, 28:49-55
Soman, P, Peacock, JM and Bidinger, FR (1984) A field technique to screen seedling emergence of pearl millet and sorghum through soil crusts, Experimental Agriculture, 20,:327-4
Sparks, D (2017) Advances in Agronomy, Elsevier Academic Press
Tucker, B (1954) The determination of exchangeable calcium and magnesium in carbonate soils, Australian Journal of Agricultural Research, 5(4): 706-15
Tucker, B (1985) A proposed new reagent for the measurement of cation exchange properties of carbonate soils', Soil Research, 23(4):633-42
Wright, D & Rajper, I (2000) An assessment of relative effects of adverse physical and chemical properties of sodic soil on the growth and yield of wheat (Triticum aestivum L.), Plant and Soil, 223: 277-85
Acknowledgements
The funding and support from The University of Queensland (UQ), Department of Agriculture and Fisheries Queensland, the Australian Grains Research and Development Corporation (GRDC) and the grain producers of Australia and support from the Australian Government Research Training Program Scholarship is acknowledged.
Contact details
Monia Anzooman
School of Agriculture and Food Sciences, Faculty of Science
University of Queensland, Australia
Tod Building, 203 Tor Street, Toowoomba, Qld-4350
Ph: 07 4529 1352
Mb: 0422 633 900
Email: m.anzooman@uq.edu.au
Varieties displaying this symbol beside them are protected under the Plant Breeders Rights Act 1994.
GRDC code: UA000159
GRDC Project Code: UA000159,
