The Indian Ocean Dipole revealed
The Indian Ocean Dipole revealed
Author: Dale Grey and Jemma Pearl (Agriculture Victoria) | Date: 18 Jul 2019
Take home messages
- Like El Nino and La Nina, the Indian Ocean Dipole (IOD) is a major contributor to climate variability in south east (SE) Australia.
- The IOD is a coupled phenomenon where the ocean and the atmosphere feed off each other’s behaviours.
- The IOD strongly effects the north west (NW) cloud band activity feeding in from over Broome.
- Positive IOD (+IOD) generally leads to drier winters and springs but there is the odd year that the opposite has happened.
- Negative IOD (-IOD) generally leads to wetter winters and springs but there is the odd year that the opposite has happened.
Introduction
The Indian Ocean Dipole (IOD) is a coupled ocean-atmosphere phenomenon that was first described in 1999 after Japanese and US researchers observed interesting things occurring in the Indian Ocean atmosphere and ocean during 1998. Research that ensued showed that the IOD is probably equally important as the El Nino Southern Oscillation (ENSO) as a climate driver for SE Australia.
Measurements of ocean temperatures go back with some reliability to 1877 to classify IOD events. Cores of large brain corals (used to characterise ocean behaviour), sampled off Indonesia give the ability to go back even further to about 400 years.
Like ENSO, small temperature changes in the order of +/- 1oC make large differences to the potential amount of evaporation off the oceans to Australia’s north west. Fundamentally what the IOD does is cool these waters down in positive IOD (+IOD) events or warm the waters up in negative IOD (-IOD) events. Cooler water means less evaporation to our NW and consequently, not as much moisture to draw on down to Victoria. Warmer water means more evaporation and more moisture to draw on down to Victoria.
The IOD is measured in two ‘boxes’ of ocean marked out off the coast of Kenya and Somalia in Africa and off the coast of Sumatra in Indonesia. A +IOD is when the water is cooler than normal off the coast of Sumatra and warmer than normal off the coast of Africa. A -IOD is when the water is warmer than normal off the coast of Sumatra and cooler than normal off the coast of Africa. Often these changes in surface temperatures (like ENSO events) are linked with cooler or warmer water to depth in the ocean underneath these regions. Cooler water at depth if disturbed at the surface is likely to upwell cooler water at the surface and vice versa for warmer water to depth.
Like ENSO the trade winds play a major role in instigating IOD events. In the Indian Ocean the trade winds come from a westerly direction (the opposite direction as per what occurs in the Pacific Ocean). Accentuations to the trade winds can help incite -IOD events as they push warmer water towards Australia’s NW and hold it there while they continue to blow stronger. Such bursts can occur with the Madden-Julian Oscillation. Disruptions to the trade winds can occur via tropical disturbances such as cyclones in the Indonesian region, reversing the trade winds with easterlies and allowing cooler water to up-well. Large high-pressure systems over Australia can also reverse or weaken the trade winds in the Timor Sea and cause upwelling of cooler water.
Many +IOD events have been coupled with El Ninos and -IODs with La Ninas. This is because what occurs in the western Pacific Ocean with ENSO can affect the IOD eastern box, via water passing through the small gaps between the islands of Sumatra, Java and Bali. This is another way IOD events can be roused.
The other phenomena in the atmosphere is the cloud response to these changes in ocean temperatures (Figure 1). In a +IOD there is usually a large patch of less cloud above the cooler water at Sumatra and a corresponding increase in cloud off the coast of Africa. During a -IOD the warmer water to the NW of Australia causes an increase in cloud and a corresponding lack of cloud off Africa (Figure 2). The +IOD is a very good inhibitor of NW cloud band activity travelling from Broome to Victoria. The -IOD is a very good accentuator of NW cloud band activity (Figure 3).
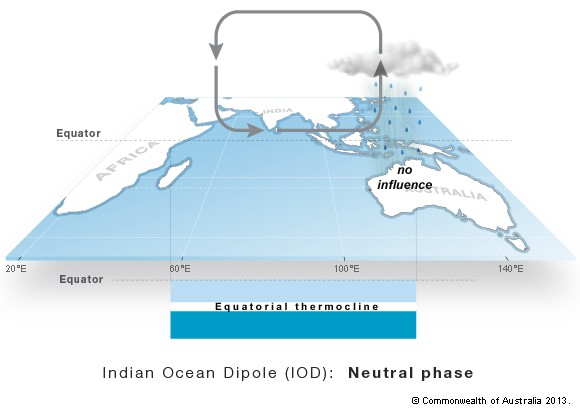
Figure 1. Normal wind and cloud patterns in the Indian Ocean.
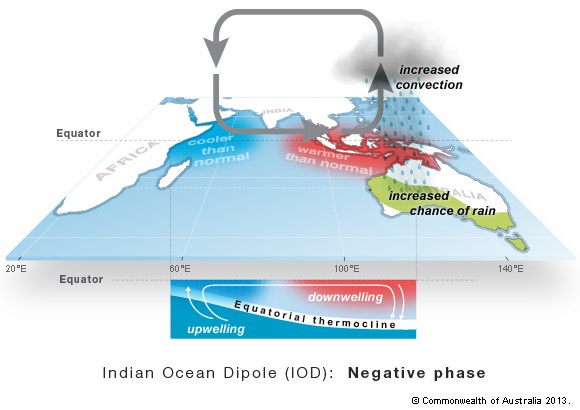
Figure 2. Wind, cloud and ocean temperatures in a negative IOD showing an enhanced Indian Ocean circulation.
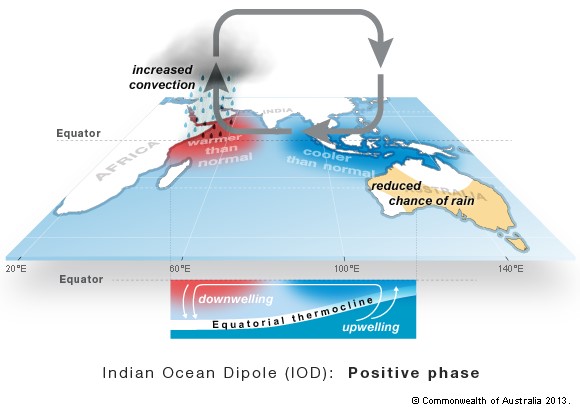
Figure 3. Wind, cloud and ocean temperatures in a positive IOD showing a reversed Indian Ocean circulation.
The IOD phenomenon can be active within the months of May to October. Due to the relative shallowness of the Indian Ocean the northern wet season or monsoon prevents an IOD forming any earlier than April. The onset of the northern wet season usually in November disrupts any IOD pattern that has set up and it quickly decays.
Models have about a month’s lead time where they can accurately predict the IOD. IODs can form in as little as one month due to the quick response of wind and ocean temperature in the Indian Ocean This is very different to ENSO in the Pacific, which happens over a much slower three-month period but has a much longer period of predictability.
In June 2019 we have seen the onset of a potential +IOD pattern. Large high-pressure systems over the Great Australian Bight stirred up easterly winds in the Timor Sea that resulted in cooler water upwelling and a move of these waters into the Java and Sumatran region. Much warmer water exists off the coast of Africa as well. The cloud patterns have quickly responded with less cloud off Sumatra and greater cloud off Africa. Large high-pressure systems, typical of +IOD are sitting over Victoria but at this stage have been far enough north to let some fronts through. Most models predict a +IOD to continue for the next three months and greater probability of lower rainfall. Things to take into consideration for planning in the coming months.
Historically at Elmore, the past 21 +IOD events have led to increased chances of lower rainfall in winter and spring (Figure 4). Two thirds of +IOD years have been drier springs, but only about 25% of all +IOD years have had agronomically terrible consequences. Occasionally wetter or average years have occurred, however in recent times not many of these have occurred. We live in hope that 2019 may be one such year!
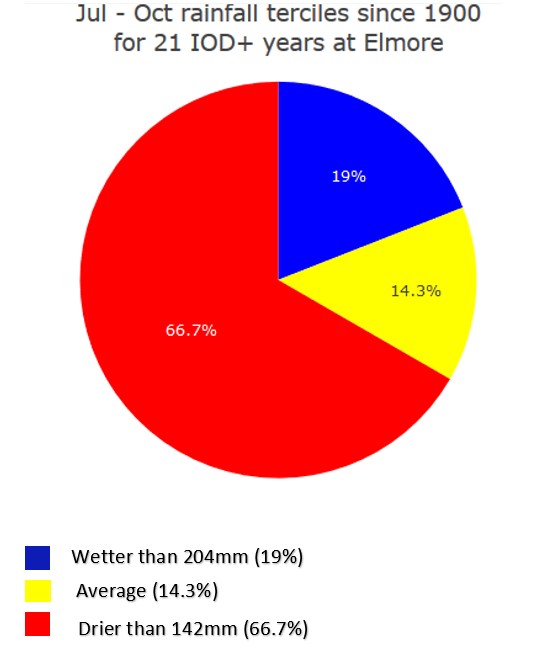
Figure 4. Chances for wetter, average and drier July-October rainfall at Elmore in +IOD years.
Useful resources
Agriculture Victoria weather and climate newsletters
Acknowledgements
The research undertaken as part of this project is made possible by the significant contributions of growers through both trial cooperation and the support of the GRDC, the author would like to thank them for their continued support.
Contact details
Dale Grey
PO Box 3100 Bendigo DC 3554
(03) 5430 4444
dale.grey@ecodev.vic.gov.au
@eladyerg