5 years of Nitrogen research – Have we got the system right ?
Author: Richard Daniel, Rachel Norton, Anthony Mitchell, Linda Bailey, Denielle Kilby, Branko Duric and Lawrie Price, Northern Grower Alliance | Date: 01 Aug 2019
Take home messages
- Over the 14 trials from 2014 to 2017, the efficiency of nitrogen (N) grain recovery from soil N was ~4 times that of fertiliser N that was applied in the year of cropping
- Maintaining high soil N levels is critical for cereal production efficiency due to the poor fertiliser N grain recovery
- Testing of grain, stubble and soil at harvest was able to account for a mean level of ~79% of the applied fertiliser N over 23 comparisons, however in 4 of the 23 comparisons, testing only accounted for 30-50% applied fertiliser N
- The majority of the additional N at harvest was recovered in the soil and averaged ~65% of the applied quantity
- The slow and shallow fertiliser N movement in soil is likely to be impacting on grain recovery efficiency
- Strategies to get fertiliser N deeper, more quickly, may provide useful efficiencies in uptake and reduce potential losses
- Strategies that can improve N contribution from the legume phase will be highly productive
- Fallow N fertiliser applications are likely to provide a benefit over at planting application in years with low in-crop rainfall.
Background
Northern Grower Alliance (NGA) have been heavily involved in nitrogen (N) management trials in wheat since 2012. The focus has always been on methods to improve the efficiency and economics of N nutrition in wheat but the specific focus shifted over time:
- 2012-2014: Economics and fit of late application
- 2014-2018: Impact of application method and timing.
In addition to generating answers on the two main themes, a large body of data had been created on N uptake efficiency together with measurements of soil movement and fate of N.
Rather than focusing on individual trial results, this paper focuses on N management ‘system implications’ and challenges whether we really have got the system right.
Grain nitrogen recovery
Grain N recovery in wheat has been calculated in trials from 14 individual locations conducted during the 2014-2017 seasons. A wide range of production conditions have been experienced with yields ranging from ~1 to 5t/ha. Three steps were taken in calculating the grain N recovery from fertiliser:
- Grain N recovery for each treatment was calculated as yield (kg/ha) x % protein/100 x 0.175
- ‘Net’ grain N recovery was then calculated by deducting the grain N recovery in the untreated (unfertilised treatment)
- % grain N recovery was calculated by dividing the net recovery by the amount of N applied
Table 1. % grain N recovery from urea applications in 15 trials, 2014-2017
Season | 2014 | 2015 | 2016 | 2017 | ||||
Method/ timing | All IBS | Drilled in fallow/IBS/ PSPE | Incorporated in fallow/IBS/ PSPE | Spread in fallow x 2/PSPE | ||||
Variety(s) | EGA Gregory | EGA Gregory | Suntop | Lancer, Suntop & 5 other varieties | ||||
# of trials | 4 | 5 | 3 | 3 | ||||
| Mean | Range | Mean | Range | Mean | Range | Mean | Range |
Urea 50 kg N/ha | 21% | 13-34% | 30% | <0-45% | 23% | 16-27% | 15% | 10-19% |
Urea 100 kg N/ha | 16% | 12-26% | 19% | <0-31% | 18% | 12-23% | 9% | 7-12% |
Urea 200 kg N/ha | 9% | 5-17% | 11% | <0-17% | 10% | 8-12% | 5% | 3-6% |
NB Data from two trials at Billa Billa 2017 site included. IBS = Incorporated By Sowing, PSPE = Spread Post Sowing Pre Emergent. Recovery data for each urea rate was generated from one application timing in 2014 but 3 timings in all 2015-2017 trials.
Key points
- As expected, the % grain N recovery reduces as the N application rate increases.
- Trials were conducted over a range of varieties with no indication of a consistent difference in response to fertiliser N rate between varieties.
- Most applications were incorporated but some were surface spread and not incorporated.
- No indication of difference between incorporated versus spread but not incorporated.
- Recoveries appeared lower in 2017 – low in-crop rain, low yields with reduced N responses.
Grain N recovery from available soil N was also calculated for all trials in 2016 and 2017. Soil N was measured to 120 cm at both planting and harvest. (Data from 2014 and 2015 was not included as soil N was only assessed during the fallow for site selection and often to 60 cm depth). Two steps were taken in calculating the grain N recovery from soil N:
- The quantity of soil N ‘used’ was calculated by the amount in the soil at planting minus the amount at harvest.
- % grain N recovery was calculated by dividing the untreated grain N recovery by the amount of soil N used.
NB: an estimate of the quantity of N mineralised during the cropping season was not included for any calculation but was assumed to be consistent for all treatments. Inclusion of an estimate of mineralised N would lower the % grain recovery for both soil and fertiliser but is unlikely to change the relative differences.
Table 2. % grain N recovery from soil only, fertiliser only or combined soil and fertiliser application in 6 trials 2016-2017
Season | 2016 | 2017 | ||
Number of trials | 3 | 3 | ||
N ‘source’ | Mean | Range | Mean | Range |
Soil only | 98% | 73-112% | 62% | 55-70% |
Fertiliser only | 23% | 16-27% | 15% | 10-19% |
Soil & fertiliser | 62% | 54-74% | 40% | 33-46% |
NB: The mean and range used for ‘fertiliser only’ is for the most efficient rate (50 kg N/ha) from Table 1.
Key points
- The % grain N recovery when calculated on combined soil and fertiliser quantities is in line with industry convention (~40-60% N efficiency depending on year).
- However, each kg of soil N was ~4 times more efficient (range 3-6 times) in producing yield and protein than each kg of fertiliser N – even when fertiliser was applied at the most efficient rate.
Situations of concern
N fertiliser recommendations are generally based on setting a target for yield and protein and then ensuring a quantity of soil and fertiliser N that is generally double that target (i.e. working on a 40-60% grain N recovery efficiency). This approach is generally effective, but on the basis of these results, will struggle when soil N levels become low. Common examples would be:
- Soil N levels are heavily depleted following an unexpectedly very high yielding crop (e.g. in 2012); and
- Following a very dry fallow where mineralisation is greatly reduced.
In these situations, N fertiliser application rates may need to be increased to commercially impractical and uneconomic levels to achieve the expected outcome. In some situations with very low starting N quantities, a change from cereal to a legume may be a much better option.
Why is the fertiliser efficiency so low in the year of cropping?
Movement of N
One possible reason for the low observed efficiency of grain N recovery from fertiliser applied in the year of cropping may be the amount and speed of N movement in soil. During 2015-2017 a primary objective has been to evaluate the impact of N application into a dry soil profile during the fallow. The hypothesis was that the applied N would move further with fallow rain events so that N would be deeper and more uniformly distributed by planting.
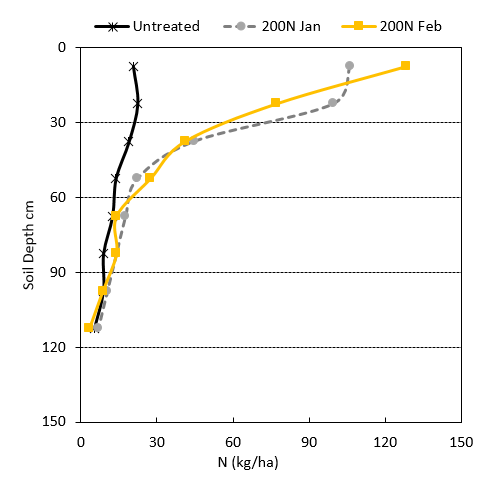
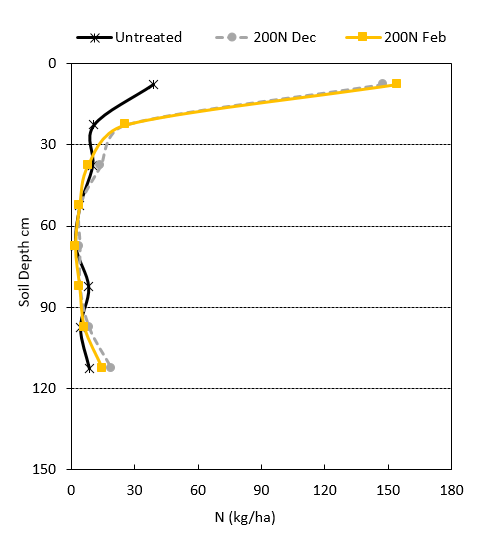
Figures 1 and 2 are indicative of the results achieved following N application during the fallow in 2015/16 and 2016/17.
Figure 1. Soil distribution of N at Mullaley at planting (May 2017) following application of urea in January or February 2017. 175mm of rain was recorded between the January application and planting. 140mm of rain was recorded between the February application and planting.
(NB: Both N applications were spread and not incorporated. Sampling method - 6 individual 0-120cm depth cores taken per plot. Samples from each depth were bulked with a single sub sample taken for analysis. Not replicated.)
Figure 2. Soil distribution of N at Tulloona at planting (June 2016) following application of urea in December 2015 or February 2016. 225mm of rain was recorded between the December application (spread and incorporated) and planting. 65mm of rain was recorded between the February application (spread and not incorporated) and planting.
(NB: Sampling method - 6 individual 0-120cm depth cores taken per plot. Samples from each depth were bulked with a single sub sample taken for analysis. Not replicated.)
Key points
- Even in a dry soil profile, the movement of N in these trials (predominantly vertosol soil types) was slower and shallower than expected.
- The majority of N applied in fallow (either surface spread or incorporated to depths of ~3-5cm) was still in the 0-15cm soil segment at planting.
- Sampling in smaller increments e.g. 5cm may reveal clearer differences in movement between application timings.
Implications of reduced N movement
The slower observed movement of N in soil may explain why in 10 of the 11 application timing trials there has not been a significant advantage from fallow N application compared to N applied at planting - as long as there were reasonable levels of in-crop rain. The 2017 season was however characterised by useful fallow rains (particularly in March) but with very low levels of in-crop rain (particularly June-September).
Billa Billa 2017
The site at Billa Billa in 2017 was the first to show a significant benefit from both fallow N applications compared to the same quantity applied at planting (or in-crop).
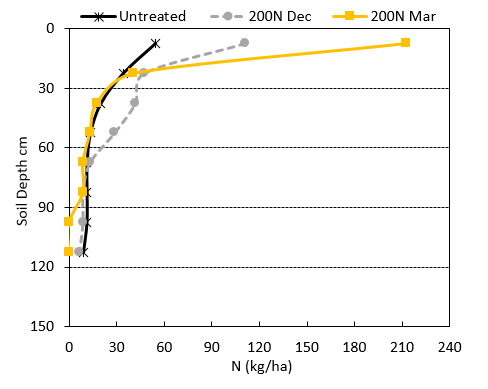
Figure 3 shows the distribution of soil N at planting from fallow application with the majority of N in the 0-15cm depth for both December and March 2017 applications, but with apparent increased movement from the December application. This site had the deepest movement of N recorded in any of the trials in 2016 or 2017.
Figure 3. Soil distribution of N at Billa Billa at planting (May 2017) following application of urea in December 2016 or March 2017. 279mm of rain was recorded between the December application and planting. 154mm of rain was recorded between the March application and planting.
(NB: Both applications spread and not incorporated. Sampling method - 6 individual 0-120cm depth cores taken per plot. Samples from each depth were bulked with a single sub sample taken for analysis. Not replicated.)
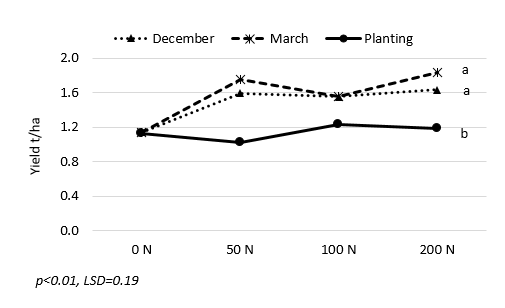
Figure 4 shows the yield results (variety Lancer) at this site. There was no significant N response from fertiliser applied at planting (or in-crop) at this site, with only 71mm of in-crop rain received between planting and the end of September. However applications in December or March provided a significant increase in both yield and protein (not presented).
Figure 4. Effect of application timing and N rate on yield, Billa Billa 2017
(Treatments that share the same letter are not significantly different at P=0.05. All N rates were spread only)
Table 3 shows the distribution of N (in excess of untreated levels) by soil depth at harvest and the quantities of rainfall recorded between application and planting or harvest.
Table 3. Depth distribution of soil N at harvest (in excess of untreated levels) from 200 kg N/ha applications, Billa Billa November 2017
| December spread | March spread | Planting PSPE | In-crop Spread |
Rainfall - application to planting | 279mm | 154mm | - | - |
Rainfall - application to harvest | 465mm | 340mm | 186mm | 160mm |
Soil depth | Additional soil N kg/ha v untreated at harvest | |||
0-15cm | 32 | 70 | 36 | 82 |
15-30cm | 48 | 48 | 4 | 2 |
30-45cm | 35 | 11 | 4 | 4 |
45-60cm | 20 | 7 | 4 | 4 |
NB There was no indication of any movement of fertiliser applied N deeper than 60cm. Soil recovery from PSPE application was very low with only 1mm of rain recorded 4 days after application, followed by 9mm at 37-38 days after application.
Key points
- Although the majority of N from December or March application was still in the 0-15cm zone at planting (Figure 3), the yield and protein results indicate it had moved deep enough to be available to the crop in a season with very low in-crop rainfall.
- Increased benefit from fallow N application compared to application at planting are likely in situations with good levels of fallow rainfall but followed by low levels of in-crop rainfall.
- The majority of excess N applied in December was recovered in the top 45cm at harvest after a total of 465mm of rainfall.
- The majority of N applied in March was recovered in the top 30cm at harvest after a total of 340mm of rainfall.
NB Soil recovery from the PSPE application was very low in this trial with the first useful rainfall (9mm) 37 days after application. Unfortunately soil sampling was not planned/conducted in plots where N was incorporated by sowing for comparison.
How much nitrogen was actually recovered at harvest?
Assessment of the fertiliser N fate (in grain, soil and stubble) was conducted in 2015, 2016 and 2017 but with no attempt to estimate the residual N in the root system. Table 4 shows the mean quantities of N, in excess of the level where no fertiliser N was added. In 2015, results were only assessed for 200 kg N/ha applied and incorporated by sowing. Results in 2016 and 2017 are a mean of 4 application timings. In 2016, 3 of the 4 applications were spread and not incorporated with all applications spread and not incorporated in 2017.
Table 4. Mean levels of N (kg N/ha) in grain, stubble and soil samples at harvest following application of 200 kg N/ha, in excess of untreated levels, 8 trials 2015-2017
Season | 2015 | 2016 | 2017 | |||
Number of trials | 3 | 3 | 2 | |||
| Mean | Range | Mean | Range | Mean | Range |
Grain | 0 | -16-21 | 20 | 5-39 | 8 | 3-13 |
Stubble | 17 | 6-48 | 17 | 3-43 | 8 | 1-26 |
Soil | 79 | 58-102 | 136 | 50-221 | 128 | 54-234 |
Total | 96 | 85-134 | 174 | 66-263 | 143 | 60-258 |
Key points
- Over 23 individual application timing comparisons, ~79% of the applied rate was recovered between grain, stubble and soil.
- On average ~21% of the applied N was not able to be accounted for in grain, stubble or soil.
- The majority of additional N was recovered in the soil and on average accounted for 65% of the applied N.
- In 18 of 23 comparisons, testing accounted for more than 60% of the applied N.
- The lowest recoveries were from 2 sites in 2015 where N was incorporated by sowing – both 40-50%, one site in 2016 from spreading on wet soil at GS30 – 30-40% and one in 2017 from application PSPE – 30-40%.
- Grain recovery is likely to be the most accurate measure with stubble and soil more variable due to issues such as sampling and uniformity of spreading.
Was nitrogen still available for the following crop?
Two of the trial sites from 2016 (Tulloona and Macalister) were planted to winter crop in 2017 and were monitored for response and benefits in the ‘year 2’ crop. Table 5 shows the soil test results taken at planting and harvest in year 2.
Table 5. Soil N levels (kg N/ha) at Tulloona and Macalister following application of N at different rates applied at wheat planting in 2016
Tulloona | Macalister | |||
N rate at sowing in 2016 | April 2017 | Oct 2017 | Aug 2017 | Dec 2017 |
Untreated | 53 b | 29 b | 78 c | 44 b |
50 kg N/ha IBS | 76 b | 32 b | 99 bc | 46 b |
100 kg N/ha IBS | 71 b | 21 b | 131 b | 80 b |
200 kg N/ha IBS | 162 a | 122 a | 237 a | 178 a |
P value | <.01 | .04 | <.01 | <.01 |
LSD | 33 | 75 | 39 | 62 |
NB Sampling method - 4 individual 0-120cm depth cores taken per plot. Samples were separated into 0-30 and 30-90cm intervals with each depth bulked and a single sub sample taken for analysis. 4 replicates sampled in each treatment
Key points
- The large LSD figures (least significant differences) highlight the variability that can occur with soil testing and that the number of soil samples collected should have been larger to account for this.
- While acknowledging the above, soil testing ~12 months after N application (April and August 2017) showed significantly increased soil N levels in the 200 kg N/ha treatments (109-159 kg N/ha additional compared to untreated).
- Differences were less clear from the 50-100 kg N/ha rates applied in 2016.
- The lowest soil N levels at planting in 2017 were from the untreated samples.
- At harvest of the year 2 crops, there was still an additional ~90-130 kg N/ha of soil N in plots that had received 200 kg N/ha in 2016.
NB At the Tulloona site, ~60 % of the additional soil N was still found in the top 45cm with 45% found between 15 and 45cm. At the Macalister site, ~49 % of the additional soil N was still found in the top 45cm with 31% found between 15 and 45cm.
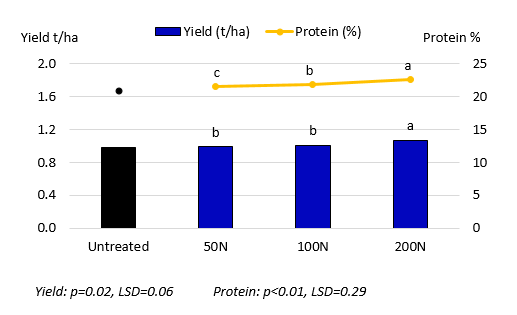
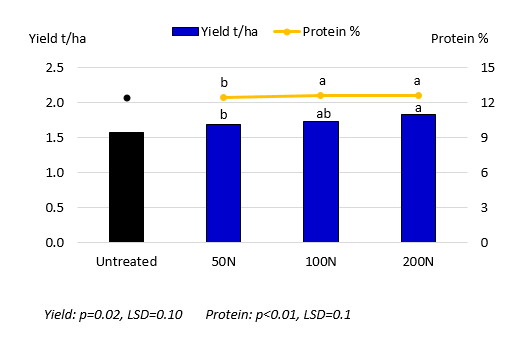
The Tulloona site was commercially planted to chickpeas and the Macalister site was planted to wheat. At Tulloona, at the end of September it was visually apparent that all plots that had received the 200 kg N/ha rate in year 1 were ‘greener’ than the remaining plots and the trial warranted harvest. Previous wheat results had indicated the most consistent N response was in grain protein, so yield and grain quality were assessed at both sites. Figures 5 and 6 show the yield and protein responses in year 2.
Figure 5. 2nd year impact of N rate - chickpeas, Tulloona 2017
(Treatments that share the same letter, within an assessment, are not significantly different at P=0.05. Results for each N rate are from a factorial of 3 timings x 2 varieties. Untreated not analysed and included for comparison only)
Figure 6. 2nd year impact of N rate - wheat, Macalister 2017
(Treatments that share the same letter, within an assessment, are not significantly different at P=0.05. Results for each N rate are from a factorial of 3 timings x 2 varieties. Untreated not analysed and included for comparison only)
Key points
- Significant increases in both yield and grain protein were recorded in year 2 from the 200 kg N/ha rates applied in 2016 compared to the 50 kg N/ha rate at both sites.
- Although soil testing did not show a significant difference in soil N between the 50 and 100 kg N/ha rates, there was a significant increase in grain protein recorded in both crops from the 100 kg N/ha treatments compared to the 50 kg N/ha rate.
Economic impact
Tulloona
- Wheat 2016: all nitrogen rates achieved at least break even in 2016 due to yield benefits (0.7-1.2t/ha) combined with increased grain quality in a ~4t/ha yielding situation
- Chickpeas 2017: although grain protein was increased by all rates of N applied in 2016, only the 200 kg N/ha rate resulted in a significant yield increase. This equated to an extra $60/ha net benefit
- Soil testing indicates an extra 90 kg N/ha is still available to benefit year 3 cropping from the 200kg N/ha applications.
Macalister
- Wheat 2016: there was no yield impact from applied N but increases in protein of ~2-3%. There was no net benefit with mean yields ~2.0-2.5t/ha
- Wheat 2017: significant yield increases (0.1-0.25t/ha) were recorded from all 2016 rates compared to the Untreated in an ~1.6t/ha crop. Despite significantly increased protein from the 100 and 200 kg N/ha rates, all grain was H2 quality. Net benefits of $32-$73/ha were achieved in ‘crop 2’
- The 50 kg N/ha rate was the only one to achieve a net benefit over the first 2 years of cropping (~$20/ha)
- Sorghum 2018/19: significant yield increases (~0.4-0.7t/ha) from the 100 and 200 kg N/ha rates compared to the Untreated in an ~5.7t/ha crop. Significantly increased protein from the 100 and 200 kg N/ha rates compared to the Untreated (~0.4-0.6%). Net benefits of $80-$120/ha were achieved in ‘crop 3’
- Wheat 2020: no yield impact from the applied N in an ~1.4t/ha crop. Significantly increased protein from the 100 and 200 kg N/ha rates compared to the Untreated (~0.2-0.4%). No net benefit as all grain was classified as HPS1 in ‘crop 4’
- Soil testing in October 2021 showed an extra 50-70 kg N/ha was still available to benefit the sorghum crop in 2021/22 (‘crop 5’) from the original 200 kg N/ha applications in 2016.
Conclusions
This series of trials over 4 cropping seasons and 14 trial locations has provided results that question some of our current management practices.
- It has supported the general N grain recovery ‘rule’ applied in N budgeting of 40-60% of available soil and fertiliser N but highlighted a large difference in efficiency between the two sources
- It has highlighted the poor efficiency of fertiliser N grain recovery in the year of application with mean levels of ~15-20% applied N recovered in grain at common commercial rates (50 -100 kg N/ha)
- The relatively shallow and slow movement of the applied N is likely to be a major cause for this inefficiency
- Consider non-cereal options in paddocks with very low soil N levels
- Testing at harvest of grain, stubble and soil indicated nearly 80% of the applied N could be accounted for, although in a small number of situations this level dropped to as low as 30-50%
- There was no clear pattern of difference between urea surface spread or spread and shallow incorporated in terms of N recovery. They were both equally good (or bad)
- Initial assessment of response in 2nd year crops was encouraging with ~50% of the initial 200 kg N/ha rate still available for crop response in year 3
- At one of the two sites monitored in year 2, all of the net benefit from fertiliser occurred in year 2
- The errors associated with soil testing (e.g. core number, uniformity of sample mixing and sub sampling) make ‘precise’ recommendations on fertiliser N levels difficult.
Key industry challenges
- Ensure soil N levels do not continue to decline as the required levels of fertiliser N in the year of cropping would rapidly become uneconomic and impractical and cereal production less efficient
- We need to identify methods to get fertiliser N deeper in the profile, more quickly, to improve availability and efficiency
- Identify and if possible, manage the unaccounted losses from fertiliser N application.
Where to next?
The results from this work indicate we still have much to learn, or at least to refine, with the management of our most important and best understood nutrient for cereal production. Any practices that can improve the efficiency of N accumulation from the legume phase are going to be exceedingly valuable, together with methods to increase the efficiency of fertiliser N use in the year of cropping.
Acknowledgements
The research undertaken as part of this project is made possible by the significant contributions of growers through both trial cooperation and the support of the GRDC, the author would like to thank them for their continued support.
NGA would particularly like to acknowledge the assistance from our trial co-operators during this series of trials: Scott Ferguson, Jason Schelberg, Lee Maxwell, The Frater Family, Drew Penberthy, Michael Leddingham, Hugh Ball, Simon Doolin, George Picton, Peter Butler and Anthony Martin, together with Kalyx staff for trial planting, maintenance and harvest. In addition we would like to thank AGT and Pacific Seeds for seed supply.
Contact details
Richard Daniel
Northern Grower Alliance
Ph: 07 4639 5344
Email: richard.daniel@nga.org.au
Varieties displaying this symbol beside them are protected under the Plant Breeders Rights Act 1994
GRDC Project Code: NGA00004,
Was this page helpful?
YOUR FEEDBACK

