Sowing sorghum super early – after two years is it still a good idea?
Sowing sorghum super early – after two years is it still a good idea?
Author: Loretta Serafin (NSW DPI), Mark Hellyer (NSW DPI), Andrew Bishop (NSW DPI), Daniel Rodriguez (QAAFI), Joe Eyre (QAAFI) and Darren Aisthorpe (QDAF) | Date: 13 Aug 2019
Take home messages
- Sowing time for sorghum can be moved earlier than the traditional 16 – 18 °C soil temperature without negatively impacting on crop establishment and grain yield
- Defining the minimum soil temperature required for establishment is still tenuous as temperatures are variable in the late winter/ early spring and the risk of mild and severe frosts are still present. However, a minimum of 12° C seems to be the current limit from these experiments to ensure even and timely establishment
- Sowing earlier at both Moree and Breeza moved the flowering window forward and, in both sites, resulted in improved grain yields through reduced exposure to heat and moisture stress during flowering and grain filling.
Introduction
The traditional sowing window for grain sorghum in northern NSW has been challenged in recent years by increasing climate variability predisposing the crop to heat and moisture stress during the critical stages of flowering and grain fill. The impacts have been devastating, resulting in reduced yields and grain quality and even crop failure in some instances. This is ultimately costing grower’s money in lost returns.
Similar to the changes we have seen in the adoption of early sowing time with wheat, growers are making incremental changes to the time of sowing with their sorghum crops. Traditionally, the recommendation was to delay sowing until the frost risk period had past and when soil temperatures at sowing depth reached 16-18 °C and were rising, with measurements taken at 8 am for three days. However, in recent years, particularly last season, many crops were sown when soil temperatures were closer to 14 °C, especially in the Moree region where a missed winter crop and continuing dry conditions were driving the need for cash flow.
Since 2017, the GRDC, University of Queensland and NSW DPI have partnered in a research program to test the boundaries of sowing sorghum earlier and measuring the impacts on plant establishment, crop development, grain yield and quality. Research trials have been conducted from Emerald (with QDAF joining the team this season), Southern Qld, Moree and the Liverpool Plains.
Experiments were designed to develop a data set to define how early growers can plant sorghum in each of these environments and what are the potential benefits and risks from adopting this strategy of “winter sown sorghum”. In this study we considered effects on the sorghum crop as well as follow-on impacts on crop rotation intensity and the possibility of ratooned sorghum.
In 2017-18 three sites were conducted in northern NSW at Mallawa, Gurley and Breeza. During 2018-19 two sites were conducted at Moree and Breeza; with the Breeza site containing both a dryland and a supplementary irrigated trial. Only the results from the two dryland trials in 2018-19 are reported here.
Trial details 2018-2019
Table 1. Site characteristics for two sorghum time of sowing trials sown during the 2018/19 season
Time of sowing (TOS) | Sowing date | Soil temp. at | Soil water## at sowing (mm) | In-crop rainfall (mm) | Irrigation (mm) |
|---|---|---|---|---|---|
“Ponjola” Moree, NSW (dryland) | |||||
1 | 7 & 8 Aug | 12.3 | 97.5 | 199.7 | 33* |
2 | 11 & 12 Sept | 17.1 | 112.8 | 153.2 | - |
3 | 27 Sept | 18.9 | 115.7 | 153.2 | - |
“LPFS” Breeza, NSW (dryland) | |||||
1 | 6 Sept | 11.2 | Pre-irrigated | 222.9 | - |
2 | 17 Sept | 10.3 | Pre-irrigated | 222.9 | - |
3 | 23 Oct | 18.8 | Pre-irrigated | 170 | - |
#Average soil temperature (°C) at sowing depth for seven days after sowing
##Soil water (mm, 0-1.2 m) at the time of sowing
*33 mm of water was applied post sowing on the 14th August using dripper lines to ensure even establishment due to dry seedbed conditions.
Table 2. Description of treatments (sowing dates, target populations and hybrids)
Time of sowing (TOS) | Sowing date | Target plant population (pl/m2) | Hybrids |
|---|---|---|---|
“Ponjola” Moree, NSW (dryland) | |||
1 | 7 Aug | 3, 6, 9, 12 | MR Buster, MR Apollo, MR Taurus, Agitator, Cracka, HGS114, A66, G33 |
2 | 11 & 12 Sept | ||
3 | 27 Sept | ||
“LPFS” Breeza, NSW (dryland) | |||
1 | 6 Sept | 3,6,9,12 | MR Buster, MR Apollo, Agitator,Cracka, HGS114, G33 |
2 | 17 Sept | ||
3 | 23 Oct | ||
Results and discussion
“Ponjola” Moree
Plant establishment
The first time of sowing (TOS) occurred under dry seedbed conditions, so to ensure even establishment at the desired soil temperature, a total of 33 mm of water was applied one-week post sowing using dripper lines. The first establishment counts which recorded plants emerging were taken on the 31st August, 3 weeks post sowing and 2 weeks post watering. Plants emerged slower under TOS1, than TOS 2 and TOS 3 which had more even and quicker establishment.
There was no impact of time of sowing on any of the final established plant populations except the 120,000 plants/ha treatment which established more plants as the TOS became later (Table 3).
Table 3. Impact of time of sowing on plant establishment at “Ponjola”
Target plant population (plants/m2) | TOS 1 | TOS 2 | TOS 3 |
|---|---|---|---|
3 | 2.44 f | 2.63 f | 2.77 f |
6 | 5.22 e | 5.23 e | 5.34 e |
9 | 7.60 d | 8.32 cd | 8.35 cd |
12 | 8.94 c | 10.80 b | 11.83 a |
L.s.d: 1.02, P<0.05 | |||
There was an interaction between TOS and hybrid. Comparing across times of sowing, Agitator had the poorest establishment at nearly all TOS. TOS 2 and TOS 3 had improved establishment for nearly all hybrids when compared to TOS 1 but the differences were not always statistically significant (data not shown).
Impacts of time of sowing and plant population on crop development
Increasing plant population reduced the number of fertile tillers produced as did delaying the TOS. Averaged across populations and hybrids; TOS 1 resulted in more fertile tillers, 4.34/ m2 compared to 2.88 / m2 tillers for TOS 2 and 1.78 / m2 for TOS 3. Hybrids also produced different numbers of tillers with Agitator, which had the lowest plant establishment, producing the highest number of fertile tillers. In contrast MR-Apollo had the lowest number of fertile tillers (data not shown).
Time of sowing, hybrid and plant population all impacted on the number of heads produced. More heads were produced from TOS 1 than TOS 3. The differences between TOS 1 and TOS 2 were not significant. As plant population increased so did the number of primary heads. Hybrids varied in their number of heads produced. The lowest numbers of primary heads were produced by MR-Apollo and Agitator (data not shown).
Did sowing earlier impact on flowering?
There was a significant impact of sowing time, population and hybrid on the number of days taken to reach 50% flowering.
Sowing timing had a significant impact on days to flowering; the earlier we sowed, the longer the time taken to reach flowering. TOS 1 took an average of 106 days to reach 50% flowering which reduced to 82 days for TOS 2 and 75 days for TOS 3.
Delaying sowing from TOS 1 to TOS 2; a period of 4 weeks; reduced the time to 50% flowering by 24 days. The days to flowering difference between TOS 2 and TOS 3 was much smaller, only 7 days, even though there as a 16-day difference in sowing time.
In TOS 1, the slowest hybrid to reach 50% flowering was MR-Apollo at 115 days, and the quickest was Agitator at 99 days, a spread of 16 days over the eight hybrids examined. In contrast by TOS 3, MR-Apollo flowered in 81 days, while Agitator was 70 days, a difference of 11 days. Agitator was consistently the quickest and MR-Apollo consistently the slowest of the hybrids tested to reach 50% flowering (Figure 1).
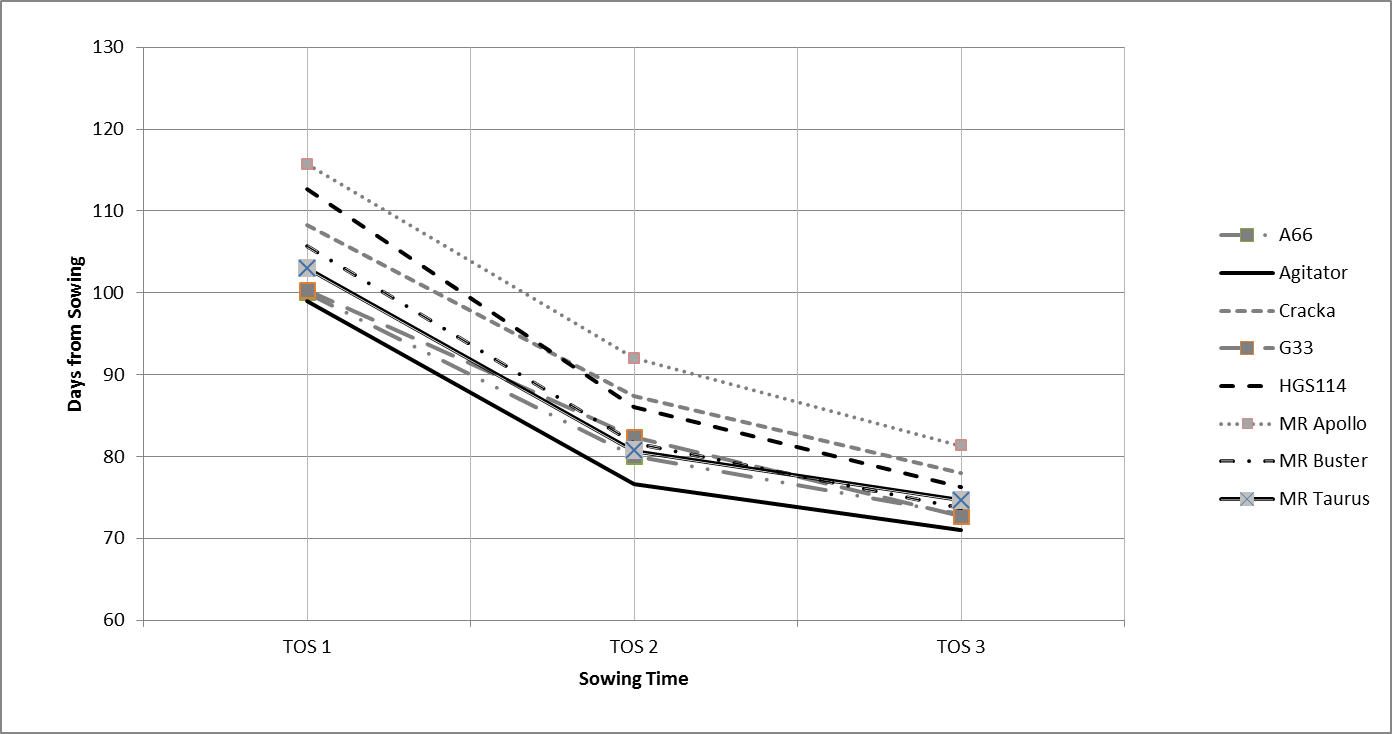
Figure 1. Days to 50% flowering at "Ponjola" for 6 plants/m2 target population.
TOS 1 moved the flowering window for all hybrids forward by around three weeks compared to sowing at the recommended soil temperature (TOS 3). This meant flowering was completed prior to the onset of very high temperatures at the beginning of December (Figure 2).
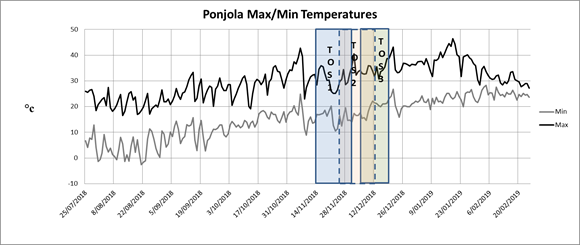
Figure 2. The flowering windows for TOS 1, TOS 2 and TOS 3 at "Ponjola" Moree in 2018-19
What was the impact on grain yield and quality?
The site mean yield was 1.78 t/ha at “Ponjola” in 2018-19. There was a significant interaction between time of sowing and hybrid yields (Figure 3). Plant population did not have a significant impact on grain yield. TOS 1 was the highest yielding at 2.14 t/ha. There was no significant difference in yields achieved between TOS 2 and TOS 3 being 1.51 and 1.68 t/ha respectively.
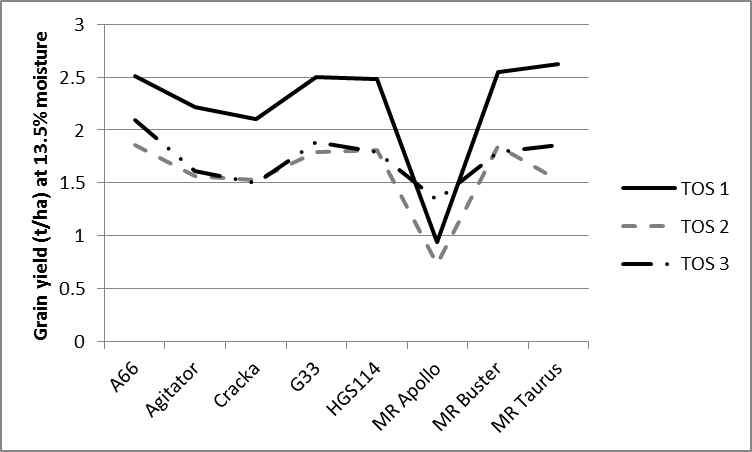
Figure 3. Grain yield at three times of sowing (TOS) at "Ponjola" Moree in 2018-19
Grain protein achieved was significantly less at TOS 1 (10.7%) compared to the TOS 2 and TOS 3 planting times at 11.1% and 11.2% respectively. However, all grain proteins were still at an acceptable level to show that nitrogen was not limiting.
Screenings were impacted by TOS, population and hybrid. TOS 1 had significantly lower screenings at 10% compared to TOS 2 at 16.6% and TOS 3 at 17.9%. The hybrid interaction was also significant with Agitator averaging the lowest screenings at 10.5% while G33 and MR-Buster had the highest between 18-19%. The 120,000 plants/ha target population was the only treatment to show significantly higher screenings at 15.9% while all other target plant populations were between 14-15%, when averaged across hybrids and sowing times. This means that only TOS 1 met the sorghum 1 standards for screenings.
Test weights were generally low. No hybrid averaged the required test weight to achieve grade 1 sorghum (>71 kg/hL). The only treatment to achieve sorghum 1 was Cracka at TOS 3 with 71.3kg/hL (data not shown).
Breeza dryland
Plant establishment
At Breeza the soil temperatures with TOS 1 were cooler than the Moree site (11.2°C vs 12.3°C; (Table 1)), even though the first sowing date at Breeza was close to one month later than Moree on the 6th September. Soil temperatures rose at Breeza during mid-September but then plummeted again following TOS 2 resulting in a 7-day average of 10.3 °C. At these cooler soil temperatures, time of sowing had a significant impact on plant establishment. TOS 1 and TOS 2 had significantly reduced plant establishment compared to the standard (TOS 3) sowing date.
Most hybrids did not achieve the four target plant populations of 3, 6, 9 and 12 plants/m2 for TOS 1 or TOS2. TOS 3 which established in soil temperatures closer to 18 °C was better.
There were a couple of small differences between hybrids. Agitator had a significantly lower establishment than all other hybrids and G33 established fewer plants than MR-Buster (Figure 4).
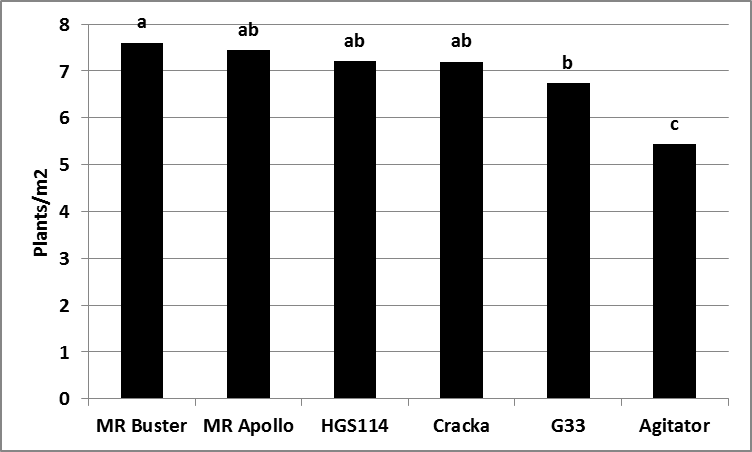
Figure 4. Hybrid establishment (plants/m2) averaged across times of sowing and plant population
Impact of time of sowing and plant population on crop development
There was a significant interaction between time of sowing and population. The number of fertile tillers declined as the plant population increased at all sowing times. TOS 3 had much lower levels of tillering compared to TOS 1 and TOS 2 (Figure 5).
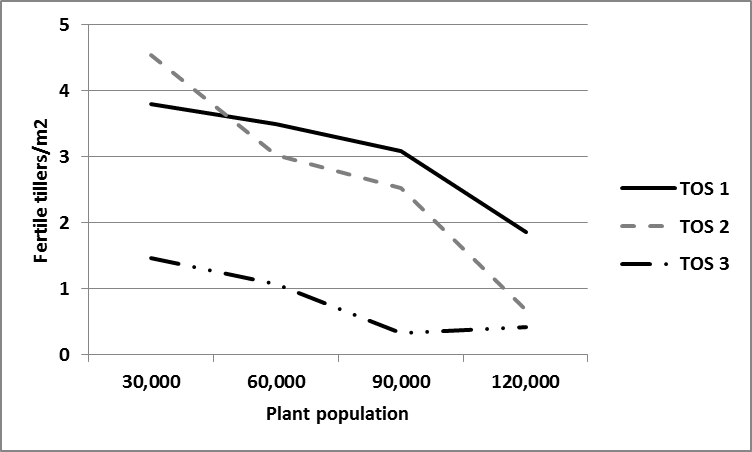
Figure 5. Interaction between time of sowing and target plant population on fertile tillers/m2
Time of sowing did not have an impact on the number of primary heads at Breeza. There were more primary heads produced with higher plant populations. Agitator and MR Apollo produced the lowest number of heads (data not shown).
Did sowing earlier impact on flowering?
The number of days taken to reach 50 % flowering reduced as TOS was delayed. For TOS 1 it was 95 days, TOS 2 was 10 days faster at 85 days and for the standard sowing time at TOS 3, 69 days. Between TOS 1 and 2, delaying sowing by 15 days resulted in a 10-day difference in flowering. TOS 3 developed in much warmer conditions meaning even though there was a 30-day difference in sowing this only caused a 16-day difference in flowering compared to TOS 2.
There was a much smaller difference between the hybrids for time to flowering at Breeza compared with Moree in 2018-19. However, Agitator was still the quickest hybrid for all times of sowing, although by TOS 3 MR-Buster was as quick. MR-Apollo remained the slowest of the hybrids examined (Figure 6).
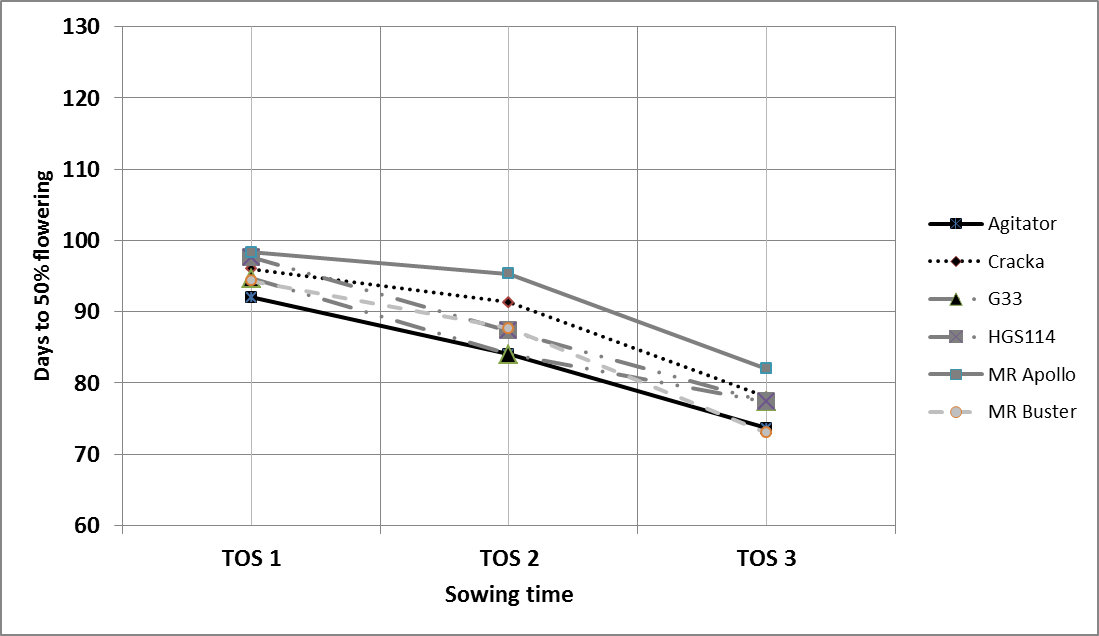
Figure 6. Days to 50% flowering at Breeza – Dryland at 6 plants/ha target plant population
What was the final impact on grain yield and quality?
The site mean yield was 1.73 t/ha at Breeza in 2018-19. There was a significant impact of TOS and hybrid on final grain yield (Table 4). TOS 1 (2.23 t/ha) and TOS 2 (2.12 t/ha) had significantly higher grain yield than TOS 3 (0.85 t/ha), averaged across hybrids and plant populations. There was no significant impact of plant population on grain yield.
Table 4. Impact of time of sowing (TOS) and hybrid on grain yield (t/ha) at 13.5% moisture
Breeza – dryland in 2018-19
Hybrid | TOS 1 | TOS 2 | TOS 3 |
|---|---|---|---|
MR- Buster | 2.61 a | 2.41 ab | 1.26 def |
G33 | 2.59 a | 2.43 ab | 0.83 eg |
Agitator | 2.57 a | 2.31 ab | 0.88 eg |
HGS114 | 2.22 bc | 2.32 ab | 0.87 eg |
Cracka | 2.16 bc | 1.91 acd | 1.00 efg |
MR-Apollo | 1.25 defg | 1.32 e | 0.26 h |
L.s.d: 0.75, P<0.05 | |||
Test weights were significantly lower at TOS 3 (54.8 kg/hl) compared to TOS 1(62.7 kg/hl) and TOS 2 (62.8 kg/hl), although neither made sorghum 1 classification. Similarly, no hybrid averaged the required test weight to achieve grade 1 sorghum (>71 kg/hl).
Screenings were impacted by TOS, plant population and hybrid at Breeza with all screenings levels being relatively high. TOS 1 and TOS 2 had significantly lower screenings at 12.6% and 13.2 % compared with TOS 3 at 27.4%. The hybrid interaction was also significant with Agitator and Cracka producing the lowest screenings at 15.3% at 15.7%. G33 had the highest at 21.5%. Higher screenings also occurred as plant population increased (data not shown).
Conclusions
At the Moree site, there was little impact on plant establishment from sowing in mid-august when soil temperatures were 12.3°C for the 7 days following sowing. In contrast sowing into slightly cooler temperatures (10-11°C) at Breeza had a significant impact on sorghum establishment.
At both Moree and Breeza, the flowering window was moved forward from sowing earlier in this season. This helped to ensure flowering occurred before the peak of heat and moisture stress set in. The earlier sowing time resulted in improved yields at both sites, even though average yields at Breeza and Moree were not high due to drought conditions. Varying plant population, from 3 to 12 plants/m2 did not impact final grain yield. The plants modified their tiller and head production in response to the surrounding competition and seasonal conditions. For example, as plant population increased the number of primary heads increased and the number of fertile tillers decreased.
While the benefits of sowing sorghum earlier than traditionally recommended appear to be improved yields and grain quality, the risks have not been fully evaluated. The impact of frost in particular needs to be further assessed including determining the actual temperature where plant death occurs.
Acknowledgements
The research undertaken as part of this project is made possible by the significant contributions of growers through both trial cooperation and the support of the GRDC, the author would like to thank them for their continued support.
In particular the support of Geoff Manchee & JR McDonald “Ponjola” Moree, and Rob Holmes, HMAg is gratefully acknowledged. We would also like to acknowledge the technical support of Delphi Ramsden, Natalie Aquilina, Mitchell Clifton, Mathew Dunn, Scott Goodworth and Steve Jengos. Thanks to Steven Simpfendorfer for editorial comments.
Contact details
Loretta Serafin
NSW Department of Primary Industries, Tamworth
Mb: 0427 311 819
Email: loretta.serafin@dpi.nsw.gov.au
GRDC Project Code: UOQ1808-001RTX,
