Near-infrared spectroscopy for real-time in-field nutrient analysis of fresh plant material
Near-infrared spectroscopy for real-time in-field nutrient analysis of fresh plant material
Author: Doug Hamilton, CSBP Fertilisers | Date: 11 Feb 2020
Key messages
- Cost effective near-infrared spectrometer (NIRS) hardware shows strong potential for in-field, real-time estimation of total nitrogen (N) content for wheat and barley.
- Gaining a better understanding of a crop’s N status in real time is expected to lead to economic benefits to growers by optimising fertiliser applications to crop N requirements.
- Validation of the N model based on the current wheat and barley dataset will be performed in 2020 along with testing of commercial options and investigation of other avenues for these findings, such as optimising N applications to meet a cereal protein grade.
- The focus to date has been on developing a solution for N on wheat and barley, while canola and other nutrients will be the subject of future efforts.
Aims
The current focus of this work is to develop a solution that provides real-time, in-field N analysis of fresh plant material to enable growers to make more profitable decisions about fertiliser applications.
Introduction
Yield potential in grain and oilseed production systems in Western Australia (WA) is driven primarily by seasonal climatic conditions. Due to the inherent infertility of soils in WA, fertiliser applications are necessary to achieve the maximum possible yield for a given amount of rainfall. Delaying fertiliser applications, particularly N, is a common strategy used by growers to manage seasonal risk. There are several tools available to estimate nutrient content or assess a crop’s nutrient status and determine whether a crop is expected to provide an economic response to a fertiliser application. While these tools provide useful information, the outputs are not always timely. They can also be inaccurate and complex to implement, requiring various measurements or processes to be performed before generating a reliable output. Uncertainty of a crop’s N status is driven by nutrient N cycling factors such as mineralisation, leaching, volatilisation and immobilisation, which vary by soil type and with different seasonal conditions.
Technological advances offer new choices for measuring crop nitrogen content and modelling whether a crop will respond to a fertiliser application. These technologies include using artificial intelligence to model crop requirements, x-ray fluorescence, mid-infrared spectroscopy, near-infrared spectroscopy, chlorophyll meters and a range of remote sensing methods and applications. Understanding whether these technologies can provide reliable nutrient estimates in real-time and at any location in a paddock would offer significant benefit to grain growers, as it would allow growers to assess the nutrient status of their crops and optimise their in-season fertiliser requirements.
Of the technologies that have potential to assess nutrient content in real-time, one of the more promising is near-infrared spectroscopy. Near-infrared spectroscopy offers no, or minimal, sample preparation and rapid scan time. It is relatively easy to use and has the potential to analyse nutrients in real-time. Near-infrared spectroscopy takes spectral measurements of plant material, recorded as either absorbance or reflectance of NIR light. These are then interpreted by a model calibrated to predict a variable of interest, which is also known as a chemometric model. In the current context, the chemometric model is used to estimate plant nutrient content from the NIR spectra.
Currently in agriculture, NIRS predominantly involves large, expensive benchtop devices that analyse processed (dried and ground) sample material in a laboratory setting. The combination of technological advances in the hardware and advances in data science now allow the capabilities of this solution to be taken off benches in laboratories and out into the field.
Underlying principles of near-infrared spectroscopy
Near infrared spectroscopy uses radiation in the 700 - 2500nm wavelength region of the electromagnetic spectrum (Batten 1998)). There is a relationship, both quantitative and qualitative, between the chemical composition and the spectrum recorded in the NIR region, where samples with different organic compositions have different infrared spectra (García-Sánchez et al 2017). Near infrared spectroscopy works on the principle that the absorbance or reflectance values reported by a spectrometer do not directly measure an element but instead measure the various bonds associated with that element within the NIR spectrum. The content of an element is then inferred by the relationship developed in the chemometric model.
When applied to organic compositions the interpretation of the spectra is tremendously complex (García-Sánchez et al 2017). The NIR spectra of a plant sample is the sum of absorbances at several wavelengths by major constituents such as protein, structural and non-structural carbohydrates and water plus absorbances of many minor constituents (Batten 1998). This results in broad peaks and shoulders in the spectra, as can be seen in Figure 1, which shows typical reflectance spectra of a fresh green leaf within the spectral range of 350 – 2 500nm. Within these broad overlapping peaks is a range of information, where certain sections, or combinations of them, will relate to a plants nutrient status.
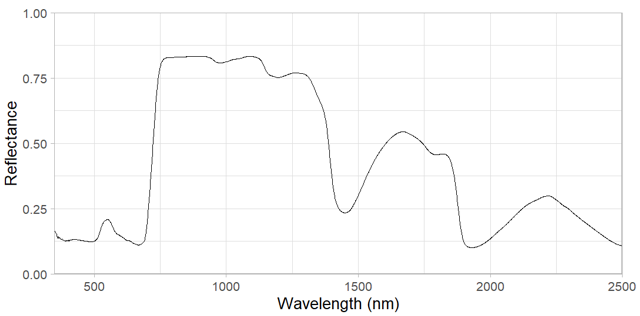
Figure 1. Typical reflectance spectra of a fresh green fresh leaf within the spectral range of 350 – 2500nm (X-axis) and reflectance values are displayed on the Y-axis.
Tactical nitrogen decisions
The predicted nitrogen content of a plant is combined with user inputs, such as a target yield, to calculate the N status of the plant. This status is a key piece of information for understanding N requirements when applying N tactically during the growing season. A better return on N investment can be achieved if Nis applied closer to a forecasted rain event. This allows better anticipation of the yield potential and associated N status, and for a sufficient volume of rain to wash the N into the soil to become plant available.
Worked Example:
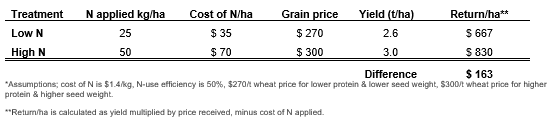
The following is a hypothetical example based on a common scenario played out in the wheatbelt in any given season. It is the start of August and a grower’s crops are coming into stem elongation. The paddock typically yields a wheat crop of 2.5t/ha but the grower has managed seasonal risk by applying enough N for 2t/ha and needs to decide whether to apply more N to reach the yield potential. A forecast rainfall event of 25-50mm looks promising, is now only three days out from occurring and looks likely to push the yield potential up to 3.0t/ha. The grower scans the crop to get an objective measure of how well it has been accessing N to date. The status is deficient for 3.0t/ha and marginal for 2.5t/ha so the grower applies 50kg/ha of N rather than the 25kg/ha initially planned. This is based on a N use efficiency of 50% where 50kg/ha is required to increased yields by 1t/ha. The crop averages 3.0t/ha at 10.5% protein. A test strip with 25kg/ha of N yields 2.6t/ha at 8.5% protein. The table 1 outlines the economic impact of this decision.
Method
Hardware and software
The NIR spectrometer hardware is based on Texas Instruments’ DLP technology. This device measures wavelengths in the 900nm - 1700nm wavelengths of the NIR region and is a more cost-effective hardware option than devices that measure broader NIR ranges. Thirty-five of these devices were deployed into the field during data collection over three growing seasons.
The spectrometer hardware communicates the NIR spectral data via Bluetooth to a smart phone application, which in turn communicates the spectra to a cloud-based platform. This platform firstly processes the spectra into an N estimate through a chemometric model trained using machine learning algorithms and then takes user input data to generate a N-status. This information is communicated back to the smartphone application or to other web services. Where there is poor mobile network coverage the smart phone application is able to store the data offline until connectivity with the cloud is re-established. The basic components of the solution are visualised in Figure 2.
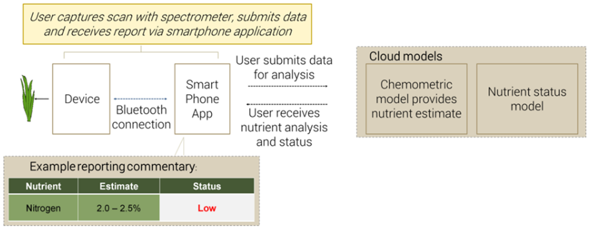
Figure 2. Diagrammatic representation of the hardware and software elements that comprise the near infrared spectroscopy solution.
Sampling process
Plants were sampled across multiple growing stages throughout the Australian 2017, 2018 and 2019 growing seasons. Spectral data were captured from multiple leaves of each plant in a set pattern. The CSBP Soil and Plant Laboratory then analysed the sample as a standard plant nutrient analysis, which includes total N (TN) and other analyses.
Data analysis has focused on total TN in wheat and barley. Over the course of this work, across all plant types, over 10 000 plant samples were analysed. Plant samples were taken from both field trials, where various fertiliser treatments were being tested, and farmers’ paddocks under normal conditions with accompanying strips of high and low N.
Data processing and analysis
The first step in processing the entire NIR dataset was to conduct exploratory data analysis applying various data science techniques for identification and removal of outliers to clean spurious spectra from the data.
For training and testing purposes, the dataset was split into five groups, where four of the groups were used for training a model and the fifth was used for testing. This training and testing were repeated until all groups had been in both the training and the testing sets. The final reported performance of the model was the average of all groups as test datasets. The testing and training scenarios were designed to test the model’s performance across seasons, geographic regions and plant growth stages.
The metrics used for assessing the model performance included the coefficient of determination (‘R2’) and Mean Absolute Percentage Error MAPE. Coefficient of determination is a measure of the proportion of the variance in the dependent variable (nutrient content) explained by the independent variables (the spectra and contextual features). Mean Absolute Percentage Error is a measure of the accuracy of the prediction, where the accuracy is expressed as a percentage of the absolute prediction error.
Results
Nitrogen chemometric model performance
The values in Table 2 show a good spread of total nitrogen percent (TN%) for the wheat and barley samples collected, with the average across the dataset of 3.02 being close to the centre of the min and max values.
Table 2: Summary statistics of the wheat and barley total nitrogen percent (TN%) dataset and average R2 and MAPE of the model performance on the five regions used for testing.
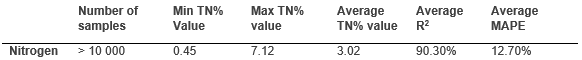
Sample numbers were spread evenly across the various growth stages collected and the majority of the sites sampled showed a range of uptake levels of N at the time of sampling. The reported R2 and MAPE were calculated as an average of the results of the individual groups’ model performance. An R2 value of 90.3% shows that the modelling explains a high proportion of the variance in the N content across these groups. The MAPE value of 12.7% demonstrates that, on average, the absolute value of the TN% prediction is 12.7% from the actual TN%.
Figure 3 shows how the chemometric modelling performed on each of the 2019 groups used for testing the model performance. The visualisation used in the scatterplots includes different colours for each growth stage sampled, a trend line for that growth stage in the same colour and a grey shading around each trend line to indicate the 95% confidence interval. These demonstrate strong modelling performance across the groups used for testing. This is demonstrative of the time spent building an understanding of how the N content of plants relates to NIR data plus also the effort expended in ensuring that a wide range of nitrogen contents, growth stages and growing conditions were collected as part of collection of the samples.
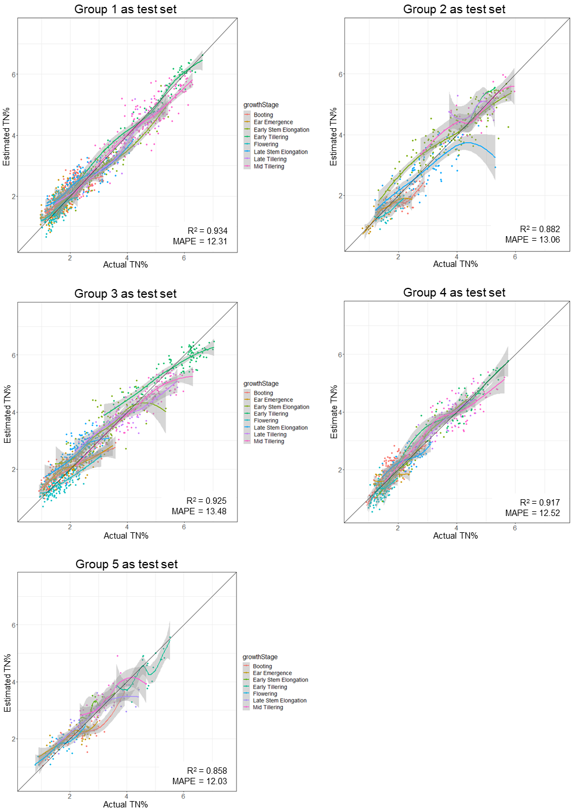
Figure 3: Individual scatter plots for a total nitrogen percent (TN%) model tested on each of the five groups.
Conclusion
Cost effective NIR spectrometer hardware can enable a real-time in-field N estimate of wheat and barley, based on plants that have been sampled to date. The performance of the N estimation model used by this analysis will be validated in the 2020 season. This will be done in conjunction with testing of commercial options and research into other avenues of the project’s findings that can provide an economic benefit to growers, such as optimising N applications to attain a particular protein grade. Analysis and testing for other plants and other nutrients will be the subject of future efforts.
References
Batten, GD 1998, ‘Plant analysis using near infrared reflectance spectroscopy: the potential and the limitations’, Australian Journal of Experimental Agriculture, vol. 38 no. 7, pp. 697-706.
García-Sánchez, F, Galvez-Sola, L, Martínez- Nicolás, JJ, Muelas-Domingo, R & Nieves, M 2017, ‘Using Near-Infrared Spectroscopy in Agricultural Systems’ in Kyprianidis KG & Skvaril J (eds) Developments in Near-Infrared Spectroscopy. Intech Open publishers. Available from doi:10.5772/67236.
Acknowledgments
CSBP Sales team, Agronomy team and Field Research team. Data science expertise from Visagio. Various farming operations for access to paddocks. Birchip Cropping Group, Hart Field Site, Agrilink and Gorst Rural for access trial sites and sampling of the sites.
Contact details
Doug Hamilton
CSBP Fertilisers
Kwinana Beach Road Kwinana. 6167 WA.
0427 741 775
doug.hamilton@csbp.com.au