An automated site-specific fallow weed management system using unmanned aerial vehicles
An automated site-specific fallow weed management system using unmanned aerial vehicles
Author: Troy Arnold Jensen, Bruen Smith & Livia Faria Defeo (Centre for Agricultural Engineering, University of Southern Queensland) | Date: 04 Mar 2020
Take home messages
While sprayers fitted with camera sensor technology are in wide use for fallow weed management in NNSW and Queensland grain growing areas, some growers do not as yet have this technology
- Most modern spray equipment has multiple sections that can be independently operated
- Existing spray technology coupled with georeferenced weed maps generated by current consumer grade UAV technology, has been demonstrated to enable significant reductions in herbicide use
- Techniques have been developed to minimise the size of data files while maintaining system efficiency
- Preliminary testing shows 93% of weeds were sprayed with reductions in herbicide use of 45% in the test field.
There is currently a need to optimise herbicide application technology to minimise herbicide use and resistance. To more fully utilise precision weed spray equipment, a system has been developed implementing the four-step closed loop precision agriculture scheme. The aim being, to create a system that utilises existing precision spray and consumer grade UAV technology. The use of consumer grade UAV technology limited the system being developed to rely on only colour, or red-green-blue (RGB) imagery. Therefore, an algorithm utilising the ‘excess green vegetative’ index was developed. This algorithm has been developed to minimise the detail and number of polygons in the resulting spray maps while maintaining the efficiency of the system. Ground truthing of the system revealed a hit rate on target fallow weeds of 92.6% and a potential herbicide saving of 44.6% when compared to whole of paddock spraying.
Introduction
Unlike the traditional practice of applying a uniform treatment and presuming it to be the ideal, precision agriculture (PA) is a site-specific closed loop scheme used to identify and respond to variability within each management unit. The process steps are(Cook and Bramley 1998) illustrated in Figure 1.
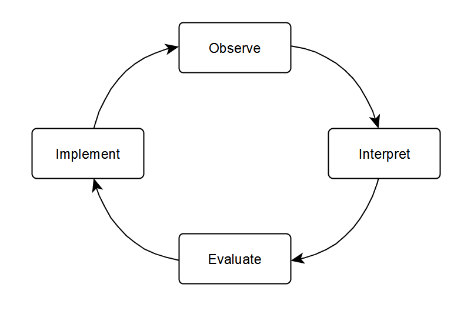 Figure 1. Precision agriculture cyclical process (Cook and Bramley 1998)
Santi, Bona, Lamego et al. (2014) found site-specific weed management based on infestation zones could lead to herbicide reductions ranging from 30% to 70%. These findings are consistent with other studies; Tian, Reid, and Humme et al. (1999) reported a potential herbicide savings of 48%. Timmermann, Gerhards, and Kühbauch (2003) found herbicide reductions differed by crop variety and year, although overall the results showed an average reduction of 54% in herbicides.
Most contemporaryspray systems manufactured in the past decade have the capacity for section control. However, despite the evidence of herbicide reductions through implementation of site-specific weed management, with the exception of camera based systems where sensors activate individual nozzles and are in widespread use in the GRDC’s northern grains region, very few are utilising section control other than for turning off sections upon entering or exiting a field. There is need for an automated pragmatic system to generate targeted herbicide application maps for use with existing precision spray equipment that does not already have camera weed sensor technology. A system under development at the University of Southern Queensland utilises low-cost, unmodified, UAV technology and machine vision to automatically generate prescription spray maps which can be used with contemporary precision spray systems with the aim to provide an pragmatic and inexpensive spray system to reduce herbicide use.
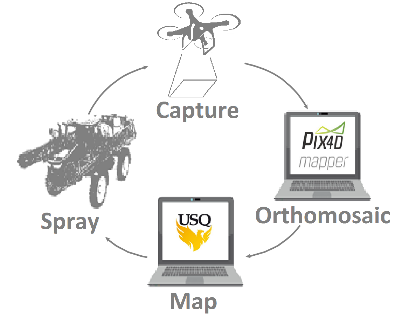 Figure 2. Cyclical precision weed management system
The system depicted in Figure 2, is under development and involves four main processes:
- Imaging the field using a UAV
- Processing this RGB imagery to create an orthomosaic
- Processing this orthomosaic using machine vision to create a spray map and
- Spraying.
The aim is to implement this in a closed loop fashion based on the four-step precision agriculture scheme and identify persistent weed populations to enable targeted adjustment of herbicides.
The DJI Phantom 4 Pro UAV, a consumer grade UAV, was selected for capturing imagery due to its low cost and high popularity in the Australian market. However, this UAV has several restraints that must be overcome to produce a practical precision weed spray system. The Phantom 4 Pro depends on GPS/GLONASS information to control flight trajectory and to geotag imagery. However, the accuracy of this global positioning system is limited to several meters (DJI, 2019), and far greater precision is required. If not corrected for, this inaccuracy would flow through the rest of the weed spray system and result in spray maps ‘misaligned’ with weed position .
Contemporary spray equipment utilise guidance. Systems such as the StarFire™ 6000 from John Deere relies on the Real-Time Kinematic (RTK) positioning system and provides +/- 1.2 inch (30mm) pass-to-pass accuracy (Deere & Company, 2019). For the system under development to work efficiently, the spray maps generated must align precisely with the guidance system of the spray equipment. Therefore, a method to correct for the GPS poisoning error of the UAV is required.
To correct for this error and produce accurate orthomosaics, Ground control points (GCPs) were investigated as a solution. GCPs are visual markers with a known precise and accurate geographic location. These targets are positioned in the field and imaged along with the rest of the field under investigation. When the orthomosaic is generated, the location of these GCPs is tagged and the related known accurate geolocation data is assigned to correctly reposition the orthomosaic.
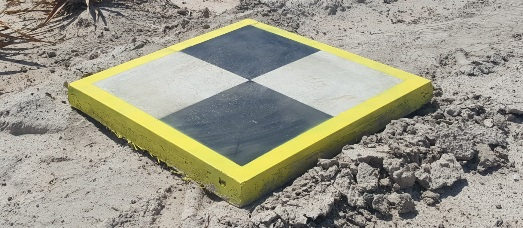 Figure 3. Ground control point
To create an orthomosaic, photogrammetry software is required. There are several software packages available including Agisoft Photoscan Pro, Pix4D, and Microsoft Image Composite Editor (ICE). Gross and Heumann (2016) Evaluated the accuracy of these packages and found Pix4D had the best geometric accuracy with a RMSE of 7.7cm. Therefore, Pix4D was employed to generation of all orthomosaics used in this project. An orthomosaic image is a mosaic of aerial images that has been orthorectified. The orthorectification process removes perceptive distortions from the images and flattens the resulting mosaic using a Digital Surface Model (DSM). The orthomosaic produced is stored as a GeoTIFF, a public domain raster image file format that stores georeferencing information as metadata along with the raster imagery using the “Well-known text” (WKT) markup language. The weed mapping software under development utilises this metadata to translate between the position of the pixels in the GeoTIFF, using the orthogonal coordinate system to create polygons in a vector “shapefile” in the chosen projected coordinate system.
As stated, the aim of the project is to utilise unmodified consumer grade UAV technology. Therefore, the software being developed needs to utilize RGB imagery. Consequently, the software under development uses the green-from-brown colour discrimination technique and is implemented using OpenCV (“OpenCV Library 2019”, 2019) an open-source computer vision library. In order to segment green weeds in the orthomosaic, the vegetation index Excess green (G_ex) is used to produce an G_ex image, using the following equation (Woebbecke et al., 1995).
Where:
G_ex = Excess Green Image
G = Green Channel
B = Blue Channel
R = Red Channel.
Thresholding this G_ex image produces a monochrome raster map of the green weeds. The image relative position of these weed pixels is then translated to the relevant geospatial coordinate system using the Geospatial Data Abstraction Library (GDAL). Initial developments creating zones around each weed using the weeds profile led to the creation of detailed yet excessively large shapefiles. These shapefiles often contained in excess of ten thousand polygons per hectare, which is above the maximum polygon limit of some spray controllers (CNH Global, 2016). Therefore, a method to reduce the number of polygons in these files while maintaining the efficiency and accuracy of the spray maps has been investigated and an algorithm developed. In practice, the algorithm creates zones around the weeds using the minimum number of vertices required and aggregates geographically close weeds within a specified distance.
 Figure 4. John Deere 4066R with link sprayer – base station is visible on the left
An evaluation of the developing weed spray system has been undertaken at a test site at Felton, Queensland. The site was first imaged at an altitude of 60 m for the creation of weed maps and then at 30 m for assessment purposes only. A John Deere 4066R with 12m link-sprayer was used for spraying using dye, as seen in Figure 4. The 12 metre boom on this unit was divided into five individually controlled sections. The section behind the tractor was 2.0 m (4 nozzles) with each of the other section being 2.5 m (5 nozzles) with the nozzles on a 50 cm spacing. No RTK base station had been established for guidance at this site; therefore, a mobile base station was employed, as seen in Figure 4. To evaluate the hit rate of the entire system, 200 weeds were numbered and geotagged with a Trimble R2/TSC3 RTK GNSS rover as seen in Figure 6. Paper was placed on each weed to record if it was sprayed as seen in Figure 5. This paper was numbered to correspond to the geotagged information created with the RTK rover.
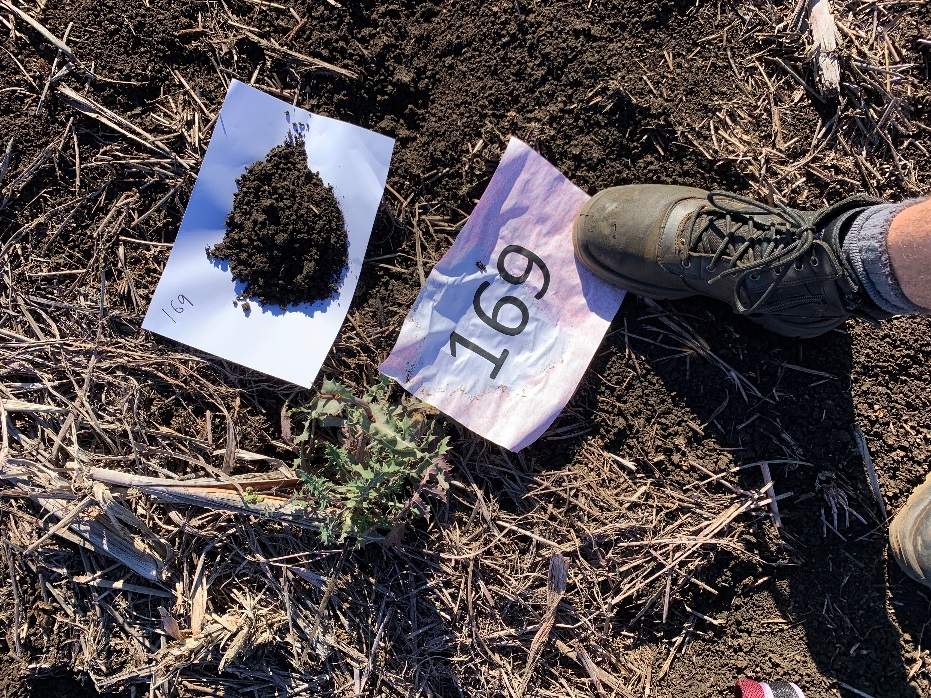 Figure 5. Sprayed paper used to determine if geotagged weed has been sprayed.
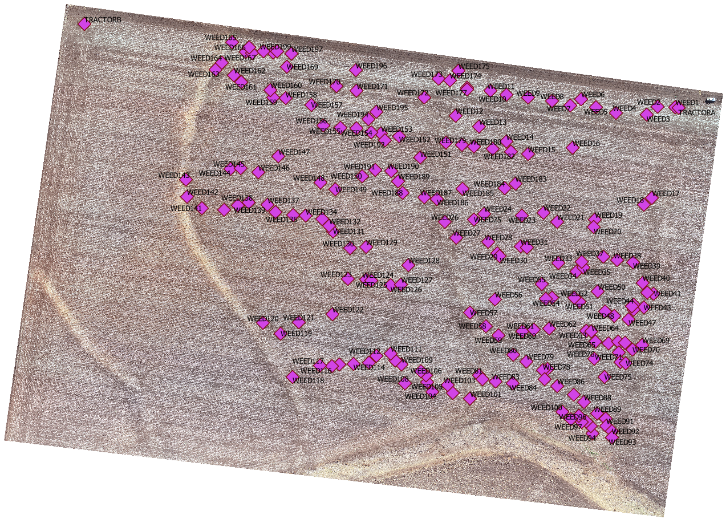 Figure 6. Geotagged weeds
It should be noted that at the time of testing, the weed population was stressed due to cold weather and lack of water. This meant that many of the weeds were less green and some presented a purple tinge as seen in Figure 5. This is significant as the weed detection algorithm uses a green from brown weed identification technique. This also highlights a limitation of using this technique.
The area imaged was ~11.2ha and contained both soybean and sorghum stubble, as seen in Figure 4. The 12m width of the sprayer was inconsistent with spacing of the established tramlines and these tramlines could not be utilized. Therefore, the sprayer speed was limited to 6 km/h due to the uneven surface of the field.
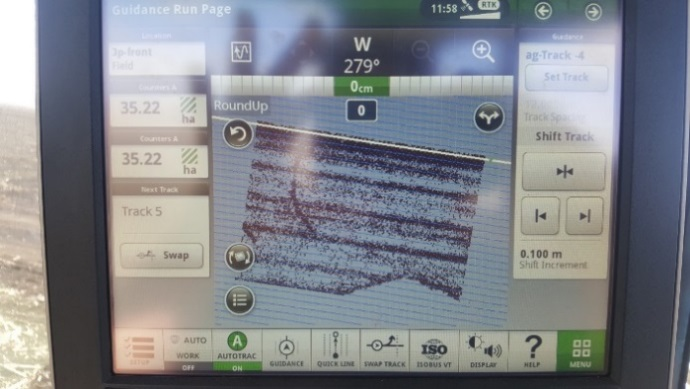 Figure 7. Spray map shown on spray controller
Table 1. Evaluation Results
Evaluation | |
|---|---|
Field area imaged | 11.2 ha |
Sprayed area | 6.8 ha |
Spray saving | 44.6% |
Weeds Tagged | 200 |
Hit rate | 92.6% |
Process | Time |
Establishment of ground control points in field | 0:12 |
Field imaged at 60 m | 0:19 |
Marking ground control points in Pix4Dmapper | 0:11 |
Orthomosaic creation with Pix4Dmapper | 3:57 |
Spray map creation with USQ software | 0:03 |
Total | 4:42 |
The spray maps generated for this site can be seen in Figure 7 presented on the display in the 4066R. Dye showed well on the paper placed adjacent to each weed as seen in Figure 5. Results from this evaluation can be seen in Table 1. Counting of the dye covered paper revealed the system to have a ~93% hit rate. Of the ~11.2ha field ~6.8ha was sprayed, resulting in a potential herbicide saving of 44.6%. These herbicide reductions are consistent with the before mentioned studies conducted by (Timmermann et al., 2003) and (Santi et al., 2014). The entire process of collecting imagery and producing spray maps took four hours and forty two minutes, ~84% of this time was the time taken to generate the orthomosaic.
Conclusion
A solution has been developed to reduce herbicide usage. This solution couples contemporary UAV and precision spray technology using machine vision and Geographic Information Systems (GIS) technology. Evaluation of the developing system revealed a herbicide saving of 44.6%. Work continues to reduce the time taken to produce these maps. The project is currently in the process of determine the commercial value of the system and developing the technology into other areas.
Acknowledgements
The authors would like to thank the Australian Government’s Department of Agriculture and Water Resources and the University of Southern Queensland for funding this project.
References
Bramley R, Deguara P, Granshaw B, Jensen T, Lillford L, McGillivray J, Markley J, McDonnell P, Moore K, Robson A and Sefton M (2015). Precision Agriculture for the Sugarcane Industry. Brisbane: Sugar Research Australia.
CNH Global. (2016). Shapefile (.shp) Import for the Case IH AFS Pro 700. In C. Global (Ed.).
Cook S and Bramley R (1998). Precision agriculture - opportunities; benefits and pitfalls. Australian Journal of Experimental Agriculture 38, 753–763.
Deere & Company. (2019, 4 30). StarFire™ 6000 with SF3.
DJI. (2019, April 29). Phantom 4 Pro.
Gross JW and Heumann B W (2016). A Statistical Examination of Image Stitching Software Packages For Use With Unmanned Aerial Systems. Photogrammetric Engineering and Remote Sensing 82, 419-425
OpenCV Library 2019. (2019, January 30).
Santi A, Bona S, Lamego F, Basso C, Eitelwein M, Cherubin M, Kaspary T, Ruchel Q and Gallon M (2014). Phytosociological variability of weeds in soybean field. Planta Daninha, 39–49.
Tian L, Reid J and Humme l J (1999). Development of a precision sprayer for site-specific weed management. Transactions of the ASAE 42, 893–900.
Timmermann C, Gerhards R, and Kühbauch W (2003). The economic impact of site-specific weed control. Precision Agriculture 4, 249–260
Woebbecke M, Meyer G, Von Bargen K, and Mortensen D. (1995). Color Indices for Weed Identification Under Various Soil, Residue, and Lighting Conditions. Transactions of the ASAE 38, 107-118.
Contact details
Troy Jensen
CAE, University of Southern Queensland
West Street, Toowoomba, QLD
Ph: 0407 789 339
Email: troy.jensen@usq.edu.au
® Registered trademark
TM Trademark
