Where are on-farm lime sources more cost effective than coastal limesand in the Kwinana East Port Zone?
Where are on-farm lime sources more cost effective than coastal limesand in the Kwinana East Port Zone?
Author: Ashleigh Donnison, Regional Research Agronomist, Caroline Peek, Andrew Van Burgel, Cameron Wild | Date: 29 Apr 2020
Key messages
- Quality of on-farm lime and distance from coastal limesand sources are important factors in determining economic advantage over coastal limesand.
- The iLime app simulations indicate that incorporation increases the economic benefit of limesand and on-farm limes when used in recovery liming scenarios.
Aims
To investigate the cost-effectiveness of on-farm lime for ameliorating soil acidity in Kwinana East Port Zone and to validate the iLime application (developed by DPIRD and Desiree Futures with funding from GRDC) by comparing simulations with field trial results.
Introduction
Soil acidity is a major constraint for growers across the Western Australian wheatbelt (Gazey et al 2014) and liming to improve soil pH has become an increasingly important practice for maintaining and improving soil pH. A major barrier to the adoption and expansion of liming practices for many farm businesses is the high freight costs of coastal limesand. This is particularly significant for growers located in the low rainfall zones of the Kwinana East Port Zone (KE), where yields are highly variable and distances to coastal sources are large. On-farm lime sources with potential to ameliorate soil acidity have been identified throughout the KE landscape. These sources can often be identified by vegetation, having a soil pH of 7.0 or higher, and having white carbonate nodules near or at the surface (The Liebe Group, 2019). They have a lower associated freight cost and therefore have potential to be more economical for growers. A major issue with these sources is significant variation in source quality through differing particle size distributions and neutralising values (NV). This influences the cost effectiveness of these sources over freighting limesand. Lime sources with a larger proportion of fine particles (< 0.075mm) react more quickly with soil acidity (Scott et al 1992). Fine particles are particularly important in improving the effective neutralising value (ENV) of on-farm sources but need to be associated with a good NV to be effective (Peek et al 2019). Thus, understanding the economic interaction between ENV, particle size, quantity and freight distances is critical when evaluating these on-farm sources.
Method
Trial description
An on-going field trial was established south of Moorine Rock, Western Australia (31°33’ S, 119°11’E), located about 458km from the nearest limesand pit in Lancelin, on an acidic sandy earth with pH below the recommended threshold of 5.5 at 0-10cm and 4.8 in the subsoil (Van Gool 2016) (Table 1). The entire trial site was deep ripped to 50cm in 2018. The 2019 growing season rainfall was 220mm (April to September, DPIRD Weather Station), and had 80.4mm of summer rainfall (December 2018 to March 2019, DPIRD Weather Station). The season had a very hot and dry September (3.4mm) with six days over 30°C, three of these days in mid-September were consecutively over 30°C. Scepter wheat was sown at 55kg/ha into canola stubble on 12 May 2019 with 18kg/ha of nitrogen, 6kg/ha of phosphorus, 10kg/ha of potassium, and 5kg/ha of sulphur at seeding. An additional 13kg/ha of nitrogen was applied late June.
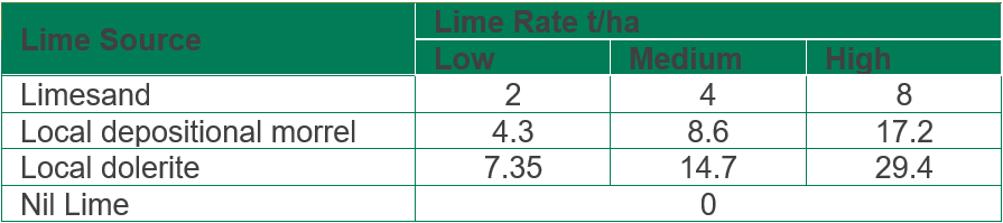
Treatments were a factorial arrangement of lime sources (nil lime and three different lime sources at low, medium and high rates) and cultivation (nil and cultivated with an offset disc to 20cm with a second pass in the opposite direction) (Table 4). Lime sources included coastal limesand, higher ENV dolerite on-farm lime sourced from an area associated with doleritic rocks and a lower ENV depositional morrel on-farm lime. All three samples were analysed using a wet-sieve analysis for NV and particle size. ENV’s were calculated based on research by Scott et al (NSW Agriculture lime comparison calculator 2003) and the WA Soil Quality “Lime benefit Calculator” (Table 2 and 3). The NSW method was used to calculate the trial application rates using lime quality information provided by the owners of the lime sources. The trial had a criss-cross design with four randomised replicate blocks where the cultivation treatments were crossed with the ameliorant treatments at right-angles in each replicate (GenStat Statistics Guide 19th Edition). The randomisation was different for each replicate block.
Table 1. Soil properties at the Moorine Rock trial site (2019)
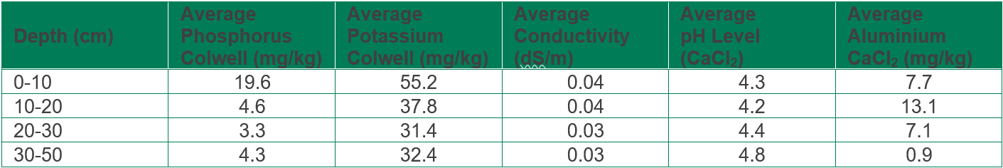
Table 2. Neutralising values for each lime source calculated using the NSW Agriculture lime comparison calculator (2003) and the WA Soil Quality “Lime Benefit Calculator” (2017).
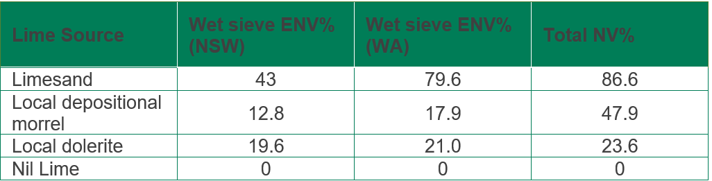
Table 3. Particle size distribution (%) and neutralising values for a) depositional morrel source and b) local dolerite source.
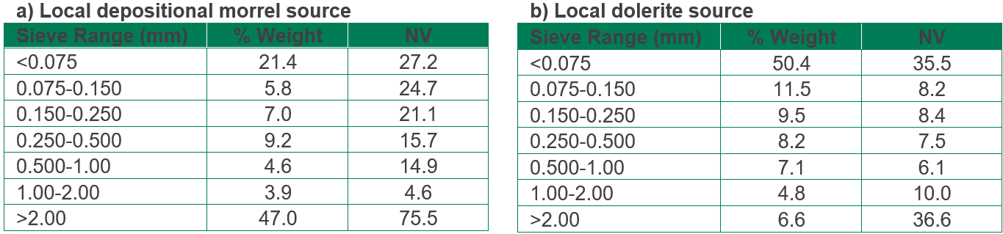
Table 4. Rates applied per treatment for each lime source.
iLime app input
The iLime app was set up using the NV of each particle size, and a cost of $65/t for limesand sourced from a distance of 450km. Both of the local sources were costed at $25/t to simulate freight, extraction and application costs.
The wheat-pasture-wheat-lupin-canola rotation selected was representative of the likely rotation in the paddock where the trial was located. Average yields were 1.24t wheat (trial first year nil yield), 2DSE/ha pasture, 0.8t lupins, and 0.6t canola. The default iLime nitrogen package was used, which does not affect yield.
Data collection
Soil samples were collected across the trial and analysed before seeding. The site will be resampled pre-seeding in 2020. Plant establishment counts were done one month after crop emergence.
Harvest cuts were taken along two 0.5m rows in two representative locations within each plot for dry weight, head number, and grain weight. In addition, 1m-row cuts were taken along previous
seeder-traffic tyre lines that ran through several plots. Plots were harvested with a plot header and grain samples retained for quality analysis.
Data analyses
Yield results were analysed in GenStat Statistics Guide 19th Edition. LSDs were applied at a 0.05 significance level.
Results and discussion to date
Yield response
Cultivation overall increased yield by 0.77t/ha (p<0.001). There was also a significant overall ameliorant effect (p=0.047), where the local dolerite at 29.4t/ha and limesand at 8t/ha both had a significant increase in yield (0.55t/ha and 0.57t/ha respectively). When the rates were combined there was lime sources differed significantly in yield (p=0.036). The local dolerite significantly improved yield (0.34t/ha, p=0.009) while the limesand was significant at a 10% level (0.25t/ha, p=0.053). The local depositional morrel source was not significant compared to the nil. There was a significant interaction between cultivation and amelioration (p=0.045). This was indicative of amelioration having a larger effect when also combined with cultivation. The cultivated high rate of limesand (8t/ha), local dolerite (29.4t/ha) and low rate of dolerite (7.35t/ha) had significantly improved yields from the nil, however there were no significant differences from the nil when amelioration treatments were uncultivated (Figure 1).
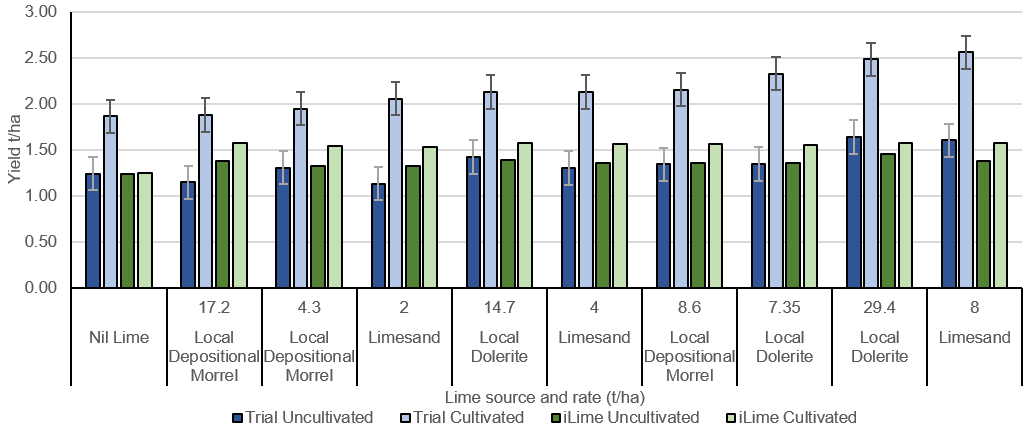
Figure 1. 2019 crop yield response to ameliorants compared to iLime predicted first year yield response in cultivated and uncultivated treatments. Lsd p=0.05
The main driver in yield this year appeared to be cultivation across all sources. Often yield responses to amelioration take more than one year, particularly in low rainfall with less water to carry alkalinity down the profile. There is, however, a benefit of mixing lime into the soil profile by cultivation. The variation in yield responses might also be influenced by site variability. Intensive soil sampling of the plots this summer 2020 will provide more information. Yields were also potentially influenced by the dry September and three consecutive days over 30°C.
Trial and iLime yield comparison
iLime predicted close to observed yields in the uncultivated treatments, but greatly under predicted cultivated treatments (Figure 1). Since iLime does not take the cultivation effects into account, other than those attributed to a pH change, benefits from mineralisation of nitrogen, relief of any compaction and other factors are not considered. The observed cultivated yields were higher than the iLime predictions.
iLime pH response
Topsoil and subsoil pH at this site were both below the recommended range. iLime predicted a
pH increase in the first year for all lime treatments at both 0-10cm and 10-20cm. This effect was predicted to decrease over time. The 0-10cm pH remained within or well above the recommend range for medium and high lime rates in the majority of cases for the 20 years (medium rates Figure 2, other data not shown). At 10-20cm pH increased to within the recommended range for medium and high rates when cultivated (medium rates Figure 3, other data not shown). There was a time lag over the 20 years for pH increase for uncultivated treatments, the treatments did not reach the recommended pH of 4.8 until after year 10 (Figure 3). The application of the medium and high treatments meant there was no requirement for additional lime within the 20 year simulation.
Low rates of lime applied without cultivation, such as the dolerite @7.35t/ha brought pH to 5.58 in the 0-10cm, however it only increased the subsoil to a pH of 4.25. When low rates were cultivated the pH did not quite reach the recommended range at either 0-10cm or 10-20cm, with pH in the cultivated sources ranging from 4.98 to 4.87 in the topsoil and 4.75 to 4.65 in the subsoil (data not shown).
Due to the composition of the on-farm sources, iLime could over value the course particles (>2mm), which are relatively ineffective at reacting with soil acidity but are valued as if they were 1mm. This could have resulted in the depositional morrel source being overestimated in iLime calculations as it contains a large proportion of coarse and high-NV particles (Table 3a). pH results for the trials are not currently available to compare with iLime predictions, but will be intensively measured before seeding in 2020.
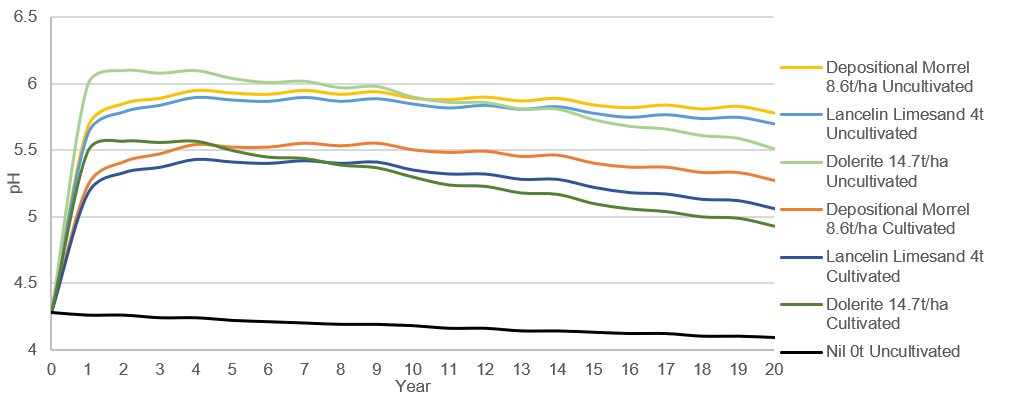
Figure 2. iLime predicted pH (0-10cm) change over 20 years for medium rates of all lime sources both incorporated and unincorporated (4t/ha limesand, 14.7t/ha local dolerite, 8.6t/ha local depositional morrel.)
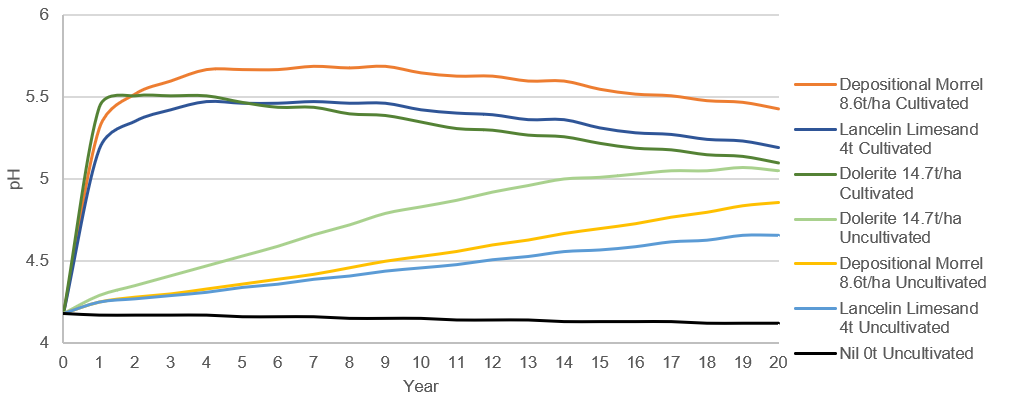
Figure 3. iLime predicted pH (10-20cm) change over 20 years for medium rates of all lime sources both incorporated and unincorporated (4t/ha limesand, 14.7t/ha local dolerite, 8.6t/ha local depositional morrel).
iLime economic response
Compared to uncultivated treatments, cultivated treatments of the same rates consistently delivered higher return on investments (ROI) within five years, and overall higher net present values (NPV) over a 20-year simulation. The medium rate of the depositional morrel source had the highest NPV followed by limesand at 4t/ha (Table 4). Both these rates brought the pH of 0-10 and 10-20cm into the recommended range (Figures 2 and 3).
The cultivated dolerite at the low rate (7.35t/ha) and at the calculated 4t/ha limesand equivalent rate of 8.76t/ha (NSW calculator), were both reasonably competitive with 4t/ha limesand, and both had higher ROI at five and 10 years and NPV at 20 years, than the medium rate of dolerite (14.7t/ha) (Table 4), even though they were simulated to have a lower pH increase.
Table 4. iLime predicted return on investment at five and 10 years, net present value after 20 years and average $/ha/year benefit for medium rates of lime sources.
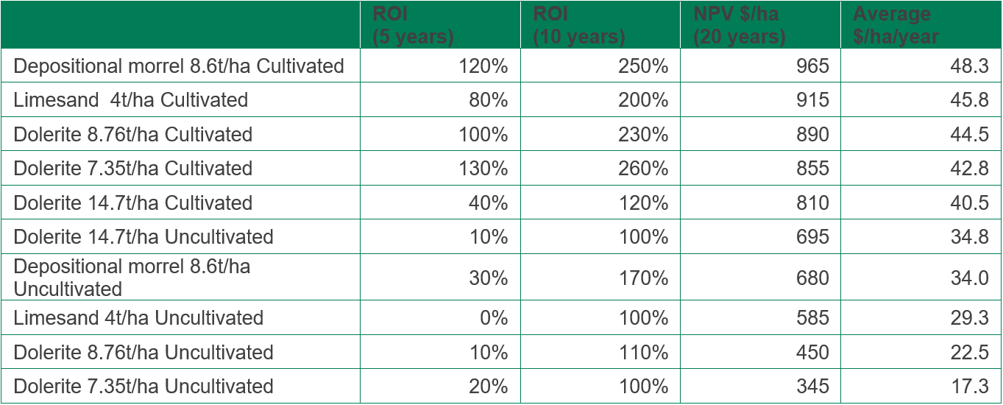
These results are based on the allocated rotation (W-P-W-L-C). The lower rates of dolerite gave a better economic outcome over a 20-year period, but the pH change was not as ideal compared with the 14.7t/ha rate (Figure 2 and 3). The low dolerite rates raised the pH when cultivated to 5.0-4.9 in the 0-10cm and 4.8 to 4.6 in the10-20cm. The use of the iLime app can be used to provide guidance to individual businesses as rates can be chosen to fit with various goals.
Conclusion
On-farm lime sources would preferably be of a high quality to produce an economic benefit compared to limesand, but as distance increases from the coast, poorer quality sources or sources with higher costs associated with extraction and processing could become viable options. It is important to consider particle size distributions and NVs associated with the different particle fractions when using an on-farm lime source. This needs to be assessed for each situation and source. Across all treatments and costings incorporating lime consistently gave better returns for the same lime source and rate.
There was a reasonable relationship between the iLime yield predictions and actual yields for the uncultivated treatments. There was less similarity between the actual trial yields and iLime’s predicted yields for the cultivated treatments, which could be related to benefits other than that associated with pH change. In a varied landscape these additional benefits need to be a considered when using the decision-making tool. iLime only looks at the influence that liming has on the system and does not consider other factors that can affect yield.
iLime predicted a good pH response when adequate lime was applied upfront, and cultivation accelerated the response in the subsoil. The trial data showed a significant yield response to amelioration with lime when cultivation was applied. Planned soil testing of the trial site will provide some field data to validate the model. iLime also predicted that some of the medium-to-high rates applied might not require further liming for 20 years.
Based on iLime simulations, in some situations on-farm limes could be more profitable than limesand. The medium rate of the cultivated depositional morrel source had the highest NPV (over 20 years), however caution is required regarding how iLime values the large particles found in this source as the trial yields were not significantly different from the nil this year. The next highest NPVs over 20-years were cultivated limesand (4t/ha) and local dolerite (8.76t/ha). Overall, the local dolerite source produced wheat yields significantly better than the nil. iLime indicated that the lower rates of local dolerite had higher ROI and NPVs than the 14.7t/ha rate. While the lower rates did not improve pH to the recommended level, they might meet the current requirements for the paddock and still give adequate economic benefit. The economics, as well as physical changes in the soil, such as pH, need to be compared against farm business goals and timelines. iLime does well as a decision-making tool in assessing different sources, rates, and lime strategies for individual paddocks and rotations.
More work is needed to better understand different on-farm lime sources, particularly how their quality and distance from the coast impact on farm economics compared to limesand.
References
The Liebe Group. (2019). Locating and assessing on-farm lime sources. GRDC Publication.
Gazey, C., Davies, S. and Master R. (2014). Soil Acidity: A guide for WA farmers and consultants. Deaprtment of Agriculture and Food Western Australia. 2nd Edition.
Scott, B.J., Conyers, M.K., Fisher, R. and Lill, W. (1992). Particle size determines the efficiency of calcitic limestone in amending acidic soil. Aust. J. Agric. Res., 1992, 43, 1175-1185.
Peek, C., Shea, G., D’Antuono, M. (2019). The role of local carbonate sources and cultivation on the acid sandplain in the Eastern Wheatbelt. GRDC research update paper.
Van Gool, D. (2016). Identifying soil constraints that limit wheat yield in south-west Western Australia. Resource Management Technical Report 399. Department of Agriculture and Food Western Australia
Acknowledgments
The research undertaken as part of this project is made possible by the significant contributions of growers through both trial cooperation and the support of the GRDC, the author would like to thank them for their continued support.
Thanks to the Della Bosca family for hosting, providing one of the local lime sources, seeding and in-season management of the trial. Thanks to Hugh Irving and Brad Auld for providing limes sources. Thanks to James Fisher (Desiree Futures) and Jenni Clausen (DPIRD) for assistance with iLime. Acknowledgment to Glen Riethmuller and George Mwenda (DPIRD) for technical assistance throughout the year and DPIRD’s Merredin RSU staff for harvesting the trial.
Contact details
Ashleigh Donnison
Department of Primary Industries and Regional Development
1 Mitchell Street Merredin
0436 618 467
ashleigh.donnison@dpird.wa.gov.au
Paper Reviewed by
Bob French and Glen Riethmuller (DPIRD)
GRDC Project Code: DAW00256,