Chickpea agronomy update: Trangie adaptation experiments - 2018 and 2019
Author: Leigh Jenkins, NSW DPI, Trangie | Date: 29 Jul 2020
Take home messages
- Delaying sowing of chickpea from mid-April to late-May affected key phenological development stages. Time to emergence increased as sowing was delayed, resulting in both 50% flowering and 50% podding occurring successively later by calendar date, but with shorter durations of flowering and podding stages
- Despite these effects, there was no significant difference in mean yield between the four sowing dates from mid-April to late-May in either 2018 or 2019. Seed size remained relatively constant for each variety across sowing dates
- The potential new chickpea release CICA1521 (desi type) was shown to have similar or slightly earlier flowering and podding dates than the two current desi types PBA HatTrick and PBA Boundary.
Introduction
The ‘Adaptation of profitable pulses’ project (BLG112) conducted experiments in 2018 and 2019 to quantify and understand the phenological drivers of high value pulses in the central and southern environments of the northern grains region. The project focused on three environments (Wagga, Leeton/Yanco and Trangie) and two high value pulse crops; chickpea and lentil. The project also aimed to identify which genotypes are best adapted to each of the three agro-ecological environments and characterise crop phenology for current chickpea and lentil varieties.
This paper presents selected findings from the chickpea adaptation experiments conducted at Trangie Agricultural Research Centre (Trangie ARC) in 2018 and 2019. It also focuses on a potential new chickpea release, CICA1521, and compares it with three currently grown chickpea varieties in the north-west region of NSW.
Site details and methodology
The experiments were sown into a red chromosol soil at the NSW DPI Trangie Agricultural Research Centre (Trangie ARC) in Central West NSW. The field experiments conducted in both 2018 and 2019 were in below-average rainfall seasons (Table 1); with supplementary irrigation required in both seasons. The aim of the irrigations was to replicate a normal (decile 5) winter rainfall pattern in an otherwise dryland situation; rather than being fully irrigated (decile 9 plus) experiments. The site for each experiment was irrigated prior to and at sowing using dripper hose to ensure sufficient moisture for establishment. Overhead (lateral) irrigation was then applied in-crop after establishment as required to maintain the trials. Minimum and maximum temperatures were above long-term average records in 2018 and 2019 (data not shown).
Table 1. Monthly rainfall data for 2018 and 2019, compared to long-term average (LTA), at Trangie ARC (sourced via Bureau of Meteorology website).
(mm) | Jan | Feb | Mar | Apr | May | Jun | Jul | Aug | Sep | Oct | Nov | Dec |
|---|---|---|---|---|---|---|---|---|---|---|---|---|
2018 rainfall | 26.2 | 13.0 | 7.8 | 3.0 | 14.2 | 27.2 | 0.8 | 23.8 | 9.2 | 59.0 | 50.0 | 28.8 |
2019 rainfall | 58.0 | 16.8 | 17.6 | 0.0 | 18.6 | 5.8 | 9.8 | 3.2 | 5.4 | 2.2 | 20.2 | 2.2 |
LTA rainfall | 47.2 | 43.4 | 41.4 | 30.4 | 35.5 | 32.8 | 35.6 | 33.8 | 32.3 | 47.5 | 39.7 | 41.5 |
A split-block factorial design with three replicates was used in both field experiments. Treatments comprised four sowing dates (SD) sown as the main block with varieties randomised as plots within each sowing date block. Details of sowing dates for 2018 and 2019 are outlined in Table 2. Experiments were conducted using best management practices; however, it should be noted that both disease and insect pest pressure was minimal in both the 2018 and 2019 seasons (despite overhead irrigation). However, a standard level of preventative fungicides and insecticides were still applied in-crop as used commercially in this region. Phenology observations were recorded three times per week. Plant biomass cuts and pod samples were collected at maturity to assess harvest index and podding characteristics. Plots were harvested using a small plot header to determine grain yield and seed quality.
Table 2. Sowing and harvest dates, in-crop rainfall (mm) and in-crop irrigation (mm) details for Chickpea adaptation experiments conducted in 2018 and 2019 at Trangie ARC.
2018 | 2019 | |
|---|---|---|
Sowing dates (SD) | SD1: 18 April SD2: 2 May SD3: 16 May SD4: 30 May | SD1: 15 April SD2: 30 April SD3: 15 May SD4: 29 May |
Harvest date (plot header) | SD1 & SD2: 15 Nov SD3 & SD4: 27 Nov | SD1 – SD4 (all): 14-15 Nov |
In-crop rainfall (Apr-Nov) | 187.2 mm | 65.2 mm |
In-crop irrigation (Apr-Nov) | 85.0 mm | 87.0 mm |
1. Effect of sowing date on emergence in 2019
Emergence dates were not recorded in the 2018 experiment.
At Trangie in 2019, time to emergence (measured as days after sowing, DAS) was longer as sowing date was delayed, ranging from 6 days for SD1 (sown 15 April) to 25 days for SD4 (sown 29 May) (Figure 1). Chickpeas require a minimum threshold of approximately 115°C of accumulated growing degree days (GDD) to emerge (Whish, 2013). Hence, the delayed emergence with later sowing is related to decreasing soil temperatures in late autumn, requiring a longer time to satisfy the minimum GDD for emergence. There was no significant difference in emergence time between varieties across sowing dates (Figure 1).
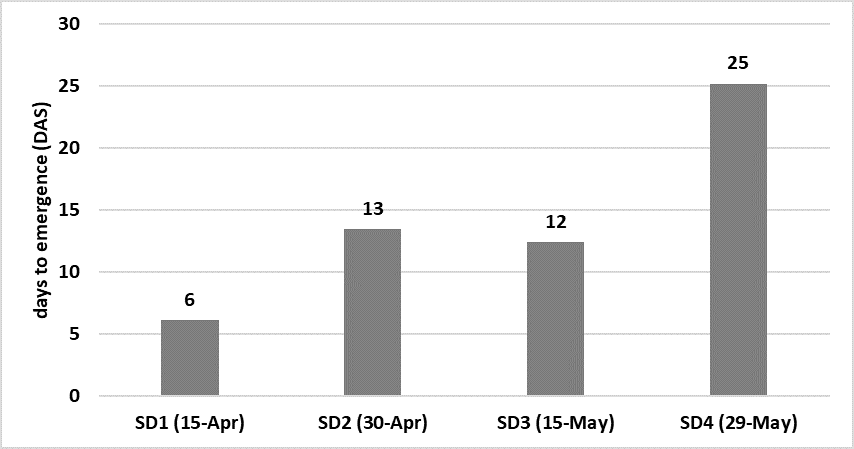 Figure 1. Effect of sowing date on emergence of chickpea sown at four sowing dates, Trangie ARC, 2019 (l.s.d. (P<0.001) = 0.5 days).
2. Effect of sowing date on phenology (flowering and podding response) in 2018
In the 2018 experiment, there were significant differences in the numbers of days to achieve 50% flowering between sowing dates (P=0.003), variety (P<0.001) and interaction between sowing date and variety (P=0.015). Across all varieties and sowing dates, the average time for chickpeas to reach 50% flowering was 98 days after sowing (DAS). There was no significant difference between SD1, SD2 and SD3, but days to 50% flowering was reduced at the latest sowing date in SD4 when averaged across all eleven chickpea varieties in the experiment (Figure 2).
In contrast with days to 50% flowering, the number of days to achieve 50% podding was significantly reduced as sowing date was delayed in 2018 (Figure 3). This difference was significant between sowing dates (P<0.001) and between varieties (P<0.001); but there was no interaction between sowing date and variety, showing that all varieties reacted similarly to the fortnightly delays in sowing date. Across all varieties and sowing dates, the mean number of days to reach 50% podding was 117 DAS, but this varied from 122 DAS for SD1 to 110 DAS for SD4.
In response to later achievement of 50% flowering and podding as sowing date was delayed, the duration of both flowering and podding were significantly reduced. Regardless of sowing date, physiological maturity was reached within a narrow window of approximately one week for all sowing dates in 2018, due to terminal heat and moisture stress. Flowering duration was significantly reduced (P<0.001) from 56 days (SD1), to 45 days (SD2), then 38 days (SD3) and only 28 days (SD4) as sowing date was delayed. Podding duration was significantly reduced (P<0.026) from 58 days (SD1), to 50 days (SD2), then 43 days (SD3) and finally 39 days (SD4) as sowing date was delayed.
CICA1521, planned for release in spring 2020 and commercial production in 2021, is a desi type with medium size seed which will be well suited to northern NSW for yield, disease ratings and maturity. At Trangie in 2018 CICA1521 reached 50% flowering either at the same time (SD1) or earlier than PBA HatTrick and PBA Boundary (both mid-flowering desi types) and was 6 to 10 days earlier than Genesis™ Kalkee (a late flowering kabuli type) (Figure 2).
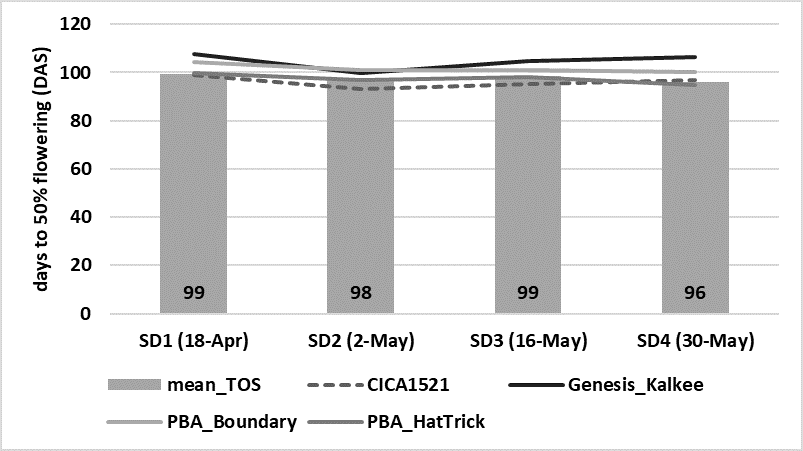
Figure 2. Effect of sowing date on number of days to 50% flowering, for four chickpea varieties sown at four sowing dates, Trangie ARC, 2018. Columns represent the mean of all eleven varieties sown in the 2018 experiment for each sowing date (TOS l.s.d. (P=0.003) = 1.851 days).
CICA1521 reached 50% podding at the same time as PBA HatTrick for SD1, but otherwise was considerably earlier by 3 to 12 days than PBA HatTrick, PBA Boundary and Genesis™ Kalkee at SD2, SD3 and SD4 (Figure 3).
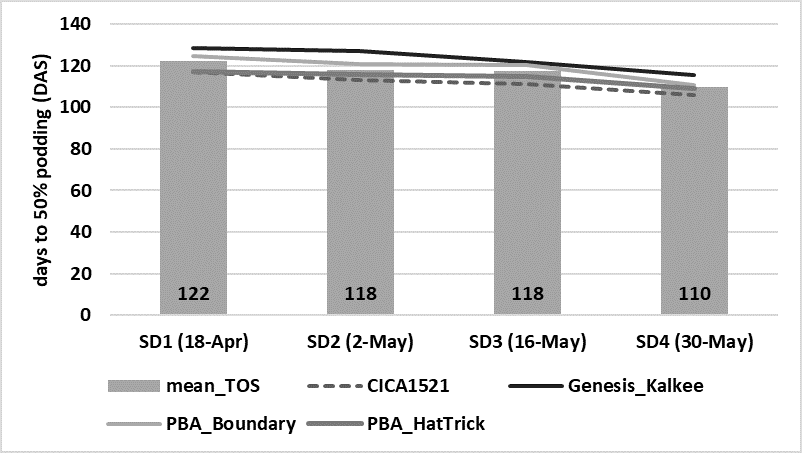
Figure 3. Effect of sowing date on number of days to 50% podding, for four chickpea varieties sown at four sowing dates, Trangie ARC, 2018. Columns represent the mean of all eleven varieties sown in the 2018 experiment for each sowing date (TOS l.s.d. (P<0.001) = 2.755 days).
3. Effect of sowing date on phenology (flowering and podding response) in 2019
In the 2019 experiment, there were again significant differences in the numbers of days to achieve 50% flowering between sowing dates (P<0.001), variety (P<0.001) and interaction between sowing date and variety (P<0.001). Across all varieties and sowing dates, the average time for chickpeas to reach 50% flowering was the same as in 2018, i.e. 98 DAS. There were significant differences between SD1, SD2 and SD3, but whilst days to 50% flowering was reduced from SD3 to SD4, SD4 was not significantly different to SD1 or SD2 (Figure 4).
In 2019, the number of days to achieve 50% podding showed a different response pattern (Figure 5) to that of 2018 (Figure 3). There were significant differences between sowing dates (P<0.001), variety (P<0.001); and also an interaction between sowing date and variety (P=0.002), showing that some varieties reacted differently than others to the fortnightly delays in sowing date. For example, the response of Genesis™ Kalkee was different to the other three varieties (Figure 5). Across all varieties and sowing dates, the mean number of days to reach 50% podding was 119 DAS (two days longer than in 2018); this varied from 121 DAS for SD1 to only 109 DAS for SD4. However, SD2 was the slowest to reach 50% podding at 127 DAS.
Flowering and podding durations were again both significantly reduced in 2019 as sowing date was delayed. Similar to 2018, this is likely due to physiological maturity being reached within a narrow window of approximately ten days regardless of sowing date in 2019 due to terminal heat and moisture stress under drought conditions. Flowering duration was significantly reduced (P<0.001) from 61 days (SD1), to 38 days (SD2), then 22 days (SD3) and finally 20 days (SD4) with delayed sowing. However, in 2019, despite reductions between sowing dates, the duration of podding was longer in 2019 than 2018 for each respective sowing date. Podding duration was significantly reduced (P<0.001) from 89 days (SD1), to 66 days (SD2), then 54 days (SD3) and finally 47 days (SD4) with later sowing.
At Trangie in 2019, CICA1521 reached 50% flowering earlier than the three other chickpea varieties in this comparison at SD1, SD2 and SD4; but was actually the latest to reach 50% flowering at SD3 (Figure 4). The reason for this different response in 2019 is not clear. All three desi varieties, CICA1521, PBA HatTrick and PBA Boundary, had the same 50% podding date at SD2, and within 3 to 4 days of each other for SD3 and SD4. However, CICA1521 reached 50% podding earlier than the other two desi varieties at SD1, and significantly earlier than Genesis™ Kalkee at all four sowing dates (Figure 5).
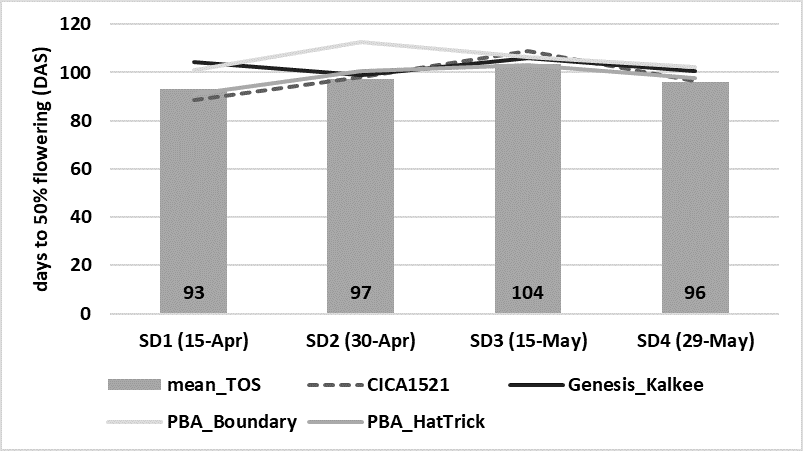
Figure 4. Effect of sowing date on number of days to 50% flowering, for four chickpea varieties sown at four sowing dates, Trangie ARC, 2019. Columns represent the mean of all eight varieties sown in 2019 for each sowing date (TOS l.s.d. (P<0.001) = 3.569 days).
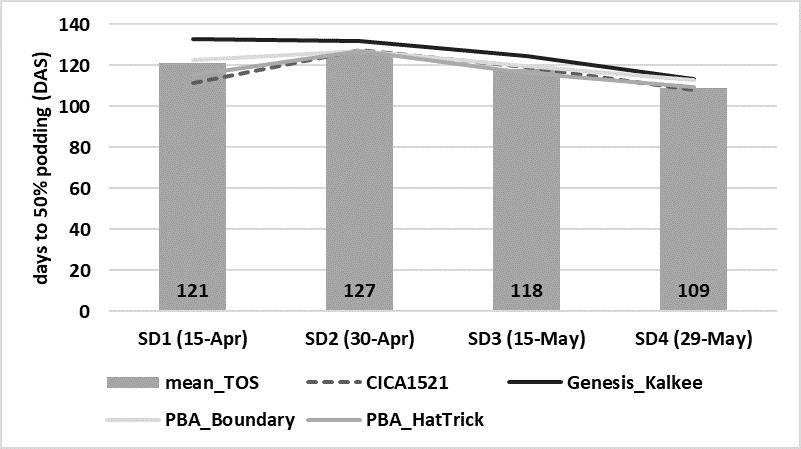
Figure 5. Effect of sowing date on number of days to 50% podding, for four chickpea varieties sown at four sowing dates, Trangie ARC, 2019. Columns represent the mean of all eight varieties sown in 2019 for each sowing date (TOS l.s.d. (P<0.001) = 2.629 days).
4. Effect of sowing date on grain yield and seed size in 2018
The mean grain yield across all sowing dates and varieties at Trangie in 2018 was 1.12 t/ha. There was no significant difference in mean yield between the four sowing dates, although SD1 yielded slightly higher (1.30 t/ha) than SD2, SD3 and SD4 (Figure 6). However, there were significant differences in mean yield (P<0.001) between varieties. The kabuli type Genesis™ Kalkee was significantly lower yielding than the three desi types in this comparison (mean yield 0.72 t/ha across all sowing dates). For the three desi varieties, average yields across all sowing dates ranged from 1.35 t/ha (PBA Boundary), 1.32 t/ha (CICA1521) and 1.09 t/ha for PBA HatTrick (Figure 6). CICA1521 had the highest yield of all four varieties in this comparison at SD2, although there was no significant interaction between sowing date and variety in this experiment.
Seed size is an important attribute of seed quality when marketing chickpeas. There was no significant difference in seed size (measured as 100 seed weight (g)) between the four sowing dates in this trial. This highlights that seed size is a relatively fixed constant for each chickpea variety. For the three desi types, the mean seed size averaged across all sowing dates was CICA1521 – 22.76 g, PBA HatTrick – 22.52 g, and PBA Boundary – 21.02 g per 100 seeds. As would be expected, kabuli types have much larger seed size than the desi types, with Genesis™ Kalkee averaging 33.56 g per 100 seeds across all sowing dates, but with no significant variation in seed size between sowing dates.
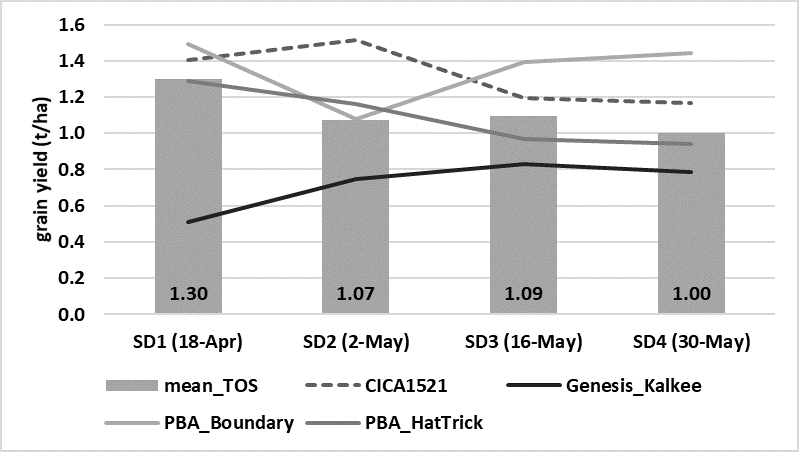
Figure 6. Effect of sowing date on grain yield, for four chickpea varieties sown at four sowing dates, Trangie ARC, 2018. Columns represent the mean of all eleven varieties sown in 2018 for each sowing date (TOS l.s.d. (P=0.097) n.s.; VAR (P<0.001) = 0.329 t/ha).
5. Effect of sowing date on grain yield and seed size in 2019
In 2019, the mean grain yield at Trangie, averaged across all sowing dates and varieties, was 1.69 t/ha (i.e. over 0.50 t/ha higher than the mean yield for 2018). As for 2018, there was no significant difference in mean yield between the four sowing dates (Figure 7), although mean yields for SD1 and SD2 appear to be slightly higher than SD3 and SD4. Differences in mean yield were significant between varieties (P=0.031), but not to the same degree as in 2018. Similarly, in 2019, the kabuli type Genesis™ Kalkee had the lowest mean yield across all sowing dates of 1.28 t/ha, although it was equivalent in yield to the three desi types at SD1 (Figure 7). For the three desi types, mean yields across all sowing dates were CICA1521 – 1.81 t/ha, PBA HatTrick – 1.69 t/ha, and PBA Boundary – 1.61 t/ha. As in 2018, CICA1521 had the highest yield of all four varieties in this comparison at SD2, although again there was no significant interaction between sowing date and variety in the 2019 experiment.
Seed size (100 seed weight) showed the same trends in 2019 as in 2018, albeit with slightly smaller overall seed size. Seed size remained relatively constant across all sowing dates for each particular variety, with no significant interaction between sowing date and variety. For the three desi types, the mean seed size averaged across all sowing dates was CICA1521 – 21.61 g, PBA HatTrick – 19.98 g, and PBA Boundary – 20.26 g per 100 seeds. The large seeded kabuli type Genesis™ Kalkee had a mean seed size of 31.31 g per 100 seeds, with no significant variation across sowing dates.
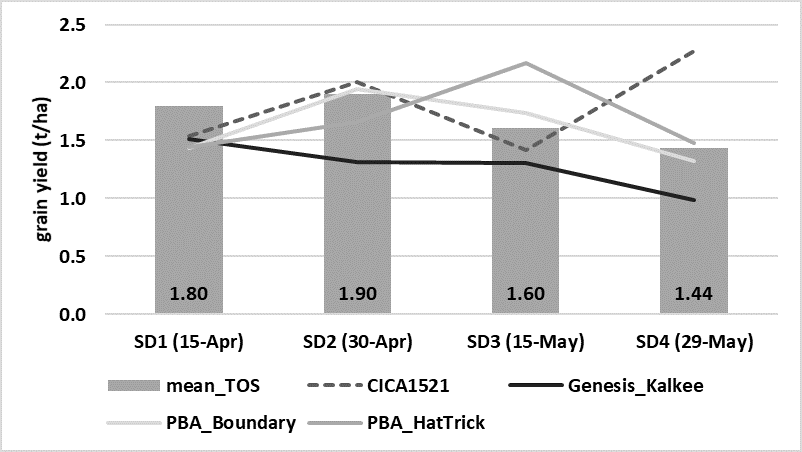
Figure 7. Effect of sowing date on grain yield, for four chickpea varieties sown at four sowing dates, Trangie ARC, 2019. Columns represent the mean of all eight varieties sown in 2019 for each sowing date (TOS l.s.d. (P=0.063) n.s.; VAR (P=0.031) = 0.455 t/ha).
Discussion
Previous chickpea time of sowing research has been conducted at Trangie ARC through both the Northern Pulse Agronomy Project (2010-2012) and the Northern Pulse Agronomy Initiative Project (2014-2016). These experiments targeted mid-May to late-June sowing dates and were largely focused on determining the likely yield penalty from later sowing of chickpeas. The consensus from these experiments was that 15 May was the optimum date for sowing chickpeas at Trangie and surrounding district and confirmed the same optimum sowing date of 15 May for the northern grains region recommended by Whish et al. (2007). At Trangie, sowing dates earlier than 15 May were compromised by greater exposure to disease risk in wet seasons (phytophthora root rot and ascochyta blight) and frost; whilst later sowings in June were compromised by a shorter flowering and podding window and increased exposure to heat and moisture stress during the grain fill period, resulting in significantly lower yields (Jenkins and Verrell 2015; Jenkins and Brill 2013).
The experiments conducted by the BLG112 project in 2018 and 2019 reported here were the first to evaluate earlier sowing of chickpeas in April, versus the previously promoted May sowing window. These experiments in 2018 and 2019 examined the impact of sowing date on emergence and phenology (flowering and podding date and duration), as well as yield and seed size. Whilst emergence dates were not recorded in 2018, emergence was significantly delayed in 2019 from 6 DAS when sown on 15 April (SD1) to 25 DAS when sown on 29 May (SD4). This was attributed to colder soil temperatures as planting was sequentially delayed, resulting in a longer period to satisfy the minimum cumulative growing degree days for emergence of chickpea plants.
The flow-on effect of later emergence can then be seen in delays to achieve both 50% flowering dates and 50% podding; whilst the duration of flowering and podding were reduced as sowing was delayed. In 2018, there was no significant difference between SD1, SD2 and SD3 in days to achieve 50% flowering, with only SD4 taking a shorter time. In 2019, the delays in sowing resulted in increasingly later dates to achieve 50% flowering for SD1, SD2, and SD3, with only SD4 being shorter than SD3 but equal to SD1 and SD2. Whilst the average number of days to achieve 50% flowering was 98 DAS in both 2018 and 2019, the fortnightly delays in sowing dates were almost equally matched by delays in time taken to achieve 50% flowering. The delay is likely due to satisfying the thermal time requirement of 994 C°d from emergence to 50% flowering growth stages of chickpea (Whish, 2013).
Likewise, delayed sowing resulted in increasingly later calendar dates to achieve 50% podding, but the actual length of time required (measured as DAS) to achieve 50% podding was significantly reduced between SD1 and SD4 in both 2018 and 2019. This can also be linked to plants satisfying the thermal time requirement to reach the podding stage, which is achieved in a shorter time frame for each consecutive sowing date as temperatures naturally become warmer in spring. The offset of this is that podding duration was ultimately terminated by moisture stress and physiological maturity of the plant at around the same time regardless of sowing date in 2018 and 2019, resulting in significantly shorter podding durations as sowing was delayed.
Despite all of the discussed impacts of delayed sowing of chickpeas on emergence, flowering dates and duration, and podding dates and duration, there was no significant difference in mean yield between the four sowing dates from mid April to late May in either 2018 or 2019. Before concluding that April sowing of chickpea could be equally successful as May sowing, it must be remembered that the 2018 and 2019 seasons were drought years, with little potential for disease (both phytophthora root rot and ascochyta blight) to develop throughout the season, as was the case in previous 2010 and 2011 experiments conducted at Trangie ARC. Hence, these 2018 and 2019 findings should be interpreted with some caution.
The 2019 experiment yielded on average almost 0.6 t/ha greater than the 2018 experiment (1.69 t/ha in 2019 vs. 1.12 t/ha in 2018). In-crop rainfall for the April-November 2019 season (65.2mm) was only one-third of that received for the same period in 2018 (187.2mm), with most of the 2018 rain falling in the grain fill period during October and November. In-crop irrigations during the April-November growing season were almost identical (85mm in 2018, 87mm in 2019). It is possible that the key difference in seasonal conditions which limited yield potential in 2018 compared with 2019 was the number and timing of frost events and associated low temperatures. Chickpea is particularly susceptible to cold conditions (both low and sub-zero temperatures) during flowering. Whilst floral initiation may commence at low temperatures, early flowers can be aborted due to infertile pollen, whereas subzero temperatures (frost) can cause flower, pod and seed abortion, if not outright death of plants (Clarke and Siddique, 1998). In 2018 there were 12 frost events (nine in July), from 11 July through to 30 August. In 2019 there were only seven frost events which were also milder than in 2018, from 20 June through to 27 August. The series of 2018 frost events in late July in particular were observed to result in both flower abortion and absence of further flower production, for a period of about three weeks across all sowing dates.
Conclusion
In summary, the risk factors involved in choosing between an April or May sowing of chickpeas must be evaluated against the likely seasonal prognosis each year. Early sowing, whether mid to late April or very early May, can result in greater exposure to disease risk in seasons with a wet winter. As evidenced at Trangie in 2010 and 2011, earlier sowing had associated issues with phytophthora root rot which cannot be managed by fungicide and also ascochyta blight, for which there is now greater varietal tolerance and in-crop control strategies available. The benefits of early sowing with more rapid emergence under warm soil temperatures were shown to result in increased flowering and podding durations in both 2018 and 2019, albeit off-set by increased exposure to frost risk as occurred in 2018. Alternatively, delayed sowing, whether late May or early June, was shown to increase the time to emergence of chickpea in 2019, and subsequently led to shorter flowering and podding durations in 2018 and 2019. Depending on spring conditions, this could result in an increased risk of exposure to heat and moisture stress during the critical grain fill period without adequate time for plants to compensate before physiological maturity occurs, and ultimately lower yield potential.
References and further reading
Clarke, H. and Siddique, K.H.M. (1998) Growth and Development. in The Chickpea Book, a technical guide to chickpea production (Bulletin 1326), Agriculture Western Australia.
Jenkins, L. and Brill, R. (2013) Effect of time of sowing and variety choice on chickpea yield – Trangie 2012. Northern Grains Region Trial Results Autumn 2013, NSW DPI.
Jenkins, L. and Verrell, A. (2015) Chickpea and mungbean research to maximise yield in northern NSW. Proceedings, Coonabarabran GRDC Grains Research Update (Advisors), 25-26 Feb 2015.
Matthews, P., McCaffery, D. & Jenkins, L. (2020) Winter crop variety sowing guide 2020. NSW DPI Management Guide.
GRDC (2016) GrowNotes™ Chickpea Northern.
Pulse Australia (2013) Northern chickpea best management practices training course manual—2013. Pulse Australia Limited.
Whish, J. (2013) Key developmental stages of chickpea and their thermal time targets in Module 2, Plant Physiology, Northern chickpea best management practices training course manual—2013. Pulse Australia Limited.
Whish, J., Castor, P. and Carberry, P. (2007) Managing production constraints to the reliability of chickpea (Cicer arietinum L.) within marginal areas of the northern grains region of Australia. Australian Journal of Agricultural Research, 2007, 58, 396-405.
Acknowledgements
Project BLG112 was conducted through the Grains Agronomy and Pathology Partnership (GAPP) as a strategic partnership between GRDC and NSW DPI. The research undertaken as part of the “Adaptation of profitable pulses” project was made possible by the significant contributions of growers through both trial cooperation and the support of the GRDC. The author would like to thank both growers and GRDC for their continued support.
Thanks to Scott Richards, Liz Jenkins, and Joanna Wallace (NSW DPI, Trangie ARC) for technical assistance with field work, data collection and sample processing. Thanks also to Kelvin Appleyard (former NSW DPI Farm Manager) and farm staff at Trangie ARC for their cooperation in providing trial sites, paddock preparation and management for these experiments. This paper was reviewed by Steven Simpfendorfer (NSW DPI) prior to submission.
Contact details
Leigh Jenkins
NSW DPI, Trangie ARC, Trangie NSW
Mob: 0419 277 480
Email: leigh.jenkins@dpi.nsw.gov.au
Varieties displaying this symbol beside them are protected under the Plant Breeders Rights Act 1994
™ Trademark
GRDC Project Code: BLG112,
Was this page helpful?
YOUR FEEDBACK
