Fine tuning deep phosphorus and potassium management
Author: Doug Sands (Queensland Department of Agriculture and Fisheries), Prof. Mike Bell (University of Queensland), Dr. David Lester (Queensland Department of Agriculture and Fisheries) | Date: 19 Nov 2020
Take home message
- The re-application interval for the deep placement of phosphorus (P) and potassium (K) will depend on the most limiting nutrient and crop type
- Residual effects of deep P bands applied 5 years previously were still evident in the 2019 chickpea crop on a site with very low soil P status, with yield increases of 500 (20P) to 1000 (40P) kg/ha compared to sites where no deep P had been applied
- However, yield increases of a further 900 kg/ha were recorded when a 2nd deep P application was made during the preceding fallow, clearly augmenting the P supply from the residual P bands
- In contrast, there was no evidence of any residual benefits from deep K bands applied 3-5 years ago shown in chickpea crops at two low K sites, but yield increases of 500 kg/ha were recorded when K was re-applied during the preceding fallow
- Potassium-limited sites may require shorter re-application intervals than sites where the main limit is phosphorus
- Legume grain crops export more K/t grain than cereals, but cereals can quickly redistribute deep K back to surface soil layers in stubbles, due to their low rates of removal.
Introduction
Trial work carried out in 2019 on long term deep banded trial sites has revealed some new data that relates to the reapplication of deep banded phosphorus (P) and potassium (K). The original trial sites have been monitored for 4-6 years, evaluating the long-term benefit of one application of P or K over several cropping cycles. In late 2018, three of these trial sites had a fresh application of P or K added to selected treatments. This was done to evaluate the difference in crop production between the residual fertiliser bands and those where a re-application of deep banded fertiliser had been made.
Results from this season are then integrated with those from these sites over the full experiment cycle, and the implications are discussed for CQ farming systems more broadly. Findings from the longer-term farming systems site at Emerald are used to provide further context.
Experimental outline
This paper discusses the results of two experiments in which chickpea crops were grown in the 2019 winter season in Central Queensland (CQ), with both sites having re-application of both deep P and K bands.
Experiment 1 – Dysart long term nutrition site
Phosphorus trial
Originally, seven unique treatments were applied in August of 2013 (Table 1). These treatments consisted of a Farmer Reference (FR) treatment (existing practice on that property), and six treatments that were deep ripped. Four of the ripped treatments received background fertiliser to supply nutrients that might otherwise limit responses to P (80 kg nitrogen (N)/ha, 50 kg of K/ha, 20 kg sulfur (S)/ha and 0.5 kg of zinc (Zn)/ha), while the other two treatments did not receive any extra K or S fertiliser. All ripped plots received one of four P rates as deep bands applied at 20-25 cm deep and 50 cm apart. Rates were 0, 10, 20, and 40 kg of P/ha applied as MAP. The four P rates were applied in the ripped plots with all additional nutrients, but only the 0P and 40P treatments were applied to plots without additional K and S background fertiliser. Plots were eight metres (m) wide by 32 m long and the fertiliser bands were placed in the same direction as the old stubble rows. There were six replicates making a total of 48 plots for the trial. Treatments are outlined in Table 1.
In 2019, plots that had received the four original P treatments (0, 10, 20 and 40 kg P/ha) were split and a fresh 30 kg P/ha was applied using a similar placement strategy to the original 2013 applications (Table 1), although the implements and tractors were different and it is most likely the residual bands and the re-application bands were positioned slightly offset to each other. Additional background fertiliser was applied at the same time; 50 kg K/ha (granular) and 90 kg N/ha (liquid). The half of the plots that received no additional P were also ripped with the same amounts of background fertiliser applied (N and K). The original treatments that previously had no background fertiliser applied (0P-KS, 40P-KS) except N and Zn, were also split and had extra P applied (30kg/ha) to one half of the plot (Table 1). These treatments had an extra 90 kg N/ha applied to both sides of the plot while they were being ripped, however received no K or S. The original farmer reference plots (FR) were left untreated and had no ripping.
Starter fertiliser was applied by liquid injection with the seed at planting (10 L/ha Ammonium Polyphosphate,10-34-0, plus 3 L/ha Foundation™). This starter rate was split in the P trial so that all treatments could have a ‘with’ and ‘without’ starter treatment, effectively doubling the number of plots assessed. Kyabra chickpea was planted at 50 kg/ha on 10 May 2019 into good moisture with plant available water content (PAWC) of 176 mm two weeks after planting. The crop received 41 mm of in-crop rainfall, all before flowering.
Potassium trial
This trial was established in a similar fashion to the P trial outlined above. Different rates of K were applied in the deep bands and P was substituted for K in the background fertiliser applications (Table 1). The original trial had seven unique treatments applied in August of 2013, with a FR (unripped) treatment, four rates of K that received the complete background fertiliser mix ( 0, 25, 50, 100 kg of K/ha) and two treatments that received 0 or 100 kg K/ha but without P and S in the background fertiliser mix.
In 2019 the four original K treatments (0, 25, 50 and 100 kg K/ha) had their plots split and 50 kg K/ha was applied using a similar strategy as outlined for the P trial (Table 1). Additional background fertiliser supplying 30 kg P/ha and 90 kg N/ha was applied at the same time, with and without the fresh K application in the respective sub-plots, while the FR plots were not tilled and received no additional background nutrition (Table 1). The original treatments that had no P and S applied in the background fertiliser mix (0K-PS, 100K-PS) were treated similarly this time, receiving only the additional 50 kg K/ha.
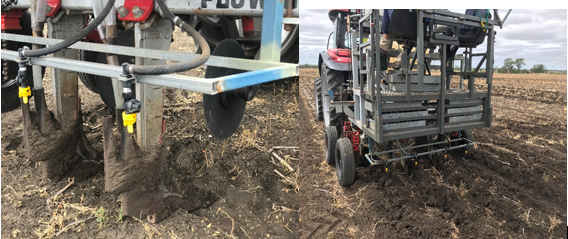
Table 1. Summary of extra nutrient application rates and change of treatment labels after re-application of fertiliser rates in January 2019 for P and K trials at the Dysart site.
Trial | Original treatment labels (2013) | New treatment labels (2019) | Additional N rate | Additional P Rate | Additional K rate | Additional S rate | Additional Zn rate |
|---|---|---|---|---|---|---|---|
Phosphorus (P) | 0P | 0P+30P | 90 | 30 | 50 | 0 | 0 |
0P | 90 | 0 | 50 | 0 | 0 | ||
10P | 10P+30P | 90 | 30 | 50 | 0 | 0 | |
10P | 90 | 0 | 50 | 0 | 0 | ||
20P | 20P+30P | 90 | 30 | 50 | 0 | 0 | |
20P | 90 | 0 | 50 | 0 | 0 | ||
40P | 40P+30P | 90 | 30 | 50 | 0 | 0 | |
40P | 90 | 0 | 50 | 0 | 0 | ||
OP-KS | 0P-KS+30P | 90 | 30 | 0 | 0 | 0 | |
0P-KS | 90 | 0 | 0 | 0 | 0 | ||
40P-KS | 40P-KS+30P | 90 | 30 | 0 | 0 | 0 | |
40P-KS | 90 | 0 | 0 | 0 | 0 | ||
FR | FR | 0 | 0 | 0 | 0 | 0 | |
Potassium (K) | 0K | 0K+50K | 90 | 30 | 50 | 0 | 0 |
0K | 90 | 30 | 0 | 0 | 0 | ||
25K | 25K+50K | 90 | 30 | 50 | 0 | 0 | |
25K | 90 | 30 | 0 | 0 | 0 | ||
50K | 50K+50K | 90 | 30 | 50 | 0 | 0 | |
50K | 90 | 30 | 0 | 0 | 0 | ||
100K | 100K+50K | 90 | 30 | 50 | 0 | 0 | |
100K | 90 | 30 | 0 | 0 | 0 | ||
0K-PS | 0K-PS+50K | 90 | 0 | 50 | 0 | 0 | |
OP-KS | 90 | 0 | 0 | 0 | 0 | ||
100K-PS | 100K-PS+50K | 90 | 0 | 50 | 0 | 0 | |
100K-PS | 90 | 0 | 0 | 0 | 0 | ||
FR | FR | 0 | 0 | 0 | 0 | 0 |
Note: The ‘new treatment labels’ will be used in the results section to present data rather than the ‘original treatment labels’.
Experiment 2 – Dululu long term nutrition site
The original P and K trials were established at this site in late 2015, with the first crops sown in 2016 winter season. Deep P and K bands were re-applied after harvest of the 2018 winter crop.
Phosphorus trial
A similar set of seven treatments were established in this trial as in the P trial at Dysart, with a FR and six other ripped treatments receiving one of four rates of deep P ((0, 10, 20, and 40 kg of P/ha) and background fertiliser with or without potassium (K) and sulphur (S) (0P-KS and 40P-KS). These are listed in Table 2. Deep applications were made in a similar fashion to Dysart, but plots were split to receive one of two starter P treatments (with or without starter P). Plots at this site were six m wide and 28m long, each treatment had four replicates and the trial consisted of 64 plots in total.
The trial was modified on the 10 December 2018 with the re-application of some deep bands of fertiliser. As the trial had not run as long as the one at Dysart, not all plots were split to ‘with’ and ‘without’ a fresh deep P application. Instead, only the plots with the original rate of 10 kg P/ha applied had another 30 kg P/ha applied, to provide a ‘fresh deep P’ benchmark to gauge the residual effectiveness of the original deep P applications. All originally ripped plots were re-ripped and received additional background fertiliser of 90 kg N/ha and 50 kg K/ha, except for the 0P-KS and 40P-KS treatments, where the K was deleted from the background fertiliser blend. As at Dysart, the FR treatment received no deep ripping and no additional background fertiliser. Plot labels for each of the seven treatments were modified to represent their new status (see Table 2).
Kyabra chickpea was planted at 50 kg/ha on 10 May 2019 into a profile with plant available water content (PAWC) of only 77 mm to a depth of 120cm (50-60% full). The crop was deep planted at a depth of 15cm as there was no planting rainfall for this crop, and the site only received 34 mm of in-crop rainfall, all before flowering. Crop performance was therefore strongly limited by available water.
Potassium trial
Treatments were again similar to those described in the K trial at Dysart, with treatments listed in Table 2. The re-application strategy was similar to that employed in the P trial at this site, with the plots receiving the initial application rate of 25 kg K/ha receiving a further 50 kg K/ha in addition to background fertiliser that consisted of 90 kg N/ha and 30 kg P/ha. All other treatments were ripped down to 25cm and had background N and P fertiliser applied but no extra K was added, with the exception of the original 100K-PS and 0K-PS treatments, that only received additional N but no P. The FR plots were again left completely undisturbed. There were no split starter P treatments in the K trial, so every plot received starter P (Granulock Z® @ 40 kg/ha) at sowing.
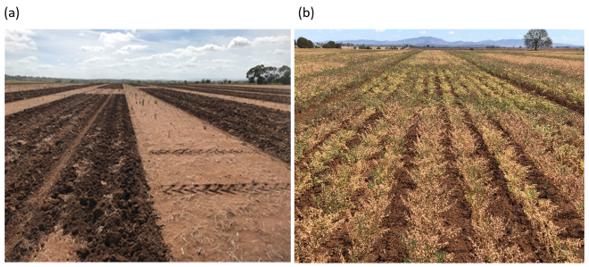
Figure 2. Images of (a) Re-application of plots in December 2018 at Dululu, and (b) the chickpea nearing maturity in 2019
Table 2. Summary of nutrient application after re-application in December 2018 for Dululu trial site. Take note the new treatment labels will be used in the results section.
Trial | Original treatment label (2015) | N rate (kg/ha) | P rate (kg/ha) | K rate (kg/ha) | S rate (kg/ha) | Zn rate (kg/ha) | New treatment label (2018) | N rate (kg/ha) | P rate (kg/ha) | K rate (kg/ha) |
|---|---|---|---|---|---|---|---|---|---|---|
Phosphorus | 0P | 80 | 0 | 50 | 20 | 0.5 | 0P+NK | 90 | 0 | 50 |
10P | 80 | 10 | 50 | 20 | 0.5 | 10P/30P+NK | 90 | 30 | 50 | |
20P | 80 | 20 | 50 | 20 | 0.5 | 20P+NK | 90 | 0 | 50 | |
40P | 80 | 40 | 50 | 20 | 0.5 | 40P+NK | 90 | 0 | 50 | |
0P-KS | 80 | 0 | 0 | 0 | 0.5 | 0P-KS+N | 90 | 0 | 0 | |
40P-KS | 80 | 40 | 0 | 0 | 0.5 | 40P-KS+N | 90 | 0 | 0 | |
FR | 0 | 0 | 0 | 0 | 0 | FR | 0 | 0 | 0 | |
Potassium | 0K | 80 | 20 | 0 | 20 | 0.5 | 0K+PN | 90 | 30 | 0 |
25K | 80 | 20 | 25 | 20 | 0.5 | 25K/50K+PN | 90 | 30 | 50 | |
50K | 80 | 20 | 50 | 20 | 0.5 | 50K+PN | 90 | 30 | 0 | |
100K | 80 | 20 | 100 | 20 | 0.5 | 100K+PN | 90 | 30 | 0 | |
0K-PS | 80 | 0 | 0 | 0 | 0.5 | 0K-PS+N | 90 | 0 | 0 | |
100K-PS | 80 | 0 | 100 | 0 | 0.5 | 100K-PS+N | 90 | 0 | 0 | |
FR | 0 | 0 | 0 | 0 | 0 | FR | 0 | 0 | 0 |
Data collection for both trials included emergence plant counts, with starting soil water and starting nitrogen (N) measurements taken shortly after emergence. Total dry matter cuts were taken at physiological maturity and yield measurements were taken with a plot harvester when commercial harvesting started in the same paddock. A grain sample was kept from the plot for nutrient analysis. Both the dry matter samples and the grain samples were analysed for nutrient contents.
Results
Both sites received little effective in-crop rain, and so yield potentials were limited by available water. This deficit was exacerbated at the Dululu site by the lower PAWC at sowing (77 mm v 176 mm at Dysart), with the maximum yields at the Dysart site (3500 kg/ha) greatly exceeding those at Dululu (1300-1400 kg/ha). Despite these differences, there were strong response to deep P and K at both locations, and these are discussed below.
Experiment 1 – Dysart long term nutrition site
Phosphorus (P) trial
The grain yield data (Figure 3) shows large yield responses to both the original deep P treatments, and to the re-application of 30 kg P/ha prior to this crop.
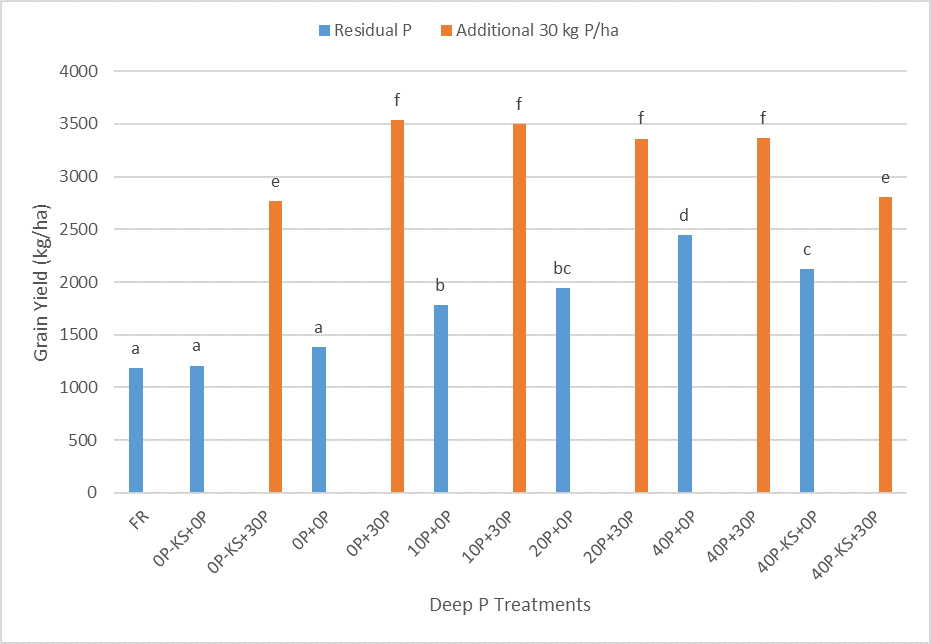
Figure 3. Mean grain yields (kg/ha) across all deep phosphorus treatments in 2019 Dysart chickpeas. Blue columns are residual P treatments, orange columns are treatments with additional 30 kg P/ha applied. Means with the same letters are not significantly different at the 5% level (lsd = 251.7).
The results can be categorised as follows:
- There were similar yields recorded for the FR treatment and the re-ripped 0P treatments with or without extra K and S applications, ranging from 1,200-1,400 kg/ha. The lack of response to ripping and basal nutrients (N, or N and K) suggest that another factor (P) was the primary limit to productivity at this site
- There were significant yield increases of 500-1,000 (40P) kg/ha with the residual deep bands applied at 20 kg P and 40 kg P/ha, respectively, despite the original application being made back in 2013, and after five crop seasons. If no K had been applied in the original deep bands with the 40 P treatment, yields were reduced from 2,450 to 2,100 kg/ha – a small but statistically significant drop that suggests availability of K was a secondary limitation to yields at this site, evident only when P availability had been first improved
- The re-application of an additional 30 kg P/ha prior to this crop season saw a further increase in potential yields to 2,700-2,800 kg/ha without background K, and to 3,400-3,500 kg/ha when K was also re-applied. These responses again support the primacy of the P limitation at this site, but also indicate a growing importance of K limitations once adequate P was available to meet crop demands. The 300-350 kg/ha drop in yields without K seen in the residual P treatments had now increased to 700-800 kg/ha with the improved P availability arising from the fresh re-application.
The strong P responses at this site were consistent with results from the previous five crops grown on the site (2014, 2015 and 2016 sorghum, 2017 chickpeas and 2018 sorghum), but the magnitude of the response to the re-application was a little surprising given the strong residual effects that were still evident from the original applications – especially the 40P treatment. We have observed that the response to increasing original P rates has changed with time after application. In the first three sorghum crops there was no difference in yields between the 20 and 40 kg P/ha applications, but in subsequent crop years a better relative response was increasingly evident with 40P rather than 20P, and yields effectively increased in a linear response to increased P rate. While this linear response is still evident in this 6th crop season, it is clear that crops could respond to more P than was available from the residual bands and that further P from a re-application was needed. The relative increase in yield response in relation to the residual bands raises the question of whether an earlier re-application could have been economically beneficial, and this can only be answered by future research. However, the cost to re-apply 30 kg/ha of P, along with the 50 kg/ha K and 90 kg/ha N in the background fertiliser, was roughly $260/ha. It is very clear that the re-application has paid for itself and delivered a profit in the year of application (assuming $650/t on-farm price).
Dry matter produced by the chickpea crop effectively mirrored what was seen in grain yields in Figure 3, but the patterns of P concentration in that biomass were the real indicator of P responses in this crop. Increased crop growth in response to increasing P availability meant that biomass P concentration remained low and relatively unresponsive to increasing P availability from the residual deep P bands, only increasing significantly once the re-application of the additional 30 kg P/ha was made. This suggests that despite improved growth and yield with increasing original rates of deep P, crop P status really only improved once the re-application was made. If the combination of dry matter production and P concentration are combined into crop P uptake and data are considered using the same categorisation of treatment response used for grain yields (i.e. no deep P, increasing rates of residual deep and then residual deep P with fresh P re-applications), we see crop P uptake increasing from 1.5 kg P/ha to 3 (20P) or 5 (40P) kg P/ha to a maximum of 8.5-9 kg P/ha with re-application. These are huge relative changes in crop P uptake and can be seen to clearly drive the yield responses at this site (Figure 4). Each additional kg of P taken up in crop biomass has resulted in a further 289 kg grain production, and there is no real evidence that even the re-applied treatments have completely exhausted the potential yield response. The response was effectively linear across all treatments at the site, so it was possible that if more in-crop rainfall had been received, grain yields could have been improved even further.
Selected treatments were soil cored after harvest to enable estimates of crop water use efficiency (CWUE) to be made for the respective treatments, assuming zero runoff and drainage (Table 3). The data produced were from a limited number of cores, and while they may not be precise, indicate the strong effects of improved P availability on CWUE. Industry standards for chickpeas suggest that 8 – 12 kg grain/ha/mm water use is an acceptable range of CWUE (Best Management Guide, 2020. www.pulseaus.com.au). However, data from this site show very strong response in CWUE to improved P availability, increasing from a low of 8.2 kg/ha/mm with no deep P, to 12.3 kg/ha/mm in the residual 40P treatment to as much as 18-20 kg/ha/mm with the re-applied deep P. These responses clearly show the potential improvements in resource use efficiency that can be made when nutrient constraints like P are rectified.
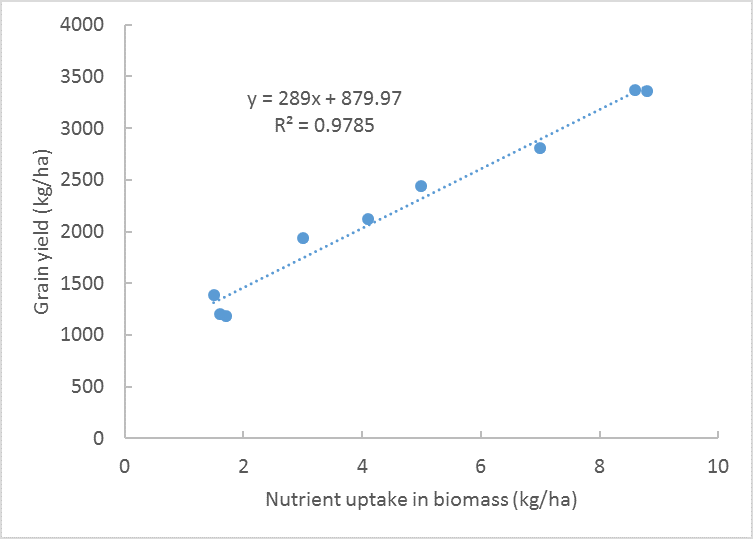 Figure 4. Scatter plot of grain yields versus plant uptake of phosphorus across selected deep phosphorus treatments.
Table 3. Mean grain yields and associated crop water use efficiency (CWUE) calculations for selected deep phosphorus treatments.
Deep P treatments | Grain yield (kg/ha) | Estimated CWUE (kg/mm/ha) | |
|---|---|---|---|
Residual P Response | FR | 1186 | 8.2 |
0P-KS+0P | 1206 | ||
0P+0P | 1384 | 8.2 | |
10P+0P | 1779 | ||
20P+0P | 1942 | ||
40P+0P | 2442 | 12.3 | |
40P-KS+0P | 2124 | ||
Additional P Response | 0P-KS+30P | 2769 | |
0P+30P | 3537 | 20.3 | |
10P+30P | 3497 | ||
20P+30P | 3359 | ||
40P+30P | 3366 | 17.7 | |
40P-KS+30P | 2805 |
Potassium (K) trial
The yield responses in the K trial (Figure 5) contrasted noticeably to those from the P trial in a number of important aspects, with four yield classes related to interacting effects of K and P.
- The lowest yielding cohort of treatments (1,400-1,600 kg/ha) consisted of plots without any P input (i.e.. FR, 0K-PS with or without a fresh 50K application and 100K-PS with no reapplied K), with tillage and background nutrients (other than P) having no impact on yields
- There was a slight but statistically significant response to the K re-application in the 100K-PS treatment (1,950 kg/ha), but this response was small relative to other effects
- All plots receiving basal P applications, but no re-applied K produced similar and much higher yields (2,900-3,200 kg/ha), reflecting the dominance of P limitations at this site. Yields effectively doubled when deep P was applied. Across this range of treatments, there was no evidence of any significant residual effect of K applied in 2013
- There was a further significant yield increase when K was reapplied to plots that had received deep P, with yields increasing to 3,400-3,500 kg/ha. While statistically significant, these effects were much smaller than responses to deep P.
The response to K at this trial site has always been significantly smaller than the P response, but it has been consistent over the previous five crops with 6-12 % increases in grain yield in addition to that derived from deep P application. In 2019, the re-application of K has produced 8-16% increases in grain yield compared to treatments relying on residual K, with the largest relative effect occurring where yields were lowest (i.e. in the absence of deep P in the 100K-PS treatment). The costs of deep band re-application were clearly exceeded in this trial, and although the vast majority of the net return from re-application was driven by the P yield response (i.e. 1,400-1,500 kg/ha yield increases, worth approx. $950/ha), the additional 300-400 kg/ha yield response to the re-application of 50 kg K/ha would have more than offset the approx. $100/ha additional fertiliser costs. If K had not been added to the re-application and the addition of P continued to increase yields, then the severity of K deficiency would increase in relative terms, as would the difficulty in ensuring that application strategies were able to ensure crops could acquire enough K to meet demands.
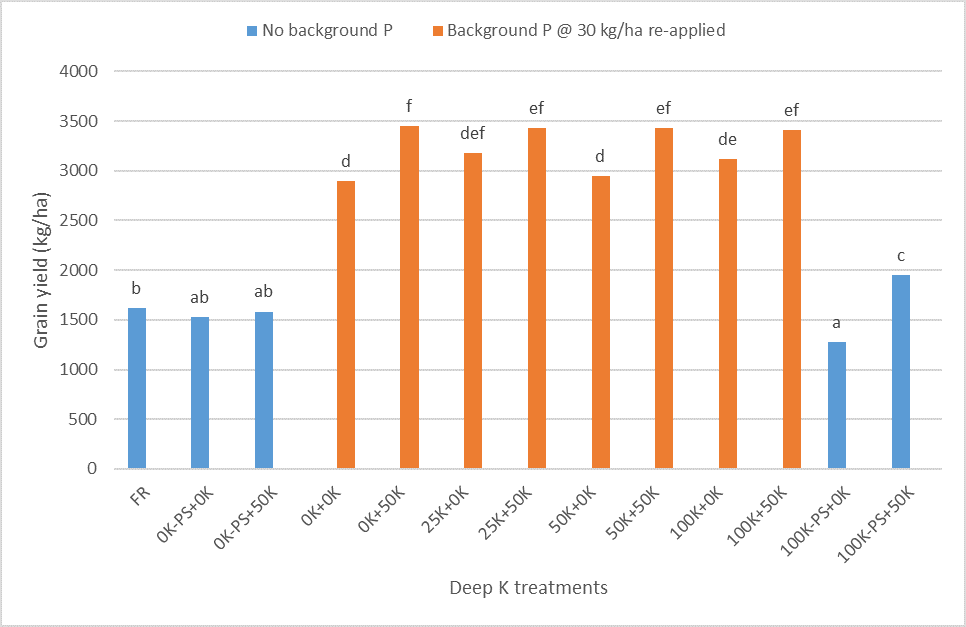 Figure 5. Comparison of mean grain yields (kg/ha) in K trial split between treatments with (orange) and without (blue) background phosphorus (+30kg/ha). Means with the same letters are not significantly different at the 5% level (lsd=298).
The apparent lack of any residual benefit from the original deep K applications, even at rates of 100 kg K/ha, suggests that the frequency of re-application of K may need to be higher than that of P. Part of the reason for this may be the much larger amounts of K taken up in crop biomass (Figure 6), even if the majority of this is retained in stubbles that are returned to the field. The K returned in residues leaches out easily enough but gets held in surface soil layers and does not leach back into the subsoils from which it was removed. The additional K uptake across the treatment range in 2019 was as much as 40 kg K/ha, compared to an additional 7 kg P/ha in the deep P trial (Figure 4), illustrating the potential to rapidly deplete a deep K application and shorten the likely duration of any residual benefits from a deep K application.
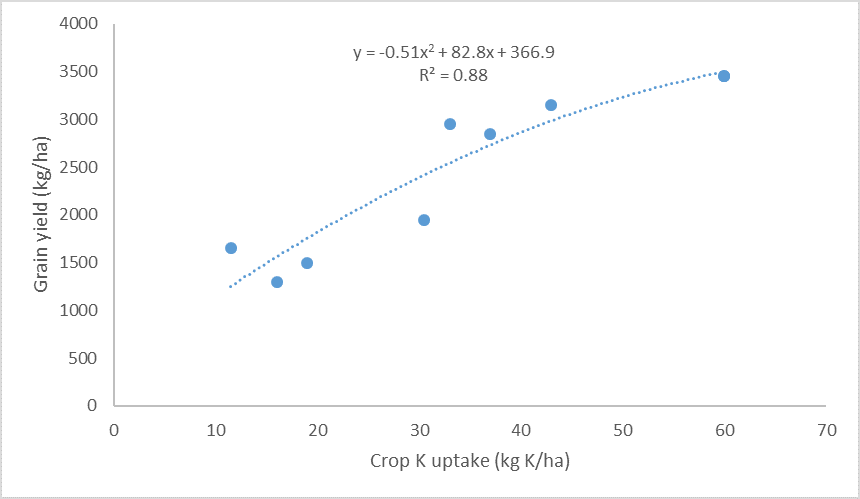 Figure 6. Scatter plot of grain yields versus plant uptake of potassium (K) for a cross section of treatments in the K trial.
Experiment 2 – Dululu long term nutrition site
Phosphorus (P) trial
Despite the lesser water availability at this site, with impacts on both the site maximum yields and the size of the treatment responses, there were significant effects of both the residual deep banded treatments applied in 2015, and an additional response to re-application of deep P and the supporting background nutrients. There were again four distinct yield categories.
- Lowest yields (410 kg/ha) were recorded in the FR treatment, with no tillage, background nutrients or deep P.
- Yields effectively doubled (850 kg/ha) in response to tillage with or without either deep P or deep K in isolation
- Additional responses were recorded to residual deep P bands (1,060 kg/ha), with no significant differences between the 20P or 40P application rates
- A further significant yield response was recorded from the re-application of deep P (1,310 kg/ha), with these yields more than 3 times those recorded in the FR treatment.
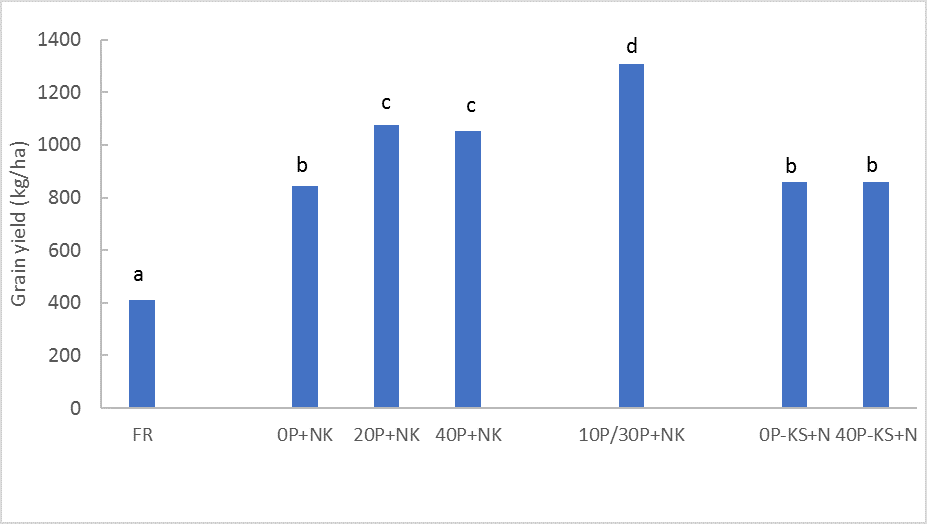
Figure 7. Mean grain yields (kg/ha) for treatments in the Dululu P trial. Means with the same letters are not significantly different at the P=0.05 level (lsd=195)
While the combined responses to deep banded applications would have made a significant improvement in returns from this cropping season (0.9 t/ha at $650/t), the marginal increases in yields in response to the re-application (only 250 kg/ha above that of the residual effects of deep P bands) would have meant that the application costs of $290/ha for deep P and background nutrients would not have been met in this first crop. This trial site was only in its fourth year of production and there had only been three crops harvested off this site before 2019 (wheat 2016, chickpeas 2017, mung beans 2018). A re-application after 3 years was a smaller interval than was first thought to be required, so a large yield response was not expected. In this situation a shorter interval between deep applications will have an impact on the long-term economic return from this site, although further monitoring would be required to fully assess the long-term economic gain.
It is worth noting that this crop was deep planted (15 cm) on an average soil water profile of 77 mm of PAWC with only 34 mm of in-crop rainfall. Grain yields were always going to be modest and restrict the size of the yield response to deep applied nutrition. The extent to which a lack of available moisture has limited the crop response to improved P acquisition at Dululu can be determined by comparing the response to increasing biomass P uptake at Dululu (shown in Figure 8) with that for Dysart (Figure 4). While crop P uptake in the FR treatments was similar at both sites (1.5-1.8 kg P/ha), the additional P uptake from the combination of residual and re-applied deep P was lower (5 v 7 kg P/ha) and the efficiency with which that extra P was used to produce grain yields was also lower (165 v 290 kg/kg P uptake) at Dululu. The latter is particularly evident for the reapplied P treatment, with the additional 2.9 kg P uptake compared to the residual deep P treatments only producing an additional 245 kg grain yield. This suggests that the crop was not able to utilise the extra P uptake and convert it into grain yield due to a lack of available water.
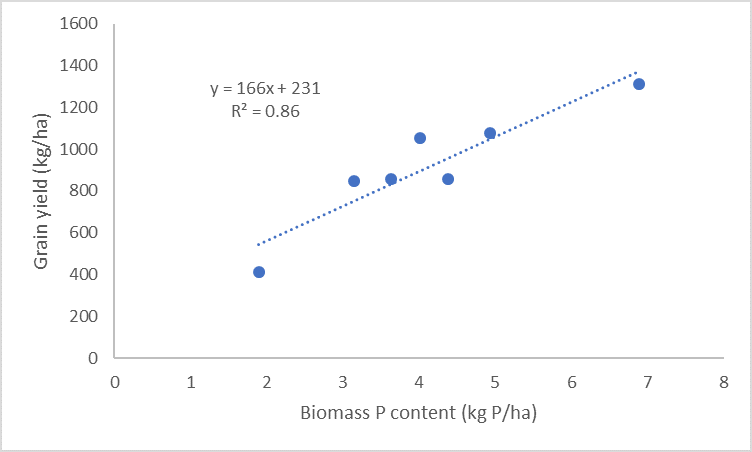
Figure 8. A scatter plot showing the relationship between biomass P uptake and chickpea grain yield (kg/ha) in the P trial.
Potassium (K) trial
The yield responses in the K trial (Figure 9) reflected the less dominant effect of the P constraint at this site, as well as the limitations imposed by a lack of available moisture.
- The lowest yields in the trial were again in the FR treatment (390 kg/ha), effectively the same as recorded in the FR treatment in the P trial at this site
- There was then a cohort of treatments that yielded significantly more than FR, but were not different to one another, averaging 940 kg/ha. These treatments represented individual effects of tillage and background N (0K-PS+N), tillage with background N and P (0K+PS+N) or tillage with background N, P and residual K (50 K+PN or 100K+PN)
- The highest yielding treatment (1,425 kg/ha) received re-applied K, in addition to background N and P (25K+50K+PN). The response to re-applied K in this treatment, but the lack of evidence for residual K effects in the original 50K or 100K treatments, was consistent with the apparent lack of residual effects from the initial K applications recorded at Dysart – despite this only representing the 4th crop in the sequence.
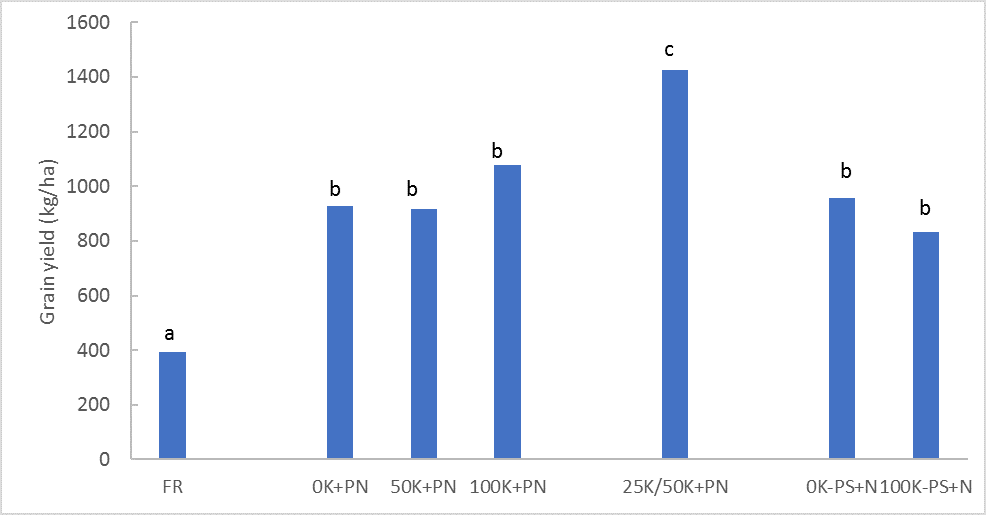 Figure 9. Mean grain yields (kg/ha) for treatments in the Dululu potassium (K) trial. Means with the same letters are not significantly different at the P=0.05 level (lsd=222)
The apparent lack of residual K effects on grain yields (Figure 9) were consistent with data on K uptake in crop biomass, with only 5-6 kg K/ha difference in crop uptake between the 0K+PN and the 100K+PN treatments – a difference that the relationship shown in Figure 8 suggests would produce a yield increase of only 150-160 kg/ha. This projected difference was less than needed to provide a statistically significant response, but was an accurate reflection of the trend in differences in harvested yields (Figure 9). The contrast with the additional yield and K uptake derived from the fresh K re-application was marked, with the 50 kg K/ha application resulting in an additional 14.5 kg K/ha crop uptake (+63%) and an additional 350 kg grain/ha (+33%) relative to the 100K+PN residual treatment (Figure 8). This suggests that additional K uptake and grain yields would have been achieved if enough residual K had still been available in the residual K bands.
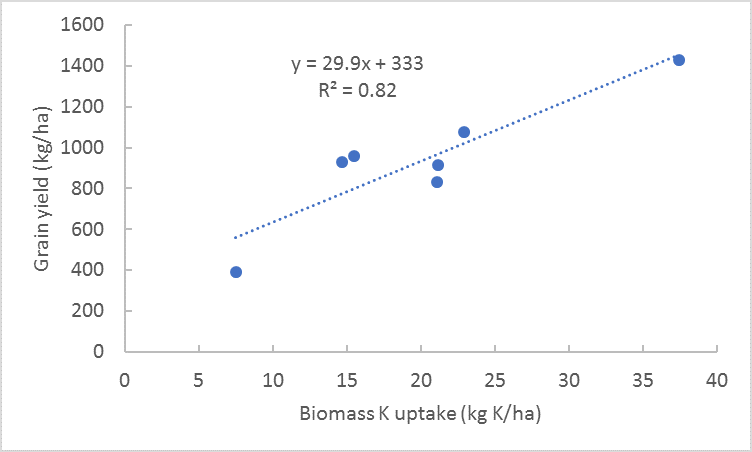 Figure 10. A scatter plot showing the relationship between biomass potassium (K) uptake and chickpea grain yield (kg/ha) in the K trial.
The Dululu site is one that has shown consistent evidence of dual (P and K) limitations. The cumulative additional grain produced in each treatment, using the FR treatment as a reference, are shown in Figure 11 (K) and Figure 12 (P). It is clearly evident that the response to the addition of only one of these nutrients (K in Figure 11 or P in Figure 12) constrain the yield response due to the limitation posed by the other limiting nutrient.
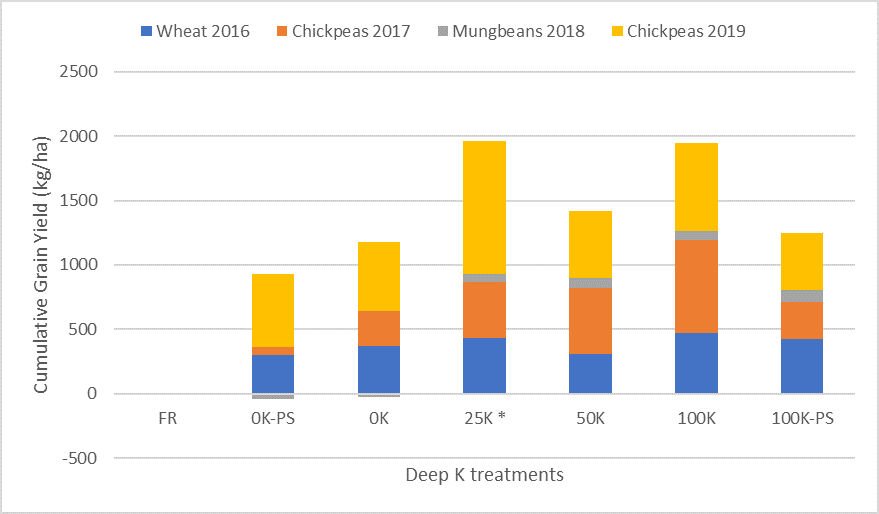 Figure 11. Mean accumulated grain yields (kg/ha) over the farmer reference (FR) treatment for all 4 crops (wheat 2016, chickpeas 2017, mungbean 2018 and chickpeas 2019) on the Dululu potassium (K) trial.
* Note: this treatment includes the responses from the re-application prior to the 2019 season.
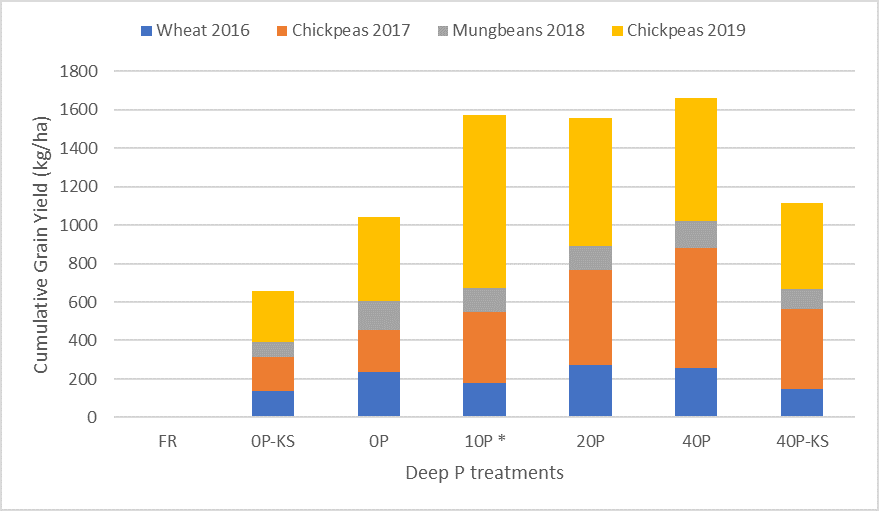 Figure 12. Mean accumulated grain yields over the farmer reference (FR) treatment for all 4 crops (wheat 2016, chickpeas 2017, mungbean 2018 and chickpeas 2019) on the Dululu phosphorus (P) trial.
*Note: this treatment includes the responses from the re-application prior to the 2019 season.
It is again interesting to note from these cumulative analyses the greatest cumulative yield gain has been in the residual 100K+PN and re-applied 25K+50K+PN treatments (~2,000 kg/ha additional grain produced), compared to the 20P+KN and 40P+KN treatments in the P trial (an average of 1,600 kg additional grain/ha). These differences may reflect the more rapid decline in available K in the later years of the P trial, as the background K in those deep P treatments was only applied at 50 kg K/ha in that trial – a rate that had clearly been exhausted before the 2019 season (Figure 9). This suggests that where K is a strongly limiting nutrient (as well as P), re-application may have to occur on a shorter time interval or larger amounts need to be applied in the first place.
Farming systems impacts on nutrition
The timing of re-application of P and K will depend on which nutrient is the primary limitation to yield, and the species of crop being grown. The tracking of nutrient removal rates in grain from a farming systems trial based at the Emerald research station shows chickpeas particularly, removing more P than cereal crops such as wheat and sorghum (Figure 13). This difference between chickpeas and cereals is even greater in relation to K removal rates(Figure 14).
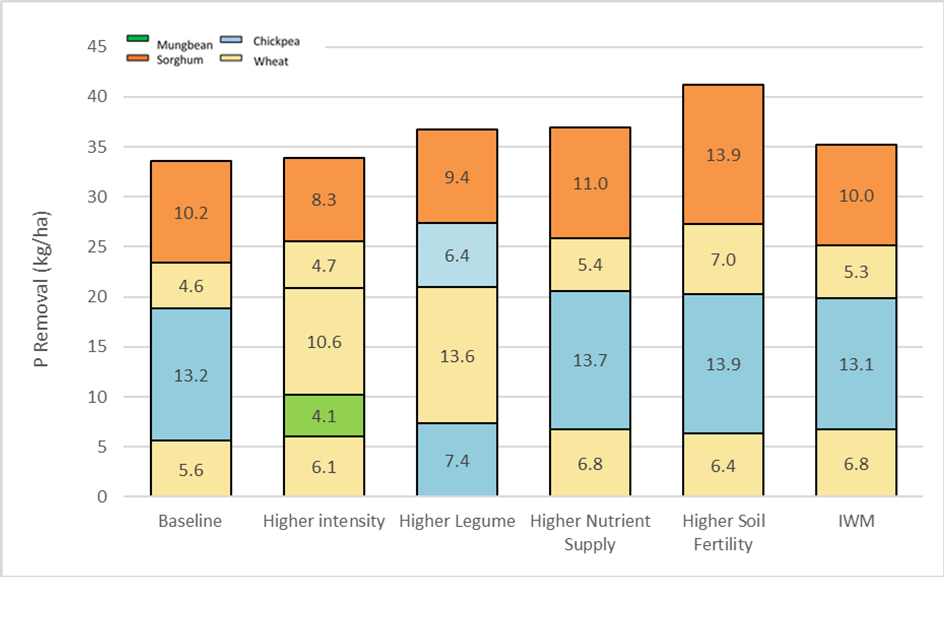 Figure 13. Removal of P (kg/ha) in grain from successive crops across 6 different farming systems.
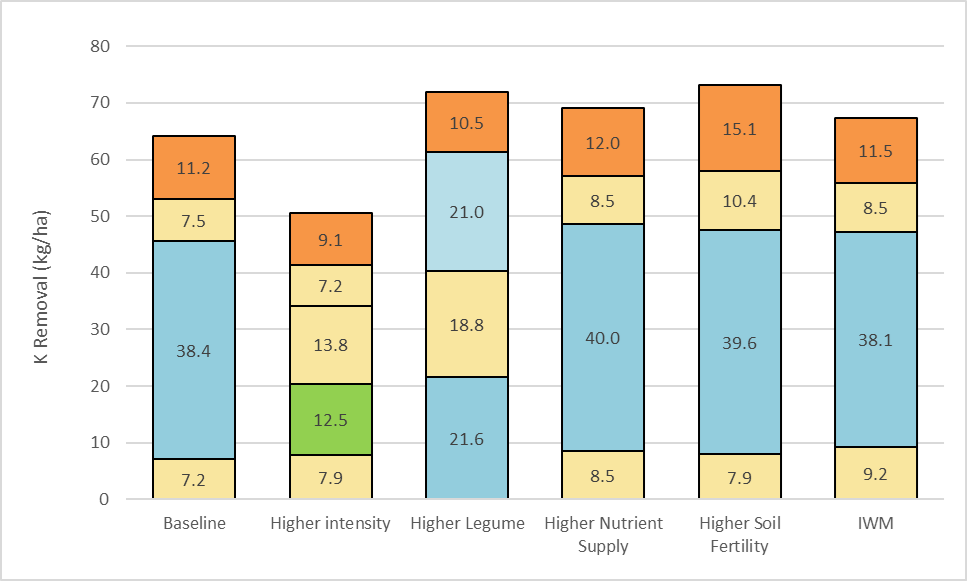 Figure 14. Removal of K (kg/ha) in grain from successive crops across 6 different farming systems.
This data highlights how crop rotations can impact the rate of nutrient depletion due to nutrient removal in grain. However, it is important to also remember that nutrient removal from subsoils is also a critical factor in these cropping systems. Even though cereal crops remove similar P but a lot less K in harvested grain (Figures. 13 and 14), they tend to often take up more K in crop biomass (simply because they grow more of it) and return the majority of it back to the soil surface in stubbles. That means the depletion of subsoil K is occurring to similar extents, regardless of the crops being grown. The replacement of K into deeper soil layers, as well as P, will be a critical success factor if systems are to remain sustainable.
There is growing evidence of limitations to the nutrient supply we can expect plants to obtain from deep bands. The bands require proliferation of roots around them if crops are to acquire the nutrients they need from the small soil volume that is fertilised. While they do this effectively, especially when there is some P in the band, this increased root proliferation in these zones uses soil water more quickly than in the rest of the soil profile. Once the nutrient rich band dries out, nutrients in the band become unavailable until bands rewet. There was good evidence of this from the 2019 season at both field sites in this paper, as in-crop rainfall was never enough to rewet the deep bands, and so nutrient uptake was limited to what the plant could get before the bands dried. That is why we see such strong relationships between P or K uptake and grain yield across treatments that extend to what should have been luxury supplies of each nutrient.
In soil types with an existing K deficiency, there is a greater vulnerability caused by the apparently more rapid uptake of K than P. This suggests a need for more frequent K applications than P, but applying K without P will limit both root proliferation and efficient K uptake. These are challenges that need further research to develop effective solutions and are of particular relevance to CQ farming systems given the growing number of soil tests that indicate low-marginal K status in the 10-30cm profile layer.
The other nutrient interaction that affects the response to deep bands is nitrogen (N). This has been spoken about at length in a previous paper (Sands et al. 2018) relating to CQ trial sites. Response to P and K can be limited by low N levels and vice versa, response to N can be limited by low P and K levels. Managing N in the farming system is critical to achieving water limited grain yields.
The increasing use of grain legumes in our farming system has developed the perception in industry that less N fertiliser needs to be applied as legumes will fix their own N. While there is no doubt about grain legumes using N fixation, what is not well understood is what proportion of mineralised N is also being utilised by grain legumes. Data from the farming systems site at the Emerald research facility over five years (Figure 15) suggests that chickpeas use as much of the mineralised nitrate in the profile as wheat. Soil tests taken at planting and at harvesting chickpeas or wheat show that nitrate levels down to 90cm were very similar (Figure 15).
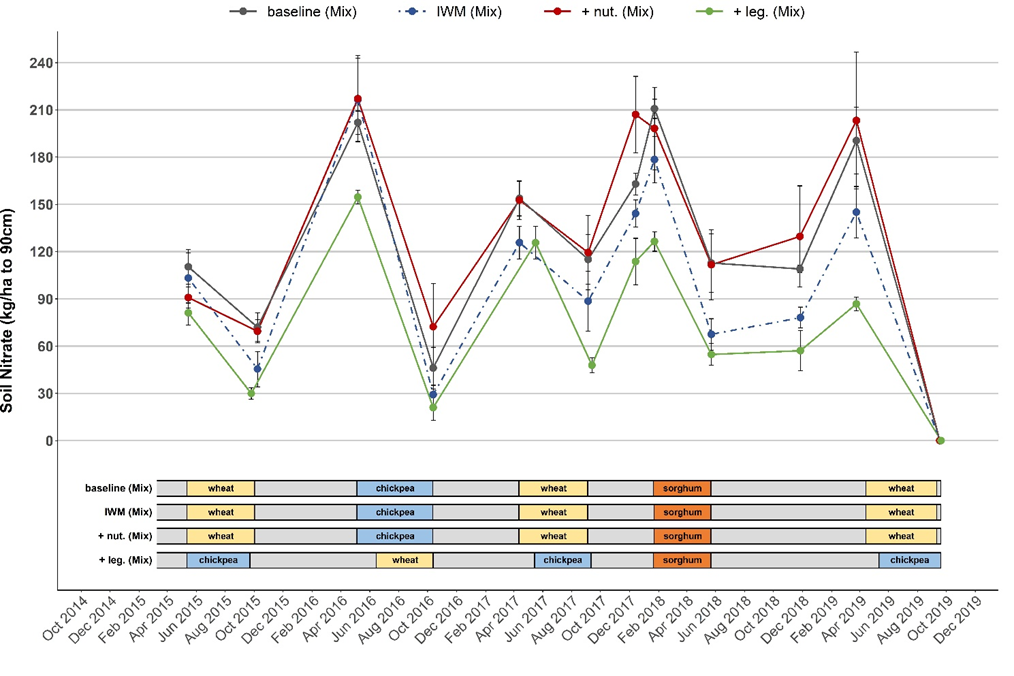 Figure 15. Tracking of nitrates (to 90 cm) at the start and end of each crop in a five-year farming systems program.
While chickpea residues can contribute to the mineral N pool, they rarely leave large amounts of surplus N behind – especially if grain yields have been reasonable. As discussed in the associated paper, ‘Strategies to improve efficiency of use of applied N,P and K fertiliser in Central Queensland’ (Bell et al, 2020),nitrate applied at planting can get stranded in the top soil and be unavailable for crop uptake in the season of application.
Movement of N down the profile of vertosols can be slow with several experiments (Bell et al, 2020) since 2012 demonstrating that the majority of fertiliser N applied at planting still remaining in the top 10 cm – 20 cm of the profile after harvest. Nitrogen applied the year before on a dry profile has a better chance of moving down the profile on a wetted front that is being driven by fallow rainfall. N that is more widely distributed in the profile has a much higher uptake efficiency in the plant (70-80%)
Further to this , if no N is applied the year before because a chickpea crop was planted, and that chickpea crop drains the soil profile of residual fertiliser N from the previous crop, then the subsequent wheat crop may be limited for N down the profile. Subsequently, this means that a wheat crop following a chickpea crop can become N limited despite urea being applied at planting.
These issues of timing of nutrient availability relative to crop demand and the position of available nutrients deeper in the soil profile, are of critical importance to the success of CQ farming systems. Rainfall is typically concentrated into one or two months of the year and so both winter and summer crops often use sub-soil moisture during flowering and grain development. The surface soil (0-10 cm) is often too dry for roots to extract nutrients, so having both water and nutrients in the sub-surface (10-30 cm, 30-60 cm) profile becomes extremely important for nutrient uptake efficiency.
References
Sands D, Bell M and Lester D (2018). Getting nutrition right in Central Queensland. GRDC Updates at Emerald and Biloela, December 2018.
Bell M, Lester D and Sands D (2020). Strategies to improve efficiency of use of applied N, P and K fertiliser in Central Queensland. GRDC Updates Webinar series (Nov 19,2020) – Changing nutrition strategies for profit in CQ.
Pulse Australia (2020) Best Management Guide - Chickpea production: Northern Region, accessed 15/10/2020.
Aisthorpe D (2020). Farm Practices Research – Emerald site technical report 2015 – 2019. GRDC final project report (DAQ00192), Northern Farming Systems – Integrating research solutions for profitable outcomes.
Acknowledgements
The research undertaken as part of this project is made possible by the significant contributions of growers through both trial cooperation and the support of the GRDC, the author would like to thank them for their continued support.
Contact details
Doug Sands
Queensland Department of Agriculture and Fisheries
99 Hospital Road, Emerald
Ph: 07 4991 0811
Email: douglas.sands@daf.qld.gov.au
® Registered Trademark
Varieties displaying this symbol beside them are protected under the Plant Breeders Rights Act 1994.
GRDC Project Code: UOQ1207-001RTX, DAQ1406-003RTX,
Was this page helpful?
YOUR FEEDBACK

