A systems approach to nitrogen management
A systems approach to nitrogen management
Author: James Hunt (The University of Melbourne) & Ashley Wallace (Agriculture Victoria) | Date: 21 Feb 2023
Take home messages
- Crops typically get 60–80% of their N requirements from soil and only 20–40% from fertiliser in year of application. Think of fertiliser more as an input to maintain soil fertility and fill seasonal shortfalls, rather than the major source of N for crops.
- Aim to maintain soil fertility and maximise profits by using N fertiliser to achieve a neutral or small positive N balance. N Banks, Yield Prophet® and variable rate N fertiliser application based on protein maps are effective ways of achieving this aim.
- Don’t be overly concerned about poor NUE and response to fertiliser N in the year of application, manage to minimise losses (4Rs) and unused N will make an important contribution to soil fertility.
Background
Nitrogen (N) deficiency is the single biggest cause of the gap between water limited potential yield and farm yield in non-legume grain crops in Australia (Hochman and Horan 2018). Recent shifts to continuous cropping with low legume intensity means crops are highly reliant on fertiliser N to achieve water limited yields. Due to Australia’s variable rainfall and thus variable water limited potential yields, it is difficult to match fertiliser N to anticipated crop yields, and many crops are under-fertilised and nitrogen deficient. Wheat or barley grain protein less than 11.5% is a good indication of N deficiency. Under-fertilising not only reduces crop yield, but also causes crops to mine soil organic nitrogen, which runs-down soil organic matter, emitting carbon dioxide to the atmosphere and increasing reliance on fertiliser N for future production.
In 2022, urea tripled in price compared to previous years. Grain prices also increased meaning that optimal N rates haven’t changed all that much, but the total cost of N fertiliser inputs and value at risk has increased markedly. It is now more important than ever to make sure that N fertiliser is being used effectively and environmental losses are avoided as much as possible.
In the past, much research and extension emphasis has been placed on maximising nitrogen fertiliser use efficiency in the year of application. This overlooks the fact that in continuous cropping systems, fertiliser not used in the year of application contributes to maintaining soil organic matter and thus, soil fertility. We argue that to effectively close yield gaps, a longer-term systems approach to N fertiliser management is needed where losses are minimised, but it is recognised that applications of N fertiliser are as much about maintaining soil N fertility, as they are about meeting the N requirement of the crop in the year of application.
Nitrogen in cropping systems
Most N in cropping systems is stored in soil organic matter that cannot easily be taken up by plants or lost to the environment. There are usually tonnes per hectare of soil organic N in most cropping soils, and this forms the basis of soil fertility. N becomes readily available to plants when it is mineralised by microbes from organic matter into mineral form (Figure 1). Mineral and organic N together are referred to as total soil N. Nitrate (NO3) and ammonium (NH4) are the most stable forms of mineral N in the soil, and the forms most readily taken up by plants. These are the compounds that are typically measured in deep N soil tests as a measure of instantaneous fertility.
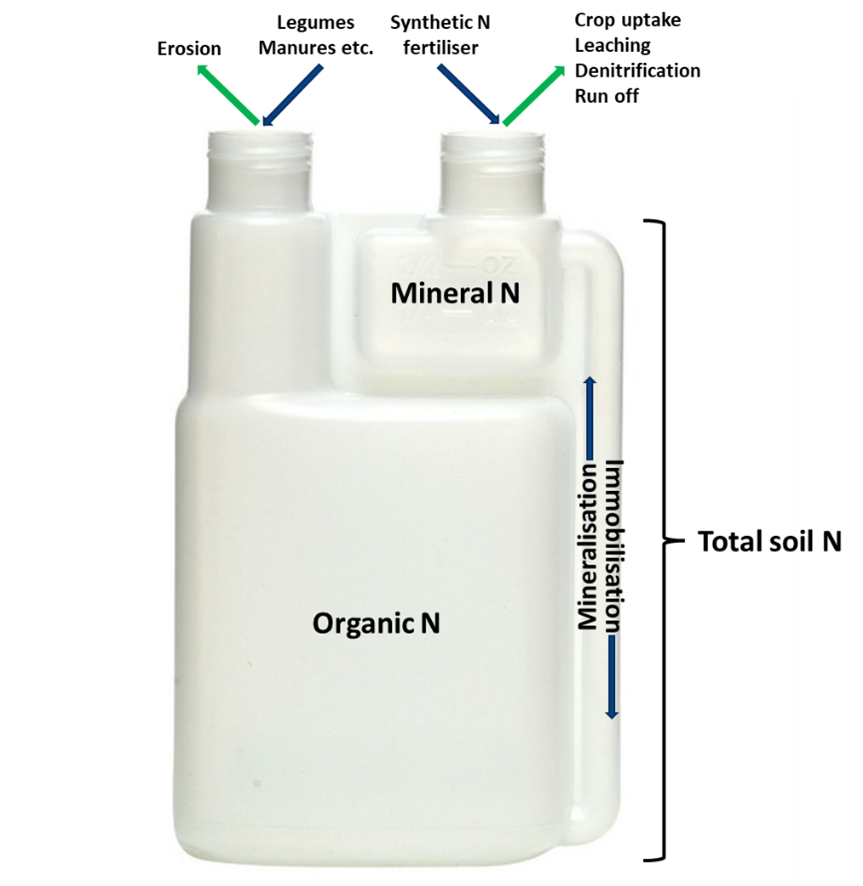
Figure 1. A twin chamber measuring bottle provides a good analogy for soil N – most N in the soil is in organic form (bottom chamber) but crops mainly take up N in mineral form (top chamber). N moves between organic and mineral form via mineralisation and immobilisation. N can be added to or lost from the soil in both organic and mineral form.
Mineral nitrogen moves back into the organic pool when it is immobilised by microbes or taken up by plants. Immobilisation occurs when soil microbes breaking down carbon-rich molecules in plant residues or other dead microbes for energy, take-up N to form proteins in their cellular structures. When these organisms die, their rapid decomposition can be prevented by association with soil mineral particles or aggregates, and this forms the basis of soil organic matter. Very fine particles of decomposed plant material protected from rapid decomposition by soil aggregates are the other important component of soil organic matter. Nitrogen is also present mostly in organic form in living plants, and in plant residues on the soil surface which form the feedstock for soil organic matter production.
The major inputs (tens to hundreds of kg/ha) of N into cropping systems are from legume fixation of atmospheric N and addition of synthetic N fertiliser or organic wastes, for example, manures, composts, biosolids (Figure 2). There are smaller amounts (ones to tens of kg/ha) provided through rainwater and dust deposition, and fixation of atmospheric N by free-living (non-rhizobial) bacteria.
The major outputs of N from cropping systems are through export of grain and hay, burning or removal of crop residues and environmental losses due to denitrification, volatilisation, leaching, run off and erosion.
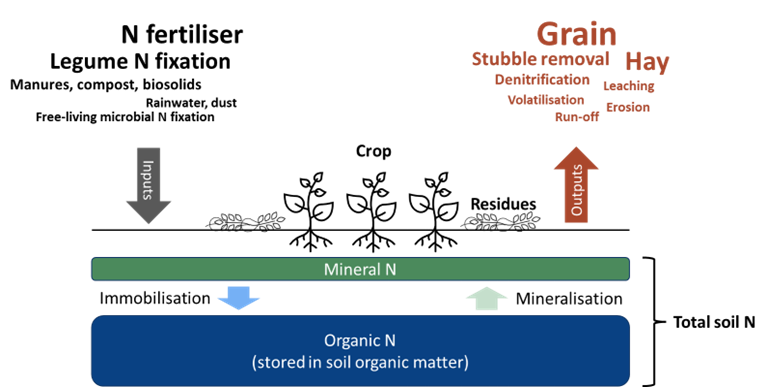
Figure 2. Nitrogen pools, inputs and outputs in grain cropping systems.
Soil is the most important source of N to crops
On average, grain crops derive only 20–40% of their N requirement from fertiliser applied during their life cycle, with the remainder being taken up from the soil (Gardner and Drinkwater 2009, Wallace et al. 2022). Soil sources of N are thus the most important source of N to a crop, and include:
- mineral N accumulated prior to sowing, which comes from various sources, including
- N that mineralises out of soil organic matter or plant residues during the summer fallow
- mineral N from various sources not used by previous crops (‘spared’ N)
- N that mineralises from soil organic matter or plant residues while the crop is growing (in-crop mineralisation).
Rates of net mineralisation (mineralisation minus immobilisation) are determined by soil temperature and water availability, amount of soil organic matter, and amount and C:N ratio of plant residues. Decomposition of plant residues with C:N ratio of 25:1 or less will usually result in net mineralisation, but at C:N ratios above this, net immobilisation is likely (cereal straw typically has a C:N ratio of 80:1).
In any given year, it is difficult to compensate for poor soil N fertility (low mineral N and soil organic matter) with high rates of N fertiliser because it is difficult to get more than 20–40% of total crop N uptake from fertiliser N. To support high yields, it is essential that soil N fertility is maintained.
How can N fertility be maintained
Over the long term, N fertility in cropping systems is maintained by ensuring that N inputs either equal or exceed N outputs in grain and losses. That is, the cropping system needs to have a neutral or positive N balance. When outputs exceed inputs, N balance of the system is negative, and plant and microbial growth become strongly N limited. As N mineralises out of the organic pool to be taken up by crops and exported in grain, it is not replaced, and soil organic N declines over time. This is referred to as ‘mining’ of soil organic N, and long fallowing is one of the most effective ways for this to be achieved. Because of the fixed ratio of C:N in soil organic matter, soil organic carbon also declines during periods of N mining as C is respired into the atmosphere as CO2. Eventually, soil organic matter will reach an equilibrium of low fertility where the ability of the soil to provide mineral N to crops (and support yield) is greatly diminished, forcing greater reliance on fertiliser N inputs to support yield.
In continuous cropping systems, N fertility can only be maintained by inclusion of grain or forage legumes in the crop rotation and/or addition of sufficient N fertiliser or manure to compensate for N exported in grain or lost to the environment. Only 30–50% of applied fertiliser (and less of manure) is used by crops in the year of application, and the remainder is either carried over in the soil as ‘spared’ mineral N, immobilised into soil organic matter or lost to the environment through stubble burning, volatilisation, run-off, leaching or denitrification.
Cropping systems with an overly positive N balance are at risk of accumulating mineral N and suffering higher N losses but running a positive N balance may be necessary to build fertility in paddocks in which soil organic matter is depleted. Building fertility is likely to be more cost effective and less prone to losses if it is achieved by adding organic sources of N, for example, by growing legume pastures or brown manures, or applying manures or other organic wastes, rather than adding excessive amounts of synthetic N fertiliser.
Use of decision support tools such as Yield Prophet®, Nitrogen Banks and variable rate application of N fertiliser based on protein or N removal maps are both effective and can all guide N fertiliser management to ensure that crop N balance is neutral.
Five years of data from the BCG and University of Melbourne long term N management experiment at Curyo in NW Victoria (Hunt et al. 2022) has shown that fertiliser N management strategies which run a neutral to slightly positive N balance (N Bank 125kg N/h, Yield Prophet 50%) are also the most profitable (Figure 3) and that profit begins to decline at an N balance of ±50kg N/ha from neutral. Profitability also declines above a marginal nitrogen use efficiency (NUE) of ~20kg/kg (Figure 4), illustrating that NUE is not the best indicator of overall system performance.

Figure 3. The relationship between partial N balance (N applied as fertiliser – N exported in grain) and mean gross margin (R²=0.74). Results are averaged from 2018–2022, but costs and prices from 2022 were used to calculate gross margin, including urea at $1 400/t. YP=Yield Prophet at different probabilities indicated by following number, NB = N Banks at different target levels indicated by following number, R= replacement and NA45 = national average application 45kg N/ha.

Figure 4. The relationship between mean marginal NUE (kg grain produced per kg of fertiliser N applied relative to Nil control) and gross margin (R²=0.69). Results are averaged from 2018–2022, but costs and prices from 2022 were used to calculate gross margin, including urea at $1 400/t. YP=Yield Prophet at different probabilities indicated by following number, NB = N Banks at different target levels indicated by following number, R= replacement and NA45 = national average application 45kg N/ha.
Avoiding nitrogen losses
While the benefits of minimising loss of N to the environment are clear, implementing reliable management strategies to achieve this under conditions of uncertainty (seasons and yield potential, input prices, commodity prices) is more complicated. Nonetheless, understanding the risk factors that contribute to N loss can help to inform management for maintaining soil N reserves.
Previous studies across a range of grain crops grown in Australia indicate that, on average, 22% of fertiliser N applied is lost from the farming system by harvest (Angus and Grace, 2017). However, this value can vary greatly, typically ranging from 5–50%. Rates of N loss are highly correlated with soil water supply – either too much or not enough can influence N cycling, availability to the crop and the processes that lead to loss. Measurements of NUE across a range of environments in Victoria have shown that highest losses occur under wet conditions in either high rainfall (7–93%) or irrigated conditions (31–54%). Conversely, measurements from lower rainfall (<450mm annually) environments show typical losses of 5–42% (Wallace et al. 2022).
Under wet soil conditions, potential loss processes include denitrification (where nitrate is reduced to di-nitrogen, nitrous oxide and nitrogen oxide under waterlogged conditions) and leaching or runoff (where soluble nitrate moves through or across the soil with the flow of water). These processes attract substantial research and policy interest due to their relevance as a potent greenhouse gas (nitrous oxide), potential pollutant of waterways (nitrate leaching or runoff) and a cause of soil acidification (nitrate leaching). Under dryland conditions in most Australian grain growing regions, major leaching events are rare. However, the potential for extended periods of waterlogging, leading to anaerobic soil conditions causing denitrification may result in large rates of N loss. Unfortunately, field-based assessments of total denitrification are currently limited as accurate measurements are difficult. However, research supported by GRDC and their partners continues in this area to help close the nitrogen cycle (Barton et al. 2022).
Where soil conditions following N fertiliser surface application are relatively dry, the risk of losing N to ammonia volatilisation increases. Volatilisation occurs where water supply is sufficient to cause dissolution of fertilisers such as urea (a heavy dew can begin this process) but is insufficient to wash the N into the soil profile. Where N is maintained near the soil surface as ammonium, it can be subject to loss as ammonia gas. High soil pH, surface application of fertiliser, high temperatures, windy conditions and minimal ground cover are some of the key factors influencing the amount of N lost through this pathway. There is a large range of measured losses due to volatilisation in Australian cropping systems, with analysis by Schwenke (2021) suggesting a median of 8.1%, ranging from 0–29% for in-crop, surface application of urea.
Minimising loss of applied N centres around controlling levels of excess mineral N in the soil, particularly at times when conditions are conducive to loss (see above). Ideally, this means more fertiliser N being taken up by the crop. If this can’t be achieved, then maintaining this N in the soil, ideally in tied-up/organic forms for future cropping cycles, is preferred. To achieve this, fertiliser decision making can be guided by the 4Rs principle: right rate, right time, right product, right place.
Under Australian conditions, determining the ‘right rate’ of application is a first order priority. Variable seasons, fertiliser and input prices and uncertainty relating to response make for a difficult decision. While year to year variables often dominate thinking about rate, consideration should be given to a broad balance over multiple years. If removal of N exceeds total inputs, soil fertility is in decline and this needs to be replaced in one form or another. Achieving the ‘right time’ for application relates to understanding crop demand patterns and their relationship with N availability. Previous studies show that crop uptake of applied N is directly related to crop growth rate at the time of application (Limaux et al. 1999). As a result, delaying application until stem elongation in cereals can help to increase crop uptake of applied N and reduce loss (Figure 5), although this is dependent on conditions following application. In Figure 5 below, results from years with wet winters and modest springs (2012 and 2013) lead to reduced loss where N application was delayed. However, in a dry year (2014), these differences were limited.

Figure 5. Proportion of fertiliser N lost (not recovered in either plant material or soil) between the time of application and harvest for urea applied to wheat in the Victorian Wimmera (2012–2014). All treatments applied at 50kg N/ha, with sowing treatments banded below the seed and tillering treatments top-dressed. Treatments include inhibitor treated urea at each application time. Seasonal conditions were characterised by wet winters and modest spring rainfall in 2012 and 2013 and dry conditions throughout in 2014 (Wallace et al. 2020).
Where N application during high-risk periods is unavoidable, the use of enhanced efficiency fertilisers (EEFs) offers an opportunity to mitigate this risk. EEFs cover a wide range of fertiliser products that are designed to control the cycling of applied N. Nitrification inhibitors such as DMPP slow the conversion of ammonium to nitrate, helping to control N loss associated with denitrification, leaching or runoff where conditions are conducive (see data from 2013, Figure 4). Conversely, if N is applied during dry conditions, urease inhibitor treated urea can slow the conversion of urea to ammonium, reducing the risk of volatilisation (2014, Figure 4). Of course, the use of EEFs is contingent on an economic response to offset their associated price premium through either increased yield or grain quality, increased retention of N for future seasons, or reduced rate of application.
Achieving the ‘right placement’ of applied N can also help to reduce loss and retain more N in the crop or soil. Similar to the timing of fertiliser application, if the product is placed into areas of the soil where conditions are conducive to a particular process, it can be prone to loss. Incorporation or sub-surface banding of urea to reduce the risk of ammonia volatilisation during dry conditions is one example of how improvements can be achieved. Trials conducted in Victoria have shown that mid-row banding of urea during the growing season rather than topdressing, can increase crop uptake of applied N from an average of 40% (23–65%) to 56% (31–79%) and reduce loss from an average of 41% (25–50%) to 26% (13–43%) of applied N. However, yield and grain quality responses to fertiliser banding were variable and not consistently sufficient to immediately offset the increased cost of application. Similar to the use of EEFs, increased retention of N for future seasons or reduced rate of application may be required to justify this strategy.
While 2022 was an exceptionally wet year for most grain growing regions in south-eastern Australia, a common question arising after drier seasons relates to potential for carry-over of un-used fertiliser between years. Results from the Victorian studies listed above indicate that, particularly in medium and low rainfall regions, there is potential for substantial amounts of unused fertiliser N to remain in the topsoil following dry seasons (26–92% of applied N). These results are typically associated with poor crop uptake in the year of application, often where N was top-dressed and limited rainfall following meant that crop access to this N was hindered. While this N may be subject to loss mechanisms and tie-up, it nonetheless highlights the potential to gain a return on fertiliser investments in the years following application. Studies investigating N recovery over multiple years under dry seasonal conditions are currently limited. However, this issue is also the subject of ongoing investigation.
Acknowledgements
The BCG long term experiment at Curyo was funded from 2018–2019 by La Trobe University through the Grant Ready scheme of the Securing Food, Water and the Environment Research Focus Area, from 2019–2021 by the Mallee Catchment Management Authority through funding from the Australian Government’s National Landcare Program and from 2022 by GRDC through National Grower Network project N banking strategies to manage variable and unpredictable nitrogen demand in the MRZ of the Southern Region (PROC9176566) led by BCG.
NUE and N loss datasets referred to in this paper were funded by a range of organisations including Agriculture Victoria, Department of Agriculture, Fisheries and Forestry (under the Carbon Farming Futures: Action on the Ground and Filling the Research Gap programs) and GRDC through the Regional Research Agronomists program (DAV00143) as part of the Victorian Grains Innovation Partnership.
References
Angus JF, Grace PR (2017) Nitrogen balance in Australia and nitrogen use efficiency on Australian farms. Soil Research 55(6), 435-450.
Barton L, Hoyle FC, Grace PR, Schwenke GD, Scanlan CA, Armstrong RD, Bell MJ (2022) Soil nitrogen supply and N fertilizer losses from Australian dryland grain cropping systems. In ‘Advances in Agronomy’. (Ed. D.L. Sparks) volume 174, pp. 1-52. (Academic Press)
Gardner JB, Drinkwater LE (2009) The fate of nitrogen in grain cropping systems: a meta-analysis of 15N field experiments. Ecological Applications 19(8), 2167-2184. .
Hochman Z, Horan H (2018) Causes of wheat yield gaps and opportunities to advance the water-limited yield frontier in Australia. Field Crops Research 228, 20-30.
Hunt JR, Murray J, Maddern K, Wang J, Tang C (2022) Using novel nitrogen management systems to solve a complex problem. System Solutions for Complex Problems: 20th Australian Agronomy Conference. Australian Society of Agronomy, Toowoomba, Australia.
Kirkby CA, Kirkegaard JA, Richardson AE, Wade LJ, Blanchard C, Batten G (2011) Stable soil organic matter: A comparison of C:N:P:S ratios in Australian and other world soils. Geoderma 163(3–4), 197-208. .
Lawes R, Chen C, Whish J, Meier E, Ouzman J, Gobbett D, Vadakattu G, Ota N, van Rees H (2021) Applying more nitrogen is not always sufficient to address dryland wheat yield gaps in Australia. Field Crops Research 262, 108033. .
Limaux F, Recous S, Meynard J-M, Guckert A (1999) Relationship between rate of crop growth at date of fertiliser N application and fate of fertiliser N applied to winter wheat. Plant and Soil214(1), 49-59.
Schwenke GD (2021) Nitrogen loss pathways. How much N is lost when urea is not mechanically incorporated after application? GRDC Update paper.
Wallace AJ, Armstrong RD, Grace PR, Scheer C (2022) Nitrogen use efficiency and N2O emissions vary according to seasonal water supply across different cereal production systems of south eastern Australia. Geoderma Regional 29, e00498. .
Wallace AJ, Armstrong RD, Grace PR, Scheer C, Partington DL (2020) Nitrogen use efficiency of 15N urea applied to wheat based on fertiliser timing and use of inhibitors. Nutrient Cycling in Agroecosystems 116(1), 41-56. .
Understanding crop potential and calculating nitrogen to improve crop biomass workshop recording (including spreadsheet for calculating N balances)
Contact details
James Hunt
The University of Melbourne
Royal Parade, Parkville VIC 3010
0428 636 391
james.hunt@unimelb.edu.au