Beyond the paddock: Remote mapping of grain crop type and phenology
Beyond the paddock: Remote mapping of grain crop type and phenology
Author: Andries B Potgieter, Yan Zhao, Dung Nguyen Tien, Sumanta Das, Celso Cordevo, Jenny Mauhika, Yash Dang, Scott Chapman and Karine Chenu (University of Queensland) | Date: 16 Feb 2022
Take home messages
- Harnessing high resolution digital technologies will create more accurate and location specific information such as crop type and crop phenology stage
- Mapping of likely specific crop type and phenological stages across environments are critical for reducing in season risk and thus optimising crop management practices at field scales
- Scaling out of such tools will allow fast and robust applications across multiple fields, farms, and regions
- The CropPhen digital tool will be delivered to industry via a national commercial partner.
Aims
The adoption of digital technologies can be constrained by demands such as, which data provider platform and the financial cost placed on users. Furthermore, there are a plethora of digital platforms currently available to industry, but key gaps in the underpinning science and a need to develop analytics that have been rigorously calibrated and tested on independent data sets for different genotypes, environments, and management practices within the Australian broadacre cropping landscape. The CropPhen project aims to map crop phenology per crop type across multiple fields and farms. Specifically, we aim to
- Determine crop phenology and cropping dynamics from high resolution earth observation (EO) data at the field scale
- Determine the ability of hyperspectral data from ground sensors, unmanned aerial vehicles (UAV) and satellites to augment the estimation of phenological stages at field scales by variety and environment, and
- Through project partners Data Farming, develop and deliver a web-based information system that provides data on crop type classification and phenological stages within fields and field scales across large regions.
Outputs generated from this project will assist industry to determine crop type, and individual growers to spatially map the current stage of development and predicted dates of development stages more accurately at fine spatial and temporal scales throughout the growing season. That phenological data could further provide a basis for the real-time estimation of potential damage, crop risks and losses at the field and sub-field scales from diseases, frost and heat events, and other production constraints.
Background
In the Australian grain cropping environment, accurate spatial and temporal information about crop type and phenological stage is essential for managing operations such as disease, weed control and the sequential decisions of application of N-fertiliser in cereals. For example, different chemical controls are often certified only for use at specific crop growth stages. This project will develop the analytics to provide reliable, accurate and spatially specific crop type classification and phenological estimates for wheat, barley, chickpea, and lentils (winter) and summer crops (sorghum) across the Australian Grain Belt. This will be achieved by integrating climate, crop modelling and high-resolution EO technologies. Knowing the likely area of crop emergence and main phenological stages, at a farm and regional scale, will help enable operators to optimise management decisions relating to improved timeliness and variable application of in-season nutrition rates. Furthermore, this will inform grower’s existing knowledge on optimal disease, weed control and crop management practices to optimise return on investment.
Methods
Crop type classification
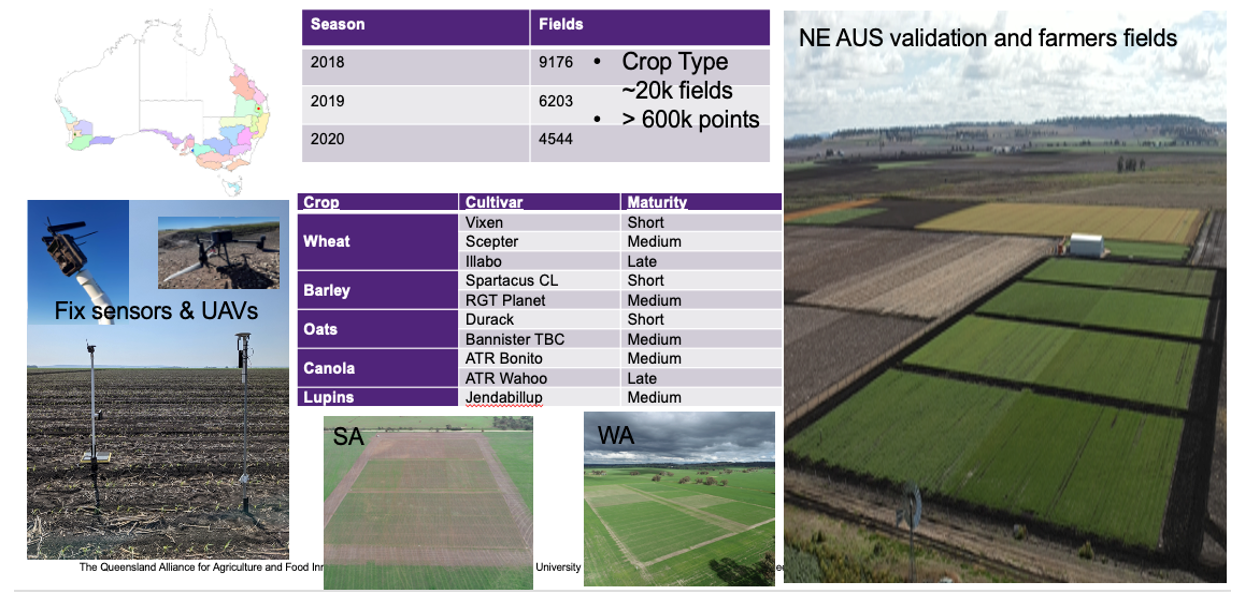
Nation-wide surveyed ground truth data covering cropping fields for the 2018-2021 seasons (summer and winter) provided by industry partners are used to calibrate and validate a carefully designed deep learning (DL) model to accurately and timely discriminate between crop types across Australia. A pipeline for evaluating the field data and filtering noise (due to human errors) based on crop season start and flowering (peak vegetation index) information from MODIS NDVI has been applied. The refined field records will be overlaid with the high spatiotemporal resolution Sentinel 2 imagery to derive selected spectral features for training the DL models. Figure 1 illustrated the overall distributions of the valid field polygons across the GRDC growth region and north-eastern Australia (NEAUS). The model for each region will be trained individually using filed polygons available in the region to reflect its unique crop characteristics.
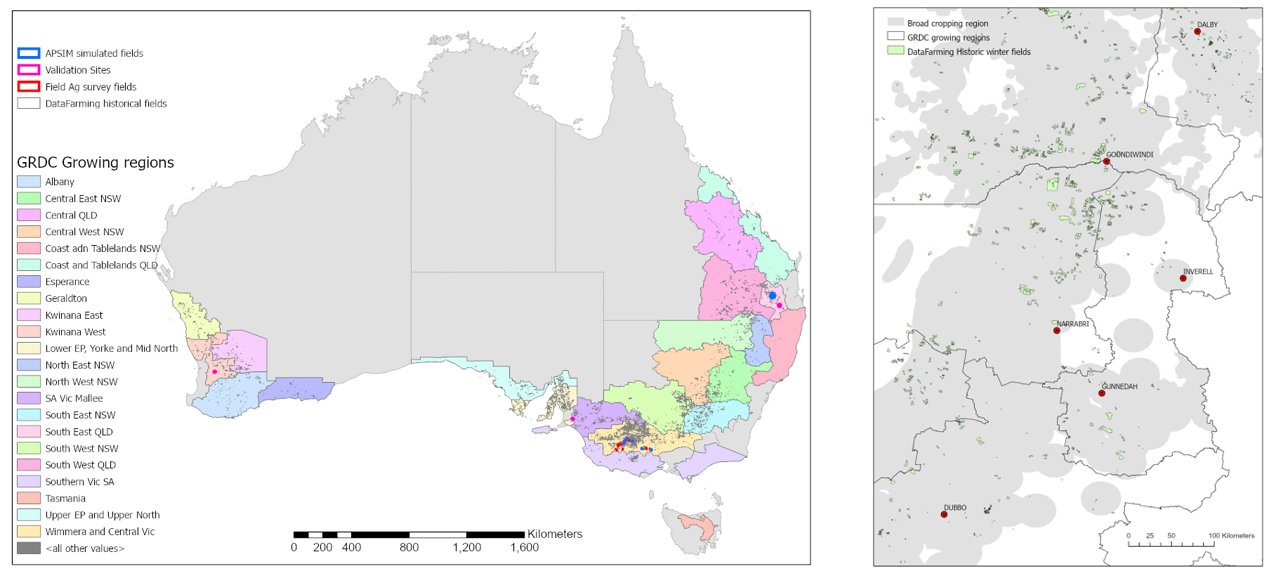
Figure 1. (Left) Distribution of Data Farming historic field polygons covering seasons from 2018 to 2021; Location of crop validation sites, APSIM simulations and survey fields in Victoria. (Right) Zoomed in view of field data for north-eastern Australia (NEAUS).
Crop phenology validation sites
To understand the phenological cycles for the targeted crops in this project, field trials have been designed and planted for seasons since 2020. In 2020, a sorghum trial consisting of 6 plots (30 m x 30 m) covering 3 genotypes was set up in Jondaryan, Queensland (-27.46, 151.54). In 2021, winter crop trials were set up in Allora (-28.061, 151.963), Callington (-35.141, 139.073) and Dale (-32.197, 116.754). Trial layouts, along with planted crop types and crop genotypes are depicted in Figure 2.
For each site, a weekly ground survey of phenological stage was collected using a simple survey form (Kobo Toolbox, USA). Additional data points included the recording of fresh and dry biomass at stem elongation (i.e., Zadok’s stage 31 for wheat) as well as at maturity along with final harvested yield data were collected.
Capturing crop attributes from UAVs
At each validation site multispectral data was captured using a high resolution MicaSense Altum camera (MicaSense, Inc., Seattle, USA) with 6 bands: blue (400-500 nm), green (500-600 nm), red (600-680 nm), red edge (680-750 nm), near infrared (750-1050 nm), and long wave thermal infrared (LWIR) (8000-14000 nm). The camera was mounted on a UAV at 60 m height to capture images at weekly intervals during the crop season. These flights were also designed to align with on ground phenology and crop morphological and physiological measurements.
Figure 2. The three winter (one summer) validation sites. The GRDC ecological regions are coloured in the Australian map (top left). Fix sensors installed at each validation site also depicted.
Results
Examples of some of the preliminary results are given below.
Measuring crop growth from multispectral UAV platforms
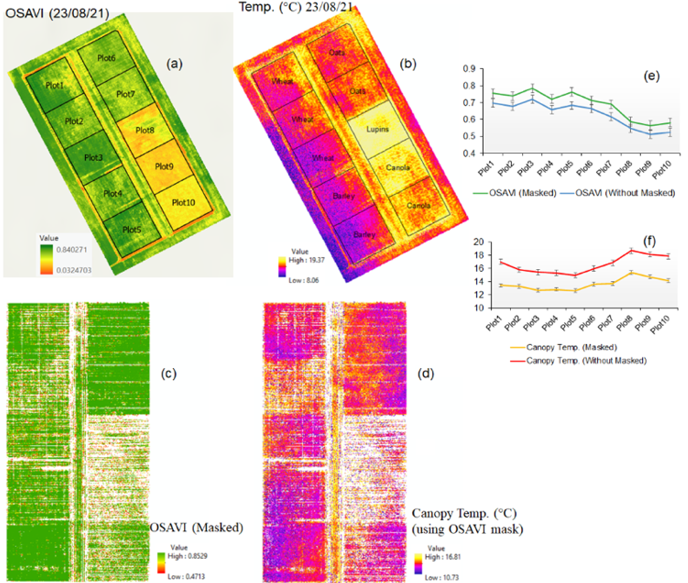
Sensing of crop growth over time using high-resolution multispectral data enables the investigation of morphological and physiological crop traits for different genetics (G) x environment (E) x management (M) (Potgieter et al., 2021). Extracted vegetation metrics from the multispectral camera on the UAV show a strong relationship between canopy architecture and canopy temperature (Figure 3). Creating a sequential profile of crop development for wheat, barley, and canola at the three sites highlights differences of in-season phenological development of crops measured using vegetation indices across environments during the 2021 winter season (Figure 4). This will be further analysed to determine the impact of canopy temperature on final crop yield at field scales (Zhao et al., 2020) across the selected main winter crops, genotypes and environments (Das et al., 2022 submitted).
Crop phenology
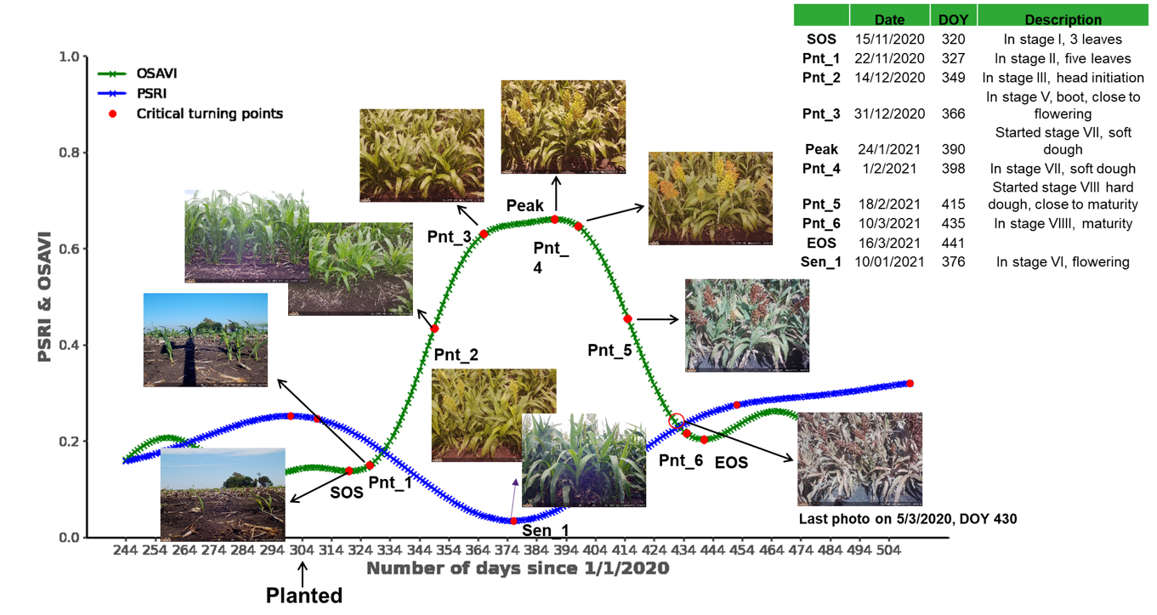
We applied the process of ‘mathematical curve fitting’ and ‘feature point detection’ to get sequential, (every 5-days) vegetation indices (VIs) from Sentinel-2. Observed phenology stages both recorded from on ground field surveys and in field cameras were used to calibrate and validate phenology models. Figure 5 depicts data recorded from remote sensing and some of the feature point metrics (OSAVI: the Optimized Soil Adjusted Vegetation Index, and the PSRI: Plant Senescence Reflectance Index.)
Figure 3. Example of one of the representative trials at Dale (Western Australia) indicating plot layout and crop species. (a) An optimized soil adjusted vegetation index (OSAVI) (b) and surface temperature (imagery date: 23/08/2021). Values of OSAVI and temperature aggregated for entire whole plot (‘without mask’) average reflectance values from both soil and canopy pixels; (c) & (d) OSAVI and canopy temperature (on top of green plants only, i.e. ‘masked’) using a 0.5 threshold on for canopy delineation (e) & (f) plot-wise variation of OSAVI and canopy temperature and differences between ‘masked’ and ‘without mask’ OSAVI and canopy temperature statistics on the same date of imagery.
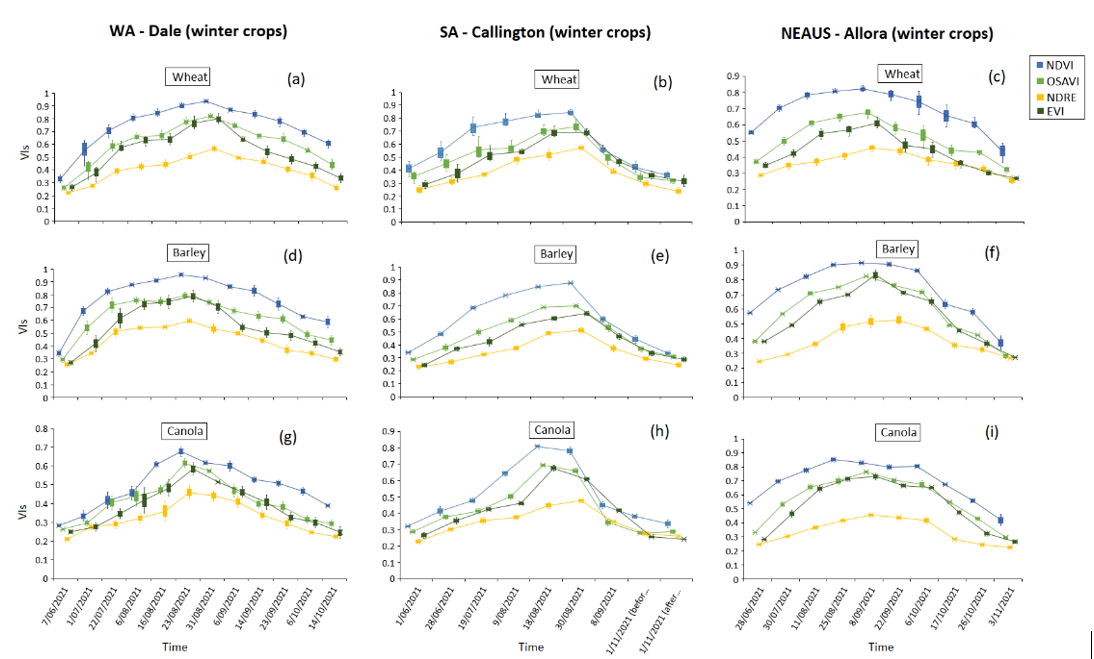
Figure 5. Crop growth curve for derived mathematical attributes - the Optimized Soil Adjusted Vegetation Index (OSAVI) and Plant Senescence Reflectance Index (PSRI) - and measured crop phenology for Sorghum 2020/2021 season in Jondaryan.
Crop type model validation and development
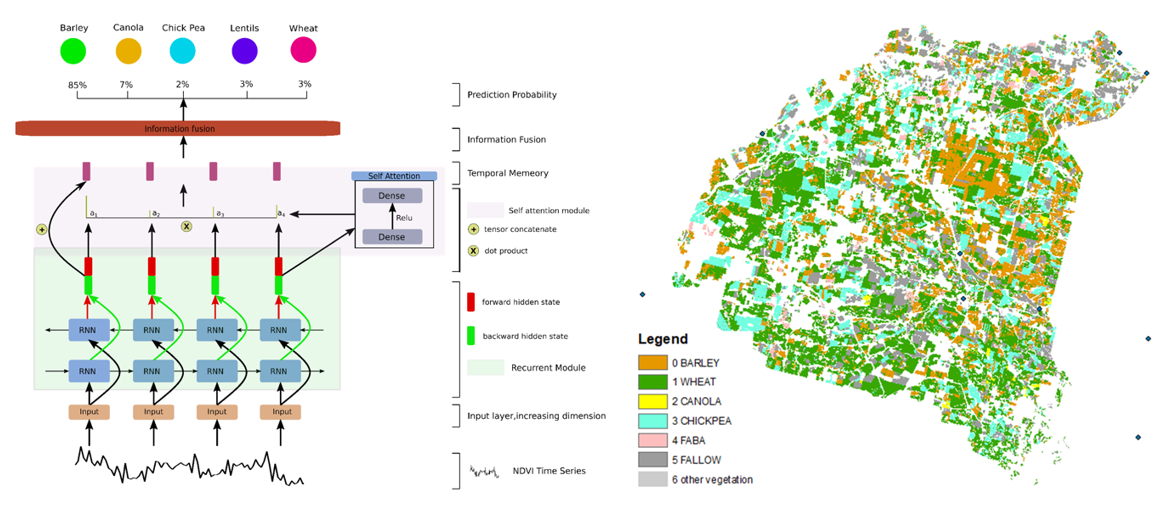
Figure 6 shows the recurrent neural network (RNN) deep learning model derived and the classification of winter crops and non-crops for the 2020 cropping season for Moree. Five main crop types in the region were considered. The model was able to determine what crop type was being grown with an accuracy of wheat (99%), barley (98.8%), canola (99.9%), chickpea (99.7%), and faba bean (97.8%). The current outputs were calibrated and validated with a model using Sentinel-2 spectral features. Finally, analysis is currently underway that harnessing synchronous dynamic features from multi-spectral data, including physiological and morphological crop growth attributes (Nguyen et. al., 2022 submitted, data not shown).
Figure 6. The model structure and the model output for classifying crop types for Moree in 2020.
How will this information be delivered to farmers and industry?
The methods to remotely map crop types at scale at different points in the season will be delivered to industry through project partners Data Farming (https://www.datafarming.com.au/), with an intent to make initial data available in the 2022 winter cropping season. The methods to remotely map crop phenology spatially are in an earlier stage of development, but will similarly be delivered to growers, agronomists, and other end-users through commercial partners.
How can famers make use of this information?
This project will deliver spatial information on crop phenology at scale, and in easily use-able formats that could be linked to other agronomic models and information systems. to near-real time spatial data on developmental stage would provide key data to supplement grower and agronomist decision making. For example:
- More localised and accurate phenology data will help deliver better estimates of crop yield potential across a grower’s cropping operation, and thus enable more informed management strategies
- A better understanding of the likely spatial variability in crop development in-season and across paddocks in different points in the landscape – that data could be used to forward plan harvest logistics, but also guide future variety x sowing date decisions for different paddocks
- It will assist crop scouting through guiding agronomists on where to scout for damage from biotic and abiotic stresses based on which part of the crop in which paddocks is at a susceptible developmental stage
Acknowledgements
The research undertaken as part of this project is made possible by the significant contributions of growers through both trial cooperation and the support of the GRDC, the author would like to thank them for their continued support. This work was funded by the Grains research Development Corporation Australia (GRDC), ‘CropPhen’ project (UOQ2002-010RTX), The University of Queensland (UQ), University of Melbourne (UoM), Data Farming Pty Ltd, Primary Industries and Regions of South Australia (SARDI) and Department of Primary Industries and Regional Development (DPIRD).
A special acknowledgement to the CropPhen project validation site collaborators in north-eastern Australia, i.e. David Loughnan (producer Jondaryan) and Pacific Seed Pty. Ltd. Foundation farm and manager, Trevor Philp.
Other commercial partners:
UAV operators: Airborn Insight Pty Ltd.(https://airborninsight.com.au/)
Industry commercial delivery partner: Data Farming Pty. Ltd. (https://www.datafarming.com.au/)
References
Potgieter AB, Zhao Y, Zarco-Tejada PJ, Chenu K, Zhang Y, Porker K (2021) Evolution and application of digital technologies to predict crop type and crop phenology in agriculture. in silico Plants. 2021;3(1).
Das S, Massey-Reed SR, Mahuika J, Watson J, Cordova C, Otto L, Zhao Y, Chapman S, George-Jaeggli B, Jordan D, Hammer GL and Potgieter AB (2022, submitted). A high-throughput phenotyping pipeline for rapid evaluation of morphological and physiological crop traits across large fields, IEEE International Geoscience and Remote Sensing Symposium 2022 (IGARSS), Kuala Lumpur, Malaysia, 17 - 22 July 2022, Piscataway, NJ, United States: IEEE.
Zhao Y, Potgieter AB, Zhang M, Wu B, and Hammer GL (2020) Predicting Wheat Yield at the Field Scale by Combining High-Resolution Sentinel-2 Satellite Imagery and Crop Modelling. Remote Sensing, 12, 1024.
Nguyen D, Zhao Y, Zhang Y, Huynh ANL, Roosta F, Hammer G, Chapman S, Potgieter AB (2022, submitted). Crop type prediction utilising a long short-term memory with a self-attention for winter crops in Australia, IEEE International Geoscience and Remote Sensing Symposium 2022 (IGARSS), Kuala Lumpur, Malaysia, 17 - 22 July 2022, Piscataway, NJ, United States: IEEE.
Contact details
A/Prof Andries B Potgieter
The University of Queensland
Queensland Alliance for Agriculture and Food Innovation
Ph: 0408 715 514
Email: a.potgieter@uq.edu.au
GRDC Project Code: UOQ2002-010RTX,

