Deep P and K - a call to action! Critical soil indicators, costs and benefits of deep P & K and timing.
Deep P and K - a call to action! Critical soil indicators, costs and benefits of deep P & K and timing.
Author: Mike Bell (University of Queensland), Michael Ledingham (Merinda Farms, Moree), David Lester (Department of Agriculture and Fisheries) | Date: 08 Mar 2022
Take home messages
- Ensuring continued phosphorus (P) availability to crops under variable seasonal conditions is increasingly difficult across the northern region. Similarly, while potassium (K) infertility is currently restricted to specific soil types and regions, K deficiencies are increasing – particularly in drier years without access to enriched surface soils
- Both P and K are effectively immobile in clay soils, and with crops relying heavily on subsoil nutrient reserves when topsoils are dry, it is not surprising that subsoil depletion of P and K has occurred. The question is what to do about it, and at what stage of the fertility decline should management interventions start? Soil testing in layers is an effective mechanism to monitor fertility status
- Deep banding of P and K has been shown to be an effective and profitable strategy in soils with low subsoil reserves across southern and central Qld, but unless soils are extremely depleted in one or both nutrients, crop responses will vary with seasonal conditions. This variability can impact the returns from deep applications in the short term, but excellent residual value of deep P bands over multiple seasons reduces financial risk
- Deep banding of K is more effective if P is placed with K to encourage root activity around bands. The residual benefits of deep K may not persist as long as deep P, because luxury crop K uptake can occur. Grain K removal is relatively low compared to crop uptake, so most crop K is returned to surface soils in residues
- Root access to deep bands is normally limited by the small volumes of soil treated and rapid drying in response to root proliferation in treated zones. Therefore, view deep banding of P and/or K as (profitable) supplements to uptake from the top 30-40cm, where root density is greatest
- The solution to P and K infertility is using soil samples to identify the zones of greatest depletion and using the residual value of both nutrients to progressively enrich as much of the accessible root zone as possible over time.
Introduction
The overwhelming majority of dryland cropping in northeast Australia occurs on clay soils that had variable, but generally moderate, reserves of nutrients in either organic form (predominantly nitrogen and sulfur) or inorganic forms (particularly phosphorus (P) and potassium (K)) prior to the commencement of cropping. This level of native fertility was able to support grain production with little fertiliser input for a number of years, but as soil organic matter declined and the cumulative amounts of grain removal increased with years of cropping and improved production systems, background fertility could not continue to meet crop demands and fertilisers started to be used. Nitrogen was generally the first input required, and this was consistent with the much higher rate of N removal in grain (i.e. ~20 kg N/t in cereals) than for either P (2.5-3 kg P/t) of K (3-3.5 kg K/t). In soils with lower P fertility, starter P also started to become popular as a means of ensuring plants could access enough P during the early stages of growth when root systems were small and inefficient, and crops were going through key physiological processes like floral initiation and establishment of potential grain numbers. This starter P was only ever a short term ‘fix’ or supplement to overall crop P uptake, which was still largely achieved through exploitation of P from crop residues, residual fertiliser in the topsoil and indigenous P reserves in the rest of the effective root zone. Soil K was still largely adequate to maintain crop productivity.
Further declines in soil organic matter and continued nutrient removal have resulted in a greater dependency on fertiliser N and the emergence of widespread P and soil/region-specific K limitations to growth. While all represent the net effects of crop nutrient removal on soil fertility banks, the P and K deficiencies have an added dimension of occurring most strongly in subsoils (e.g. from immediately below the tilled/top 10cm layer to about 30-40cm depth). This is due to combinations of shallow fertiliser inputs (if used), residues returned to the soil surface with little or no mixing through tillage and the lack of mobility of these key nutrients in soil water. The implications for productivity are substantial, and the challenges for fertiliser management significant. Our cropping systems rely on stored soil water in subsoil layers for extended periods in the growing season. For that soil water to be efficiently used to create biomass and grain yield, adequate amounts of available nutrients are required in soil layers accessible to active roots. As soil P and K become increasingly depleted in subsoils, fertiliser applications in topsoil layers can only provide benefits when those layers are wet for extended periods, or if the nutrients can move with water into those deeper layers. While N can move deeper, P and K can’t. We therefore have to physically place a significant proportion of our P and K directly into those subsoil layers (e.g. Bell et al., 2019, 2020). Deep banding strategies have been developed in response to this issue.
Deep banding – how, where and when
GRDC supported research into effective deep banding strategies has been conducted with variable success from sites south of Narrabri to north of Emerald. There is now a large pool of data from Qld sites especially (NSW sites were adversely affected by a string of very dry seasons in the second half of the research program) that has sought to answer these practical questions. Results can be summarised as follows –
- Depth of placement – the most significant depletion of profile P and K are in the soil layers immediately below the top soil (i.e. the 10-30cm layers – see Figure 1 for local examples from NW Slopes of NSW). These layers avoid the most severe and prolonged drying that occurs in the topsoil and are still close enough to the soil surface to have a high root density – essential for efficient uptake of less mobile nutrients like P and K. Deep placement strategies target the middle and bottom half of this layer. The local soil test information here shows that 8 of the 11 sites have subsoil Colwell P at concentrations where responses to deep P bands would be significant. Subsoil K is also depleted, but crop responses to deep bands would be marginal (at best) in only around 3 of the 11 sites shown
 and BSES (orange bars) P, with units of mg P/kg, and exchangeable K (grey points joined by a line for each site), with units of cmol(+)/kg. The dashed blue line is the approximate critical Colwell P concentration below which a response to deep bands would be expected. The equivalent for exchangeable K is shown as a dashed grey line.") Figure 1. Soil test results from 11 locations in the Pallamallawa district. Data are shown for Colwell (blue bars) and BSES (orange bars) P, with units of mg P/kg, and exchangeable K (grey points joined by a line for each site), with units of cmol(+)/kg. The dashed blue line is the approximate critical Colwell P concentration below which a response to deep bands would be expected. The equivalent for exchangeable K is shown as a dashed grey line.
Figure 1. Soil test results from 11 locations in the Pallamallawa district. Data are shown for Colwell (blue bars) and BSES (orange bars) P, with units of mg P/kg, and exchangeable K (grey points joined by a line for each site), with units of cmol(+)/kg. The dashed blue line is the approximate critical Colwell P concentration below which a response to deep bands would be expected. The equivalent for exchangeable K is shown as a dashed grey line.
- Band spacing – this is a compromise between band frequency (to maximise the chance of roots intercepting deep bands), in band concentration (high in-band concentrations result in large concentration gradients between the band and the surrounding soil depleted by root activity. Strong gradients maximize the rates and distance of diffusion from the band to replenish P and K in the soil solution) and the plant response to P bands (i.e. how much root proliferates around the band). There is little difference between bands spaced 25-50cm apart, but efficiency of crop P access and yield responses decline at wider spacings. Optimal spacings are similar for P or K, noting that as crops do not proliferate roots around K bands, co-application of P and K are required to maximize crop K uptake
- Product formulations – Most research has focussed on the form of P fertiliser (ammonium phosphates v triple superphosphate - TSP), with ammonium phosphates having a clear advantage over TSP – especially when applied in bands. The difference between mono- and di-ammonium phosphates is negligible in most instances, with cost effectiveness a key consideration. There has been no evidence of any advantage of fluid forms of P fertiliser compared to conventional granular products.
- There have been no direct comparisons of muriate (MoP) v sulfate of potash (SoP) in K bands, with muriate preferred based on lower cost/kg K applied. Effective root exploitation of banded K required colocation of some P in the K bands, regardless of the K product.
- Rates of application – deep banded applications and associated soil disturbance are typically undertaken infrequently to minimise the disruption and cost of expensive tillage operations (see Table 1). To that effect, rates should be enough to maximise the crop response in each year to gain a return on the deep banding investment, as well as provide responses over 4-5 crop seasons. Our results suggest that while application of 20 kg P/ha and 50 kg K/ha are able to maximise yield responses in the initial cropping season or two, an increasing advantage is observed from higher P rates (e.g. typically 40 kg P/ha) in later seasons, and that K re-application will be needed more frequently than P due to the greater crop uptake and redistribution into topsoil layers in residues.
Table 1. Treatment cost by P rate with basal N
Deep application | P rate | MAP | K rate | MoP | Deep P | Deep P + K |
|---|---|---|---|---|---|---|
$30 | 0 | $0 | 0 | $0 | $30 | $30 |
$30 | 10 | $40 | 25 | $32.5 | $70 | $102.5 |
$30 | 20 | $80 | 50 | $65 | $110 | $175 |
$30 | 40 | $160 | 75 | $97.5 | $190 | $287.5 |
$30 | 60 | $240 | 100 | $130 | $270 | $400 |
Note: Using long term average MAP ($800/t) and KCl ($650/t) prices
- When to re-apply? – This is a complex question, due to (i) differences in soil properties that influence the availability of applied P in soil over time; (ii) current uncertainty with how much P and K are actually taken up from deep bands (all we have been able to use is differences in uptake or removal between fertilised and unfertilised treatments, which doesn’t account for preferential uptake from either bands or bulk soil); and (iii) growing evidence that re-application of deep bands in different positions to the residual bands can provide another level of nutrient uptake and grain yield – possibly due to a larger volume of treated soil allowing more roots to encounter fertiliser.
As budgeting for removal and soil testing to detect residual deep bands are both ineffective, we currently suggest a combination of monitoring plant nutrient status (tissue tests) and use of re-application test strips as the most practical tools to determine the time to re-apply. The responses obtained to the initial applications and the cost of fertiliser will also factor heavily in these decisions.
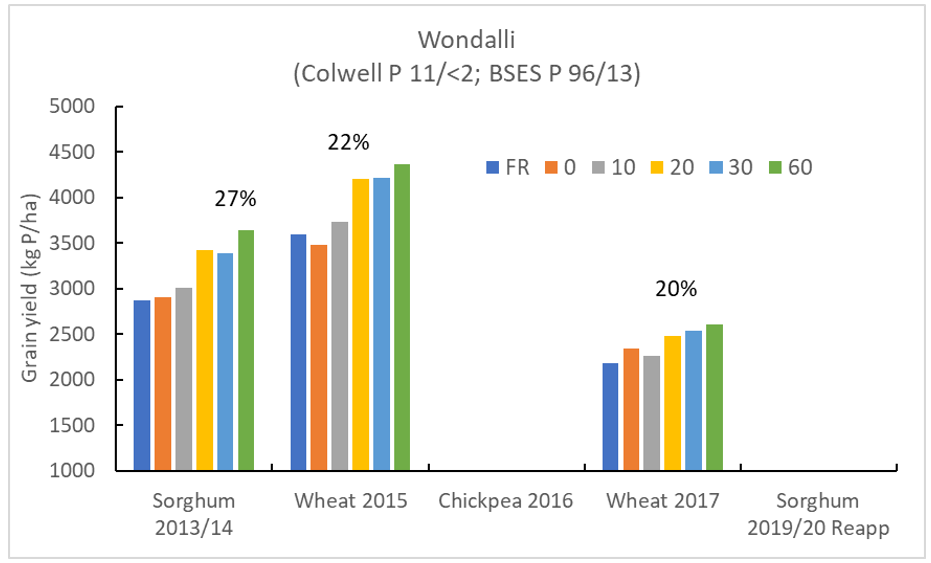 Figure 2. Contrasting P rate responses in wheat and chickpea crops in the 1st, 2nd and 5th crops in crop sequence at the deep P site at Wondalli. The chickpea crop in 2016 and the sorghum crop in 2019/20 were not harvested due to excessively wet conditions.
Plant responses to deep banded nutrients
At very low background P and K supply (mainly CQ sites)
We have had the opportunity to look at the minimum P and K requirements to grow sorghum and chickpea crops at sites in Central Qld (CQ), where both topsoil and subsoil P and K are very low and where fertiliser nutrients generate a very clear yield response. These results are shown in Figure 3 below for P (Figure 3a) and K (Figure 3b) and illustrate a number of important points. Firstly, chickpeas seem to be able to more efficiently convert additional P and K uptake from applied fertilisers into grain yield compared to sorghum. The reasons for this are currently not known but may be related to the timing of nutrient uptake relative to the yield determining processes. Chickpeas are slower to develop an extensive root system and proliferate roots in P bands, but when they do it is closer to the onset of flowering and pod addition. Conversely, sorghum quickly develops a root system that can rapidly exploit sources of P or K, but this early nutrient access occurs long before determination of grain yield and may not as directly contribute to yield development. For example, additional tillers that typically form in response to improved crop P status may not have sufficient moisture (or nutrition) to deliver higher grain yields later in the season.
The second point to notice is that ‘poor’ sorghum crops are able to acquire more P and K from soils with similar low nutrient status than chickpeas. This is consistent with more frequent in-season rainfall events that either enhance root access to stratified topsoil layers or having in-season rainfall events that allow deep bands to ‘re-wet,’ providing prolonged access to those deep bands. It is worth noting here that deep sowing of chickpeas, which commonly occurs in CQ, would further restrict access to stratified topsoil P or K during the season.
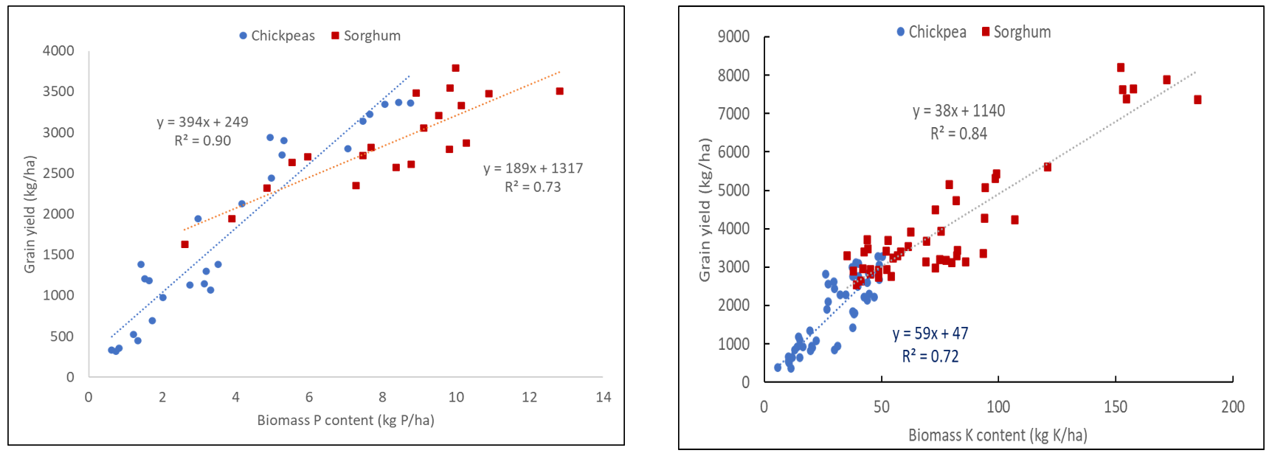 Figure 3. The relationship between biomass P (a (left)) of K (b (right)) uptake and grain yield for sites characterised by low P and K in the soil profile. Most sites in this analysis were from CQ, although the single low K Vertosol site in Southern Qld was included in the K dataset.
The third point is that in these studies we generally did not see any evidence of luxury uptake of P or K from deep banded fertilisers of either kind. This suggests that for every additional kg of P or K acquired in these soils, a relatively predictable grain yield increase will occur, and that the higher the seasonal yield potential the greater the crop nutrient requirement. While handy for discussions with the bank manager, this finding does highlight that a single application of deep bands of P and K will not be enough to overcome the yield constraints that have developed from prolonged nutrient run down. This is consistent with other glasshouse and lysimeter studies (van der Bom et al., 2022) and supports the hypothesis that a multi-pronged approach to restoring soil fertility is required. Deep bands are not THE solution to declining soil P and K fertility. While they can produce significant and economic yield responses, they need to be combined with fertiliser strategies that also ensure adequate P and K is maintained in the topsoil layers, so crops can utilise multiple soil layers when seasonal conditions permit.
Including sites with higher topsoil P, introducing variable reliance on deep P bands
The inclusion of sites with a broader range of soil P fertility, primarily in the top 10cm, brought more site-years into the analyses shown in Figure 3, and provided enough wheat seasons to provide relationships to compare with chickpeas and sorghum. Unfortunately, there were not enough K sites on vertosols to undertake a similar analysis, although there is very low soil K found in other soil types like the ferrosols of the inland Burnett.
 Figure 4. The relationship between biomass P uptake and grain yield for all sites regardless of topsoil P status, and in SQ as well as CQ. All sites had subsoil Colwell P <8 mg P/kg. Higher topsoil P concentrations and wet seasonal conditions resulted in higher crop P uptake and non-linearity in the relationship between P uptake and grain yield in both wheat and chickpeas.
This analysis showed that for both wheat and chickpea, up to 10 (chickpeas) to 12 (wheat) kg P/ha in crop biomass was required to meet demands of the highest yielding crops in these studies (i.e. 3t/ha for chickpeas and 4-5 t/ha in wheat). Each kg P/ha less than those thresholds would see potential yields drop by 330 kg/ha in wheat and by 230 kg/ha in chickpea. The data for sorghum is less clear, although there is also a suggestion that crop P uptake of 12-15 kg P/ha would meet demands of all except very high yielding sorghum crops (>6 t/ha). If the crops that achieved low yields despite high P uptake (often due to N deficiency) were excluded from this analysis, yield potentials would fall at a similar rate to wheat for each 1 kg P/ha reduction in crop uptake.
How much P can crops acquire from deep P and K bands
We have been unable to precisely quantify where the P or K accumulated in crop biomass has come from – either the background soil or the applied fertiliser in the deep bands, or varying proportions of each depending on seasonal conditions. We have instead primarily used differences in crop P/K accumulation between fertilised and unfertilised treatments, or deep ripped and tilled treatments versus the standard commercial practice (Farmer Reference) at each site. This is probably a reasonable approximation in sites with very low P in the topsoil and subsoil, as there is not much other P to find. However, these calculations become less certain when there is either high P/K in the top 10cm (with seasonal conditions determining different access to that layer from year to year), or still some background Colwell P or exchangeable K in the soil profile (e.g. when subsoil Colwell P is >5 mg P/kg or exchangeable K is >0.15-0.25 cmol(+)/kg). The use of tracers in deep bands will improve the precision of these estimates. This will be important to determine how efficiently these potentially expensive deep banded applications are being utilised. We have had some success using the natural abundance of Rubidium (Rb) to track uptake of fertiliser K, but have typically found that this approach is less successful after the first crop in the sequence following deep banding. Using isotopes of P (and K?) are approaches that are currently planned for investigation as options in future research.
Accepting the uncertainties in the estimates based on the preceding paragraph, our best estimates suggest that the most additional fertiliser P accumulated by winter crops (wheat or chickpea) is ~3-4 kg P/ha, while that of summer sorghum can be a little higher at 4-6 kg P/ha. Apparent uptake of fertiliser K is higher than P, ranging from 10-30 kg K/ha in winter crops and 10-40 kg K/ha in sorghum. We suspect the slightly greater recovery from deep bands in sorghum is due to seasonal conditions that typically see at least one in-season rainfall event where falls of 50mm or so can rewet the profile to the depth of the deep bands. Rainfall events in winter are typically smaller, and once the deep band vicinity is dried out by root activity, it remains dry and the nutrients unavailable until the profile refills again during the fallow. The timing of deep band access, when any rewetting occurs, the amount of nutrient acquired from the bands and the background nutrient supply from other soil layers (P and K in the top 10cm, and N from the whole soil profile) will determine the impact of that acquisition on crop response.
There are two observations that should be noted in relation to this. The first is that the figures above represent crop recoveries from a single application of deep banded P and/or K, with bands spaced 50cm apart. While we do not have many examples of situations where we have re-applied these bands after 5-6 years, we have seen a doubling of apparent P acquisition when fresh P bands were applied in different positions in some sites from CQ. We can’t say whether this is because the residual P in the old bands has been depleted/less available, or whether the crops are responding to a doubling of the P-enriched soil volume in the 10-30cm layer (i.e. now two bands rather than one). However, it does lend support to a potential rebuilding of subsoil P fertility by repeated deep P banding over time.
The second is that the much larger apparent recovery of K from deep bands than P and the implications this will have for the frequency of reapplication. Crop removal of K in harvested grain (15-30% of total crop uptake) is a much smaller fraction of total nutrient uptake than the equivalent for P (70-90% of total crop uptake, or greater in low P crops). When combined with the greater total uptake of K, we see an apparently rapid depletion of the deep banded K and a re-enrichment of the surface 10cm layer by the residues. This would suggest that once subsoil K is depleted, more frequent applications may be required for this nutrient than for P, although more work is needed in this instance.
Some local experiences with deep P at Merinda Farms (Michael Ledingham)
Exposure to deep P started some years ago when we hosted trial work organised by Dave Lester. Through soil testing and these trial observations we realised P concentrations were generally low at depth across the farm, although surface P levels were not too bad.
In 2013 we applied fertiliser to 50ha in different fields across the farm in test strips to assess the benefits at a larger scale. We applied 100 kg/ha Starter Z, at row spacing of 20cm to depths of 20-25cm using an old AFM cultivator with 650 lb tyne breakout. It was slow and time consuming, as the AFM wasn’t really up to the task.
Gavin McDouall inspected the crops grown for a year or two later. I think both Gavin and our team thought that there were visual differences during various crops and crop growth stages, although yield recording proved difficult. Problems with header monitors and operators inputting incorrect settings were just some of the issues. The onset of the drought curtailed crop activity and any attempts to monitor those strips ceased.
To the present day.
We feel that improved telematics on the headers, combined with weigh scales on chaser bins and trucks, may mean that many of the harvest issues are now behind us. More recently we have converted a ‘cotton ripper’ with tyne spacing at 75cm, and so we are able to place fertiliser 25-30 cm deep. Our aim is to apply at a sufficient rate to last for 5 years through our cropping rotation. We just need fertiliser prices to come down!
Conclusions
Our farming system relies on accessing soil water stored in the profile over fallow periods to overcome the large in-season variability experienced in the northern grains region. For this system to function, crops need to be able to access both water and nutrients from subsoil layers for extended periods in the growing season. Depletion of native fertility reserves from these deeper layers, and the inability to leach P and K into deeper layers mean that unlike N, fertiliser strategies are increasingly having to consider direct subsoil nutrient replacement.
Soil surveys and conversations with growers, agronomists and advisers across the NW slopes tend to indicate subsoil K could be marginal based on experiences from sites in southern and central Qld, but being a soil and region specific limitation, on-farm test strips are most likely best method of validating this.
Deep banding methods have been well researched, with aspects of the fertiliser products, placement depth and band spacing now well defined. Relationships between additional crop P/K uptake from deep bands and likely grain yield responses have been developed to help in economic considerations. However, the size of crop response to deep banded applications of both nutrients in any season will depend on factors such as soil fertility status in topsoil and subsoil layers, in-crop rainfall and the availability of the other nutrients needed to support higher crop yield potentials.
Deep banding has proven to be profitable in many situations, but responses have been less impressive in others for a variety of reasons. Gowers need to develop a clear picture of the nutrient status of the topsoils and subsoils of all their fields to identify likely nutrient constraints and where they occur. Then apply test strips in the fields most likely to be responsive, applying the likely limiting nutrient(s) at rates you would like to apply, and then at rates of double that (to make sure you can see potential responses). Don’t forget to include other nutrients that may be needed to support higher yield potentials (e.g. extra N) and be prepared to measure the crop response over time. The residual value of these applications will be a large contributor to the profitability of deep banding strategies. Ensuring that residual effects on crop yield can be measured easily is a key step to deciding whether an expanded program will pay in your soils.
Fertiliser prices will obviously impact on the profitability of any additional fertiliser inputs in cropping systems. However, there are some very depleted soils across the NGR, especially with P and the potential yield response to improved P nutrition is large. Weighing the costs of deep placement against additional crop production will ultimately determine individual investment decisions, but allowing the decline in subsoil fertility reserves to continued will create even larger problems for profitability and sustainability in the future.
References
Mike Bell, David Lester, Doug Sands (2020) Nutritional strategies to support productive farming systems.
Mike Bell, David Lester and Doug Sands (2020) Strategies to improve efficiency of use of applied N, P and K fertiliser in Central Queensland. CQ Updates November 2020 (on line)
Frederik van der Bom, Alwyn Williams, Nelly Raymond, Mike Bell (2022). Root research: What do wheat and sorghum roots do when water is in one part of the profile and phosphorus is in another? Root angle and why does it matter?
Acknowledgements
The research undertaken as part of this project is made possible by the significant contributions of growers through both trial cooperation and the support of the GRDC, the author would like to thank them for their continued support.
Contact details
Prof Mike Bell
University of Queensland
Gatton Campus, Gatton 4343
Ph: 0429 600 730
Email: m.bell4@uq.edu.au
GRDC Project Code: UOQ1207-001RTX, UOQ1606-002RTX,