Strategies to improve efficiency of use of applied N, P and K fertiliser in Central Queensland
Strategies to improve efficiency of use of applied N, P and K fertiliser in Central Queensland
Author: Michael Bell (University of Queensland), David Lester (Department of Agriculture and Fisheries), Doug Sands (Department of Agriculture and Fisheries) | Date: 19 Nov 2020
Take home messages
- Available moisture has been the main limit to productivity in recent seasons but using that water efficiently to produce harvestable yield is impossible without adequate nutrients
- The background nutrient status of soils in Central Qld is variable, but there is an increasing reliance on fertilisers to meet the demands of both cereal grains and pulses
- With more $/ha invested in fertilisers, comes a need for efficient use of that fertiliser to ensure there is a return on that investment
- A common cause of low efficiency of fertiliser recovery in cereal and legume crops is that nutrients and water are increasingly located in different parts of the soil profile
- There needs to be greater consideration of fertiliser placement, product and timing to improve fertiliser nutrient recovery, and strategies need to be based on a solid understanding of the interactions between crop root systems, soil characteristics and nutrient dynamics against a background of variable seasonal moisture availability.
Introduction
This paper is based on results from a series of long term research investments supported by GRDC in the northern grains region, initially focussed on improving phosphorus (P) and potassium (K) management and more recently on nitrogen (N). These are the major fertiliser input cost in grains systems. The research initially focussed on identifying how our soils have changed during extended periods of cropping, and what this has meant for nutrient availability. Quite early on, we found widespread evidence of declining or limited background soil fertility in the alkaline clays that support our cropping systems. Even where fertiliser use was more intensive, crops often struggled to obtain nutrients when needed, due to fluctuating moisture availability and root activity in different parts of the soil profile. It was also very evident that the efficiency of recovery and use of applied (typically N) fertilisers were often relatively poor in the season of application, and that nutrient management needed to be considered across a crop rotation cycle, rather than on an individual crop-by-crop basis.
In short, the research has shown that we need to do more than just increase the rates and the mix of nutrient inputs under traditional application practices putting nutrients into the topsoil layer. It has shown that unless we get things like fertiliser placement and timing right, and understand the interactions of these management levers with fluctuating seasonal conditions and the peculiarities of nutrient requirements for each crop in the rotation/crop sequence, we risk continuing to see inefficient nutrient recovery and cropping systems that do not achieve their water-limited yield potential.
This paper endeavours to highlight some of the critical success factors that will provide the best chance of success for future fertiliser management programs, focussing on the macronutrients N, P and K. It will draw on examples from across the northern region but will include data collected from sites in Central Qld run by Doug Sands and his team from Emerald (DAF). Doug will provide more locally relevant messages in a subsequent paper at this Update, which focusses on a detailed analysis of on-farm trials from across the region.
Nutrient and water dynamics in clay soils and implications for crop nutrient uptake
Before we discuss application strategies for each of these major nutrients, it is worth noting how we manage these soils in our cropping systems, and what this means for crop nutrient supply. The tillage system used across the region is now predominantly no till, with the occasional strategic shallow tillage operation to achieve a particular objective – e.g. control of hard to kill or herbicide resistant weeds, or banded applications of fertilisers - typically pre-planting surface nitrogen. This means that nutrient input from crop residues, manures or fertilisers tends to be either onto the soil surface and/or in infrequent relatively wide bands with very little mixing through the soil layer from tillage.
This contrasts strongly with what we are trying to achieve for our soil water, which targets a uniform and deep profile refill during the fallow, allowing stored water to support crop growth during dry periods. The quicker we can get water to infiltrate away from the soil surface, the less chance it will evaporate and be lost for use by a subsequent crop. That said, once soil cracks are closed and the topsoil is wet, infiltration rates can be very slow (1-5mm/h). If relying on water to move nutrients deeper into the soil profile, we would therefore expect more extensive movement from applications made early in the fallow. However, our traditional approach has been to delay fertiliser application (typically based on nitrogen applications from N budgets) until much closer to planting. That means the chance of achieving a well-distributed nutrient supply from these application times is low even for ‘mobile’ nutrients, with the risk of fertiliser nutrients being largely confined more to the shallow topsoil layers while our water is stored throughout the rooting depth.
Will redistribution of nutrients with water even work in these heavy clay soils? The answer depends on the nutrient, how they interact with the soil and so how they move to the crop roots for uptake. Nitrogen, and in particular the mineral form most commonly found in soil and taken up by plants (nitrate-N), is not strongly attracted to soil surfaces. It can therefore occur in relatively high concentrations in soil water, and so nitrate-N will move to the root with water in a process known as mass flow and be taken up by the plant. In the table below (adapted from Barber 1995), 80% of the crop N uptake by maize grown on a silty loam soil in the US has been derived from this movement in the soil water stream entering the plant. These same principles mean that nitrate-N will also move with a wetting front as water infiltrates into a soil, and suggests that we can use water movement to move (‘leach’) N into deeper profile layers, for availability during times when the surface layers are dry.
Table 1. Estimated contributions of diffusion and mass flow to the acquisition of major nutrient ions in maize grown in field conditions in a silt loam (Mollisol) and yielding 9,500 kg grain/ha
Nutrient ion | Diffusion (Kg/ha) | Mass flow (Kg/ha) | Crop nutrient uptake (Kg/ha) |
|---|---|---|---|
Nitrogen (N) | 38 | 150 | 190 |
Phosphorus (P) | 37 | 2 | 40 |
Potassium (K) | 156 | 35 | 195 |
Phosphorus (P) and potassium (K) are in marked contrast to N, with only 5% (P) to 15% (K) of crop uptake derived from nutrient movement in the soil water flow to roots (mass flow). This is because both P and K are held much more tightly to the soil surfaces than nitrate and are thus at much lower concentrations in the soil water. Their uptake mechanism is by diffusion – moving along a gradient from high to low concentrations in the soil water. The relative insignificance of mass flow to supply P and K in the maize example will be magnified in our heavy clay Vertosols, especially for K, given the much higher cation exchange capacity (CEC) that ensures even lower K concentrations in soil water. It is therefore highly unlikely that significant amounts of P or K applied to the soil surface or with limited soil mixing will move into deeper soil layers as the soil water refills. These nutrients stay where they are placed in all but very sandy soils, which is illustrated with data from the same rates of K applications made to three different soil types in Figure 1. The only evidence of K leaching was in the sand with a CEC of 5 cmol/kg.
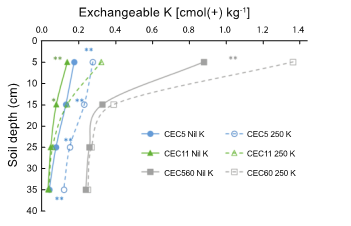
Figure 1. Examples of the mobility of K through the soil profile after an application of 250 kg K/ha
(as KCl) applied into soils with contrasting cation exchange capacities (5-60 cmol(+)/kg) in northeast Australia (Bell et al. 2009; Halpin et al. 2019). Soil samples were collected in 10 cm increments to
40 cm at 12 months and 750-950 mm of rainfall after fertiliser application.
So, how do these basic principles apply to fertiliser management strategies in our Vertosol soils? We discuss key considerations for each nutrient in the following sections.
Management of fertiliser N
The fact that N can move with soil water, usually leads to at least some N being co-located with water throughout the soil profile. Several factors will determine how effective this redistribution has been. Chief among these is how wet the soil profile is when N is applied (determining the rate of profile refill) and the amount of rain that falls after the N has been applied (i.e.. the delivery mechanism). As noted earlier, rates of infiltration decrease as soil wets up, so nitrate N that is present early in the fallow when the soil is drier should penetrate deeper than nitrate N that is mineralised (from residues or soil organic matter) or derived from fertilisers applied later in the fallow when the profile is wetter. A good example of this is the data collected by Daniel et al. (2018) in a trial at Billa Billa. Urea was top dressed onto the field in December (early fallow), March (mid fallow), post-sowing pre-emergence (PSPE), or spread in-crop, after which a crop of wheat was grown and soil resampled in November after harvest. The crop struggled in a dry season, yielding only 1.1 (no N) - 1.8 (200N) t/ha, with the PSPE and in crop applications yielding the same as the unfertilised control, while the December and March applications averaged 1.7 t/ha. The post-harvest soil sampling showed the impact of timing of urea application on distribution of N in the soil profile, with much deeper N distribution when the urea was applied early in the fallow (Table 2). Unfortunately, drought limited the ability of the crop to use that deeper N effectively in that season. In the case of N applied at sowing or later, the lack of any crop N response that season was consistent with the shallow distribution of N and the marooning of fertiliser N in dry topsoils due to lack of ineffective in-season rainfall.
Further soil sampling at this site after another fallow and prior to sowing sorghum in 2018, showed more uniform amounts and distributions of residual N from the 2017 applications, and no evidence of fertiliser N movement below 70 cm after another ‘dry’ fallow. In short, it takes time and a substantial amount of rainfall to ensure that N is distributed with water to support crop growth, and in Vertosols this may mean you recover fertiliser N in the second crop AFTER the application was made, or even further into the crop sequence. There are a number of risks with this carryover N strategy, including possible denitrification losses in a very wet fallow, or inefficient N fixation from legume crops that may follow a grain crop with unused fertiliser N in the soil profile.
The key message is that it is hard to ensure good fertiliser N uptake by a targeted crop growing on a Vertosol in all bar very good growing seasons if N is applied late in the fallow or at planting, due to asynchrony between rainfall recharge, root activity and nitrate-N availability. However, it is important to not blindly extrapolate this message to other soil types or situations. For example, in sandier soils where drainage rates are high, delayed N applications are essential to prevent leaching of N beyond the root zone before the crop can access it. Also in situations where there are regular irrigation or rainfall events during the growing season to promote shallow root growth, nitrogen and other nutrients have less need to get deeper in the soil profile to be taken up by plant roots.
Table 2. Depth distribution of soil nitrate-N at harvest (net of untreated control) arising from urea applications delivering 200 kg N/ha at Billa Billa in November 2017
(Data reproduced with permission from R. Daniel)
N spread in December | N spread in March | N spread post-sowing/ pre-emergence | N spread in-crop | |
|---|---|---|---|---|
Rainfall – application to planting | 279mm | 154mm | - | - |
Rainfall – application to harvest | 465mm | 340mm | 186mm | 160mm |
Soil depth (cm) | Additional nitrate-N (kg/ha) compared to unfertilised control | |||
0-15cm | 32 | 70 | 36 | 82 |
15-30cm | 48 | 48 | 4 | 2 |
30-45cm | 35 | 11 | 4 | 2 |
45-60cm | 20 | 7 | 4 | 2 |
The impact of these types of effects on performance of rainfed crops grown on Vertosols will vary with seasonal conditions and background soil N status. In contrast to the 2017 season in the Daniel et al. (2018) report, years with well-distributed in-season rainfall will support crop access to shallow mineral N, as root activity will be maintained in topsoil layers that remain moist. Similarly, a soil with the capacity to mineralize a lot of N during a fallow (e.g. high soil organic matter content or the presence of legume residues) will see smaller impacts of late fertiliser N application, as N derived from organic matter or legume residue decomposition will have mineralized throughout the fallow and been distributed with water down the profile. The same will apply for residual fertiliser N left in shallow soil layers from the previous crop season. However, crops being sown into profiles with very low mineral N (due to low labile organic matter, denitrification losses resulting from a big waterlogging event or an unexpectedly high yielding previous crop), will be much more likely to experience N deficiencies due to poor fertiliser N recovery, unless our current fertiliser N application strategies are modified. The presence of cereal crop stubbles low in N will potentially make these types of situations worse, as fertiliser N can be temporarily immobilised by microbes trying to decompose crop residues, further delaying N movement deeper into the root zone.
Recent work by Janke et al. (2020) has also shown that applying urea fertiliser in concentrated bands can further slow the redistribution of fertiliser N, both laterally and vertically. This is due to retention of fertiliser N in the ammonium form (NH4+) due to temporary inhibition of the microbes located around that fertiliser band that convert that N form to more mobile nitrate. These effects are most pronounced when N rates are high and band spacings are wide, with N rates >100 kg N/ha applied on 1 m spacings (e.g. for cotton) a good example. The delayed production of nitrate and subsequent reduced level of N leaching down the profile further restricts the volume of soil enriched with N from the applied fertiliser, providing an additional limitation to root access and crop N uptake. Research conducted in southern Qld and northern NSW in the NANORP program from 2012-2015 showed that on average, 35-40% of the fertiliser N applied at or before sowing of summer sorghum remained in the soil after crop harvest, with the overwhelming majority of that still in and around the fertiliser band (Bell et al. 2016).
Findings from both the summer sorghum and winter cereal research on Vertosols suggest that crops recover soil mineral N distributed through the profile with much greater efficiency (70-80%) than when fertiliser is applied in bands at or near sowing. It is only with time and rainfall that this year’s banded N fertiliser becomes next season’s soil N distributed more thoroughly through the soil profile.
Management of fertiliser P
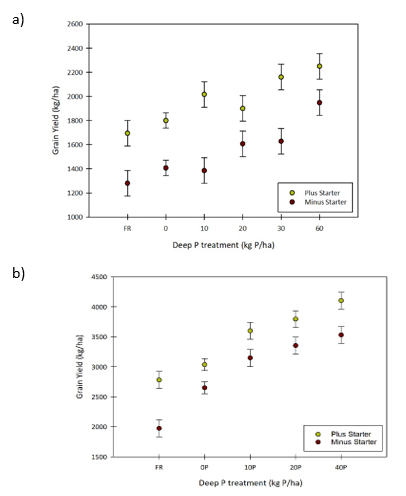
The substantial responses to deep P bands across the northern region where subsoil P is low have been detailed in a number of recent publications (Lester et al. 2019b, Sands et al. 2018), with these responses typically additive to any responses to starter P fertiliser (the traditional P fertiliser application method – e.g. Figure 2a, b). Simple differences in biomass P uptake in a single season suggest that the amount of additional P accumulated from deep bands (3-5 kg P/ha) is substantially greater than that from starter P (which typically supplies only 1-1.5 kg P/ha), and occurs irrespective of the presence of starter P (Figure 2).
Perhaps one of the most significant findings from the deep P research has been the relative consistency of P acquisition from deep bands, despite significant variability in seasonal conditions. Research results from sites in Central Qld (CQ) have often provided the best examples of this, due to the extremely low subsoil P reserves in some of those sites. There is not much P to find anywhere else in the subsoil outside the deep P bands! Interestingly, this type of soil P distribution may be the explanation for the variability in responses to starter P in early research conducted in CQ. Early growth responses were consistent with the crop obtaining an extra 1-1.5 kg P/ha from the starter application, but a lack of P elsewhere in the soil profile limited the ability of crops to find enough P to grow any additional biomass and fill grains.
The inability to acquire P from a depleted subsoil, places greater importance on access to P in the topsoil, which means that seasonal rainfall distribution can have a huge impact on crop P status. Bell et al. (2020) provided an interesting case study that contrasted P uptake by sorghum and chickpea crops grown in consecutive seasons with very contrasting rainfall distributions (Figure 3) at a site near Clermont. The sorghum crop experienced reasonable rainfall during the first 40 days after sowing, ensuring the topsoil remained wet and the crop could forage for P in surface layers, while the chickpea crop was sown below the top 10 cm and experienced no significant in-crop rainfall during the entire season.
Figure 2. Response to different rates of deep P with and without applications of starter P fertiliser in (a) a wheat crop at Condamine in 2018 wheat, and (b) a sorghum crop at Dysart in 2018/19. The vertical bars represent the standard error for each mean. (Lester et al. 2019a)
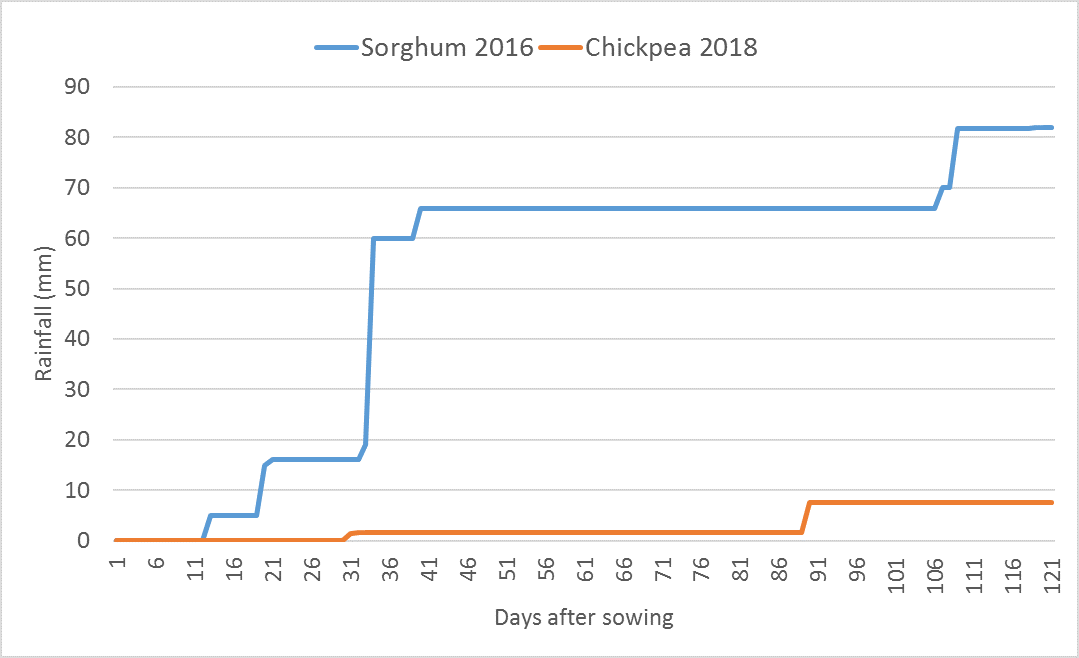
Figure 3. Cumulative in-crop rainfall for consecutive crops of sorghum (2015/16) and chickpea (2018) grown at a site near Clermont, in Central Queensland (Sands et al., 2019)
The crop P uptake without deep P bands was ~ 3kg P/ha in the sorghum crop, but only 0.6 kg P/ha in the chickpeas – indicative of how low the P was in layers below the top 10cm. Treatments with deep P bands were able to supply an average of 3 kg P/ha to both crops (3.3 kg in the sorghum and 2.7 kg in the chickpeas), and this additional P supply resulted in an average yield increase of 1 t/ha in each case. These increases turned what would have been a failed chickpea crop (0.3 t/ha without deep P) into a profitable crop in a tough season (1.3 t/ha) and converted an average sorghum crop (2.3 t/ha) into a good one (3.8 t/ha).
However, what is interesting is the relationships between crop P uptake and grain yield at these sites. An example from three consecutive crops at a site near Dysart is provided in Figure 4, illustrating that in all crops the grain yield in each season was linearly related to the amount of P the crop could access – despite re-applications of deep bands prior to the 2019 season. This suggests that while deep P banding is certainly effective and profitable, single applications are not able to eliminate P deficiency when soil P status is very low – regardless of the application rate. This may be related to rapid drying out of soil around the band as roots proliferate in response to the higher P status, with that drying limiting the amount of P that can be taken up by any crop unless seasonal conditions allow the band to rewet during the season. This highlights the ongoing challenge of managing P supply in rainfed cropping systems on these soils.
Work is currently underway exploring the ability of crop root systems to respond to a P-enriched patch (band) or P distributed through a soil layer, with wheat and sorghum. Other work is exploring the most effective P formulation (MAP), form (no advantage of liquids compared to granules) and band arrangements to maximize crop uptake. Further work is needed to determine the best approaches for deep P reapplications, in order to maximise the P available to meet crop demand. However, it is important to remember that the most important factors determining response to P fertiliser are crop demand (seasonal yield potential) and the amount of P the crop can actually recover. Seasonal moisture availability in general, and especially moisture availability in and around the P-enriched part of the soil profile, will play a key role in determining both of these factors.
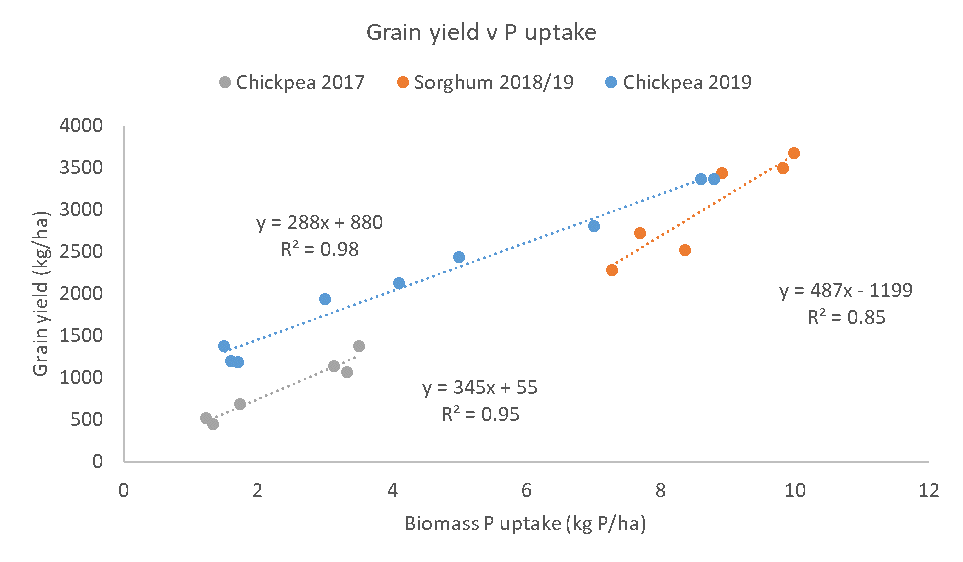
Figure 4. Relationship between P uptake in crop biomass and grain yields in three consecutive crop seasons at a site near Dysart, in Central Queensland
Management of fertiliser K
Potassium is a major nutritional challenge emerging in the cropped Vertosols and, given the relative immobility of K and the amounts taken up by crops (e.g. Table 1), it provides a significant challenge to fertiliser management programs. There has been less research on K management in clay soils nationally and internationally, as K infertility has not traditionally been a problem due to adequate initial reserves. Research in this space is therefore breaking new ground.
In some ways, K application strategies are less complicated than those for P, but in other ways there are much greater challenges. In terms of the reduced complexity, it is worth noting that unlike for P, there is no early season K requirement to optimise a physiological process such as establishing potential grain number. There is therefore no need for ‘starter K’, which is useful given the potential establishment impacts of using fertilisers like muriate of potash (MOP), that has a high salt index, near establishing seedlings. In addition, despite the much higher crop uptake of K than P, the removal rates tend to be similar to P for grain crops (i.e. 2-3 kg P/t vs. 3-4 kg K/t), and although higher in chickpeas (8-10 kg K/t) and mung beans (10-12 kg K/t) compared to P (2-4 kg P/t), the lower yields of these crops constrains overall rates of K export. This means that from a nutrient balance perspective, application rates of K do not need to be very high to match rates of removal.
Complications emerge from the impact of extended periods of high K uptake but low K removal (i.e.. a low K harvest index, as indicated in Figure 5) on the distribution of K in the soil profile. Residue return to the soil surface means large amounts of K are becoming increasingly concentrated in topsoil layers that are dry for extended periods, while subsoil K continues to decline. In wetter years, topsoil K availability can be good, but in dry years (when crops are living happily on moisture stored in the subsoil), periodic deficiencies of K can occur over large areas. We have seen widespread evidence of these effects in recent dry seasons.
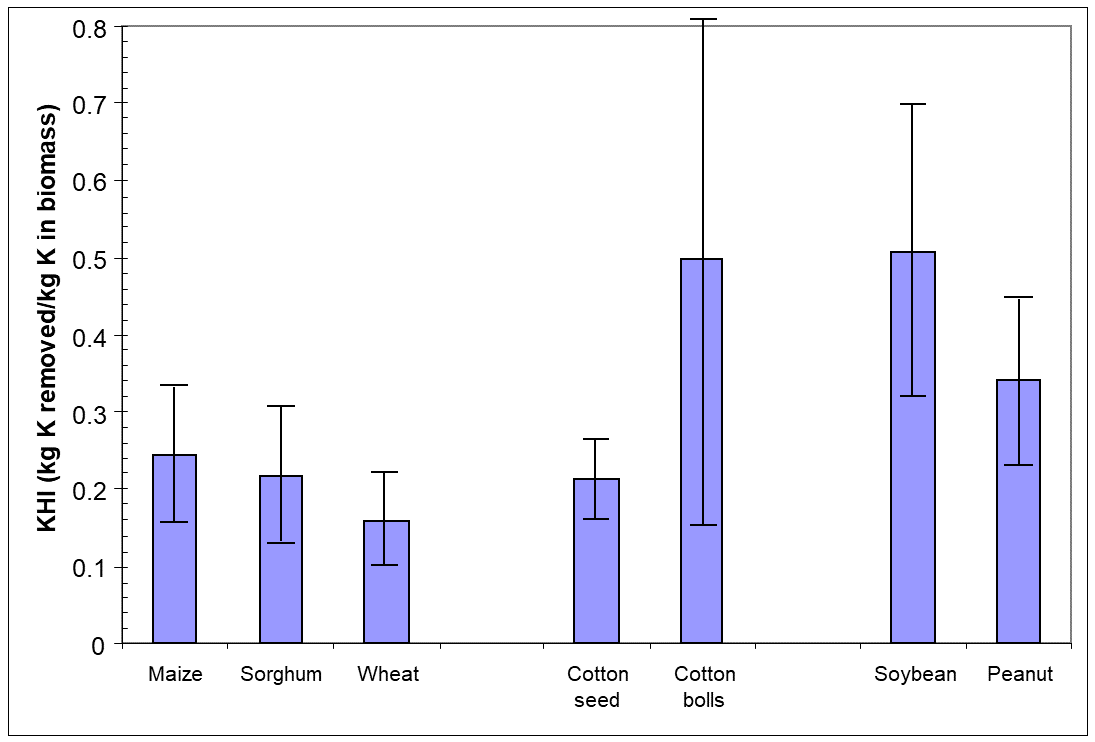 Figure 5. The K harvest index (KHI = K removed in grain/total K uptake by the crop) for a range of crop species grown on a long-term K site at Kingaroy. The columns show the average for that species, while the error bars indicate the range between crops with luxury K status (low KHI) and those that are strongly K deficient (high KHI)
Grain yield increases in response to fertiliser K applications in Vertosols have been limited to sites in CQ and the inland Burnett with low subsoil K, although we have also run trials on soils with marginal K status in southern Qld that have been able to provide insights into crop K acquisition from fertilisers. Soils with critically low K also tend to have low availability of other nutrients (like P), so responses tend to follow one of two patterns. The first is characterised by a dominant P constraint, with smaller additive effects of applying K once the P demand is met (the 2013, 2015 and 2017 crops in Figure 6). The other (rarer) situation is where P and K are equally limiting and the order of crop response changes with seasonal conditions and/or crop species (the 2016 season in Figure 6).
There is a strong likelihood of having to manage P and K simultaneously in many of the broad acre cropping sites in coming years, to optimise the efficient use of available water. These conditions are already reality in significant areas of CQ (especially on the open downs soils) and are approaching these conditions in the north west slopes of NSW and on box soils in southern Queensland. There are attractions in having to co-manage these nutrients, as plant roots do not react to a patch of K-enriched soil and so are not very efficient at exploiting K applied in bands. The traditional response to this has been to either disperse K through a large soil volume to increase the chance of root interception, or to co-locate K with other nutrients (like P) that do cause roots to proliferate in the fertilised zone. The former option is not suited to Vertosols (even if we went back to full tillage), due to the high CEC and K buffer capacity that limits the effectiveness of dispersed K in improving crop K acquisition on these soils. Maximising the effectiveness of bands remains an area of active research, as the extremes of chemical changes that can occur in concentrated fertiliser bands outlined in Meyer et al. (2020), such as pH changes and creation of super-saturated soil solutions, can cause a reduction in the solubility of the fertiliser nutrients – especially P. The duration of these effects, and their impacts on longer-term nutrient availability to plant roots, are still being determined.
Similar to findings in the P trials (Figure 4), there can be linear relationships between K uptake in crop biomass and measured grain yield (Figure 7). Data indicates that even though significant yield responses were recorded, the banded K applications have not always been able to exceed the seasonal K demand for the crop. In the Dysart example shown in Figure 7, the grain yield response to increased uptake of K is only 15% of that for P (i.e.. 288 kg grain/kg crop P, compared to 45 kg grain/kg crop K), but at far higher rates of K, similar levels of yield response can be obtained.
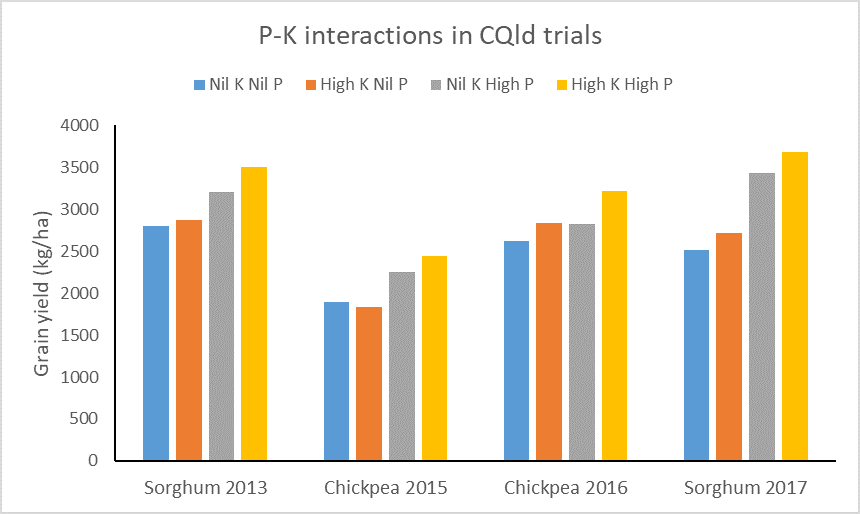 Figure 6. Grain yield responses to deep banded applications of P and K alone, or in combination, for chickpea and sorghum crops in different seasons at different sites across CQ from 2013-2017
One of the complexities that the field research program has unearthed has been the different dynamics of fertiliser P and K uptake when these nutrients are co-located in deep bands at application rates of 20-40 kg P/ha (100-200 kg/ha as MAP) combined with 50 kg K/ha (100 kg/ha as MOP). The residual benefits from the P applications have been recorded for up to 6 years at our longest running sites (although not maximising grain yields in the later years), and this long residual is consistent with what seems to be seasonally water-limited access to deep P bands that constrains P uptake to a maximum of 4-5 kg P /season. However, the measured uptake of K from deep bands can be 5-10 times higher than that of P, especially in wetter seasonal conditions. An example of this comes from the site at Dysart, where a re-application of 30 kg P/ha and 50 kg K/ha prior to the 2019 chickpea crop resulted in an average of 4.3 kg additional P uptake and an additional 19 kg K/ha in crop biomass. This means that at sites where both P and K are limiting, there may need to be more frequent applications of K or a change in the balance of P and K during reapplications. This is an issue that will require more investigation.
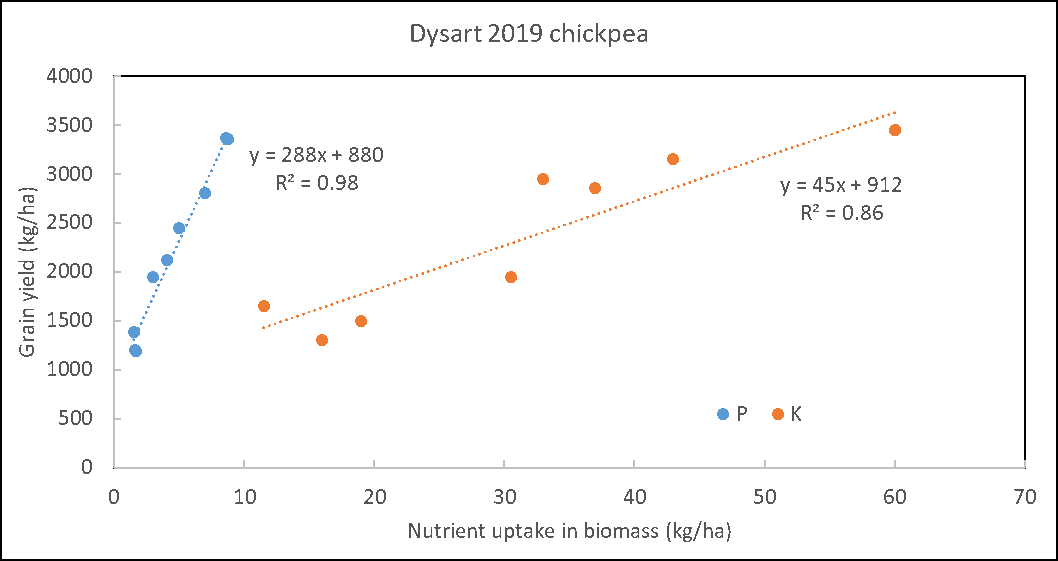 Figure 7. Relationship between P and K uptake in crop biomass and grain yields in the chickpea crop near Dysart in 2019
What does all this mean for Central Queensland?
The principles of nutrient behaviour discussed in this paper are relevant across all regions and cropping systems, but we have attempted to highlight the combination of soil and seasonal characteristics that represent why rainfed cropping systems on Vertosols are unique. The research we have referred to in the earlier sections comes primarily from fieldwork conducted in southern and central Qld, so we have every confidence that these principles are broadly applicable across CQ.
The soil and plant samples collected from our projects would suggest that, on average, soil fertility status in cropped soils in CQ is lower than in much of southern Qld – especially in the open downs soils. Lower inherent fertility on those soil types, combined with negative nutrient budgets driven by perceived riskiness of seasonal productivity, have contributed to this condition. That means there is the potential to drive large productivity and profitability increases from improved fertiliser management, with the financial risks of such a strategy minimized by the combination of soil characteristics and seasonal conditions that maximize the residual value of inputs across a cropping rotation.
The most widespread limit in CQ would appear to be P, as soils are often deficient in topsoils and chronically low in layers beneath that. Even in wet seasons when surface root activity is maximized, crops will struggle to obtain enough P to meet seasonal yield potential, and when the topsoil is only wet for a short period, or deep-sowing below the 10cm topsoil layer occurs, crops can be strongly P-limited. The responses to deep P bands have been consistent and highly profitable, so we would strongly advocate soil testing to characterise fields where such benefits will be greatest.
Responses to improved P status in chickpeas have been very consistent in CQ trials, but responses in grain crops can be limited by inadequate N availability. Conservative fertiliser N application rates, combined with the poor recovery efficiency typical of applications made once the profile is wet and ready to sow, contribute to this marginal N availability. There is often not much in the way of an N bulge in deeper profile layers (surplus N from previous seasons), so a change in the approach to N management will be required to deliver the higher yield potentials set up by deep P application.
Potassium management represents a growing challenge, and one that CQ growers will lead the way in developing management responses. As a constraint to productivity, it would currently rank 3rd on the list behind P and N, but that may change as subsoil K reserves are depleted. Unlike P, the target for applications will be exclusively into subsoil layers, as residue return will ensure adequate topsoil K status. Applications will need to contain other nutrients to encourage root proliferation and crop K uptake, but the optimal ratios and frequency of applications have yet to be determined. We would argue that K should become part of the fertiliser program before soil reserves become critically low, as maintaining a bank of K fertility will be more effective than trying to ensure that crop demands are met from isolated deep bands.
References
Barber SA (1995) Soil nutrient bioavailability: A mechanistic approach, 2nd edn. Wiley, New York
Bell M, Lester D, Sands D (2020) Nutritional strategies to support productive farming systems. GRDC Update Mungindi, Feb 2020.
Bell, MJ, Moody PW, Harch GR, Compton B, Want PS (2009). Fate of potassium fertilisers applied to clay soils under rainfed grain cropping in southeast Queensland, Australia. Aust. J. Soil Res. 47(1):60-73. doi:10.1071/sr08088
Bell M, Schwenke G and Lester D (2016). Understanding and managing N loss pathways. GRDC Updates in Coonabarabran and Goondiwindi, March 2016.
Daniel R, Norton R, Mitchell A, Bailey L, Kilby D and Duric B (2018). Nitrogen use (in)efficiency in wheat – key messages from 2014-2017. GRDC Update Goondiwindi, March 2018.
Halpin NV, Bell MJ, Rehbein WE, Moody PW (2019) Potassium fertilisation strategies for rotational grain legume crops - Implications for the subsequent sugarcane crop. Proc., 41st Conference of the Australian Society of Sugar Cane Technologists.
Janke CK, Moody PW, Bell MJ (2020). Three-dimensional dynamics of nitrogen from banded enhanced efficiency fertilizers. Nutrient Cycling in Agroecosystems.
Lester D and Bell M (2019a). Responses to phosphorus and potassium by grain crops in southern Queensland. Pp. 26-29. In: Weir D and Grundy T (Eds). Queensland Grains Research 2018-19. Regional Research Agronomy Report, QDAF.
Lester D, Bell M and Hagan J (2019b). Deep P update 2019 – Multi-year grain yield impacts and economic returns for southern Queensland cropping. GRDC Update Warra, March 2019.
Meyer G, Bell MJ, Doolette CL, Brunetti G, Zhang Y, Lombi E, Kopittke PM (2020). Plant-available phosphorus in highly concentrated fertilizer bands: The effects of soil type, phosphorus form, and co-applied potassium. J Agric and Food Chemistry 68, 7571-7580.
Sands D, Bell M and Lester D (2018). Getting nutrition right in Central Queensland. GRDC Updates at Emerald and Biloela, December 2018.
Sands D, Lester D, Bell M and Hagan J (2019). Responses to deep placement of phosphorus and potassium in chickpea – Clermont. Pp 45-52. In: Weir D and Grundy T (Eds). Queensland Grains Research 2018-19. Regional Research Agronomy Report, QDAF.
Acknowledgements
The research undertaken as part of this project is made possible by the significant contributions of growers through both trial cooperation and the support of the GRDC. The author would like to thank them for their continued support.
Contact details
Mike Bell
University of Queensland, Gatton Campus
Ph: 0429 600 730
Email: m.bell4@uq.edu.au
GRDC Project Code: UOQ1207-001RTX, UQ00066, UQ00078, UOQ1905-009RTX,

