Deep P and K - Outcomes from 8+ years of research: the good, the bad and the ugly
Author: Dave Lester (DAF Queensland), Doug Sands (DAF Queensland), Mike Bell (University of Qld) | Date: 01 Mar 2022
Take home messages
- Stratified soil testing guides fertility and constraint identification. These tests do not need to be conducted annually for immobile nutrients and constraints
- Research experiments with subsurface placement of fertiliser phosphorus (P) at around 20-25 cm on low Colwell P subsoil tests has significantly increased grain yield in central Queensland (CQ) across range of wheat, chickpea and sorghum crops. Winter cereals across southern Qld are generally also positively responding, but chickpeas and sorghum responses in this region have been mixed, ranging from positive to no effect. Data for northwest slopes and plains of NSW is very limited
- The relationships between crop P uptake and grain yield for chickpea, wheat and sorghum are robust. As you get more P into the plant, yields are increasing
- Potassium is an emerging yield constraint, but data sets are not yet as extensive as for P.
Background introduction
Current research into phosphorus (P), potassium (K) and sulfur (S) started in 2009 in DAQ00148 (Bell 2012) with a re-examination of the critical soil test values measuring the fertility status of soils across the northern grains region (NGR). The review established the consistent negative nutrient balance of macronutrients (NPKS) across all the subregions of the NGR confirming a declining fertility base of the soil resource. Observations of consistent depletion of P in the subsoil layers (10-30 and 30-60cm) were also made, and consistent with results of a long-term N x P experiment (Wang et al., 2007), this effect was shown to remain despite fertiliser P additions to the surface layers. These results highlighted the increasing stratification of immobile nutrients in topsoils across the region. The Wang et al. (2007) study from Colonsay had shown that approximately 50% of the net P removal occurred from below the top 10cm, with the majority being withdrawn from the 10-30cm depth.
Strategies to assess soil P fertility of both the 0-10 and 10-30cm layers started to evolve. The BSES-P method (a dilute sulfuric acid extractant) was found to provide some indication of a soils capacity to recharge the plant available P pool, as indicated by the Colwell-P test, through dissolution of slower release P minerals (McLaren et al., 2014). Using both the Colwell-P and BSES-P extractions, a preliminary set of critical drivers of P availability by layer was released in 2012 (Table 1) (Guppy et al., 2012). It was suggested from this work that Colwell P, BSES P and PBI (phosphorous buffering index) be used concurrently to determine likely fertiliser P responsiveness, and some guide as to the most effective application strategies (e.g., banding vs. dispersed P). These guidelines, while useful, were also only generalised indicators, with loosely defined ‘critical values’ and a broad grey area between what was considered likely to respond to P applications vs. unresponsive situations.
Table 1. Critical P values to determine likely response or drivers of P availability in northern Vertosols
Surface (0-10cm) | Subsoil (10-30cm) | |||
|---|---|---|---|---|
Colwell P | < 25 mg/kg | Likely to get starter response | < 10 mg/kg | Likely to get response to subsurface P placement |
> 60 mg/kg | Ensure good groundcover to limit erosion loss | > 100 mg/kg | Unlikely to see P deficiency | |
BSES P | < 25 mg/kg | Limited evidence of residual P fertiliser | < 30 mg/kg | Limited reserves of slowly available P. Consider replacement of removed P very 5 years |
> 100 mg/kg | High residual P fertiliser load or natural P fertility | > 100 mg/kg | Potential to slowly replace Colwell P reserves | |
Values for suggested soil K levels were also estimated with much less certainty (Table 2), with a hypothesis that clay content/clay activity (indicated by CEC) as well as mineralogy were likely to influence potential fertiliser K responsiveness (Guppy et al., 2012).
Table 2. Critical K values used to determine likely response or drivers of K availability in northern Vertosols
Surface (0-10cm) | Subsoil (10-30cm) | |||
|---|---|---|---|---|
CEC | ExK (cmol/kg) | High Mg (>30% CEC) | ExK (cmol/kg) | High Mg (>30% CEC) |
<30 cmol/kg | 0.2 | 0.4 | 0.1 | 0.2 |
30-60 cmol/kg | 0.4 | 0.7 | 0.3 | 0.5 |
>60 cmol/kg | 0.6 | 1.0 | 0.5 | 0.8 |
Field work in DAQ00148 included the preliminary proof-of-concept installation of a series of strip-trials on the Darling Downs where P and K fertilisers were applied into the subsoil (Bell 2012). This evolved into a range of nutrition omission experiments examining surface and subsurface addition of P, K and S both singly and in factorial combinations. These omission experiments assisted in validating the suggested ‘responsive’ end of the critical concentrations (Tables 1 & 2), with experiments measuring consistent large, single nutrient responses to applied P in both the surface and subsurface across much of the NGR (Moree to Emerald) (Bell and Lester 2012).
Having consistently generated positive responses to the application of some subsurface nutrition, the research then switched gear with the UQ00063 project into much more regionally spread experiments targeting subsurface P application. K was explored in a more limited number of sites that met the estimated criteria for K responsiveness based on the critical soil test values. For P, the UQ00063 research focussed on plant responses to increasing subsurface fertiliser application rates, typically with or without a starter application. Following the DAQ0048 work, which highlighted the interaction between P and K responses on soils in which low soil concentrations of both nutrients were recorded, K research explored increasing fertiliser K rates (at 20-25cm depth) with a basal P application, and a contrast set of treatments without P to explore a K only effect.
The regional subsurface fertiliser placement in UQ00063 was conducted at a constant band spacing distance (roughly 50cm). Both P and K uptake by roots are diffusion driven processes meaning banding is the most efficient option for applying these less mobile nutrients, as bands create a strong concentration gradient along which nutrients can move to adjacent root systems (Lester et al., 2018a). Derivate research in UQ00078, UQ00086, UOQ1805 and UOQ1905 then explored other factors influencing the effectiveness of subsurface banding of P and K fertiliser applications. This included laboratory, glasshouse and field experiments examining rate by band spacing interactions (varying the band frequency and the in-band concentration), the products and form of fertiliser used to deliver nutrients, the pH of the environment the fertiliser is placed into, and what happens when P and K fertiliser are applied together into the same band (Meyer et al., 2020). Also examined were interactions between root systems, water and P distributions and their impacts on plant P uptake (van der Bom et al., 2022). This research attempted to improve our understanding of the diversity of P dynamics in different Vertosols in the NGR (i.e. the relative importance of absorption/de-sorption typical of acidic pH soils compared to precipitation/dissolution reactions more common on calcareous soils) and incorporating that understanding into APSIM P module parameters (Raymond et al., 2021a).
The following results section attempts to distil this broad history of research projects (led by Prof Bell) into the current understanding on soil and plant P and K nutrition: the good, the bad and the ugly. However, before we discuss this it is worth re-capping how nutrients behave in soil and how soil nutrient supply meets crop demands. While this has been discussed in previous Update presentations (e.g. Bell et al.,2019), it is worth a recap as these characteristics will have a large impact on the effectiveness of any fertiliser program.
How nutrients are acquired by plants
Before we can devise an effective fertiliser application strategy for any nutrient, we need to understand how that nutrient behaves in soil and is acquired by plant roots.
Nutrients are generalised into two groups related to their behaviour in soils, and particularly their response to water movement through soil profiles: mobile and immobile. Plant roots have three main mechanisms to gather nutrient from soils: mass flow, diffusion and root interception (Barber 1995). All three mechanisms are used for every nutrient, but the proportion acquired through each varies.
Nitrogen is predominantly present in soil organic forms that need to be converted to mineral nitrogen (ammonium and nitrate) by microbial activity before plant uptake. Once in those mineral forms, particularly as nitrate, the concentration of N in the soil water increases and N becomes very ‘mobile’. Mass flow uptake means as the plant takes up soil water it accumulates nitrate-N dissolved in that water at the same time. As roots deplete the water (and N) close to them, water moves to the root from undepleted soil further away, bringing nitrate with it. So, for the most efficient nitrogen recovery we want the available nitrate distributed with the available water.
Phosphorus is the opposite of N in many ways, with most P in cropped soils present in inorganic forms of varying solubility. The fraction that is readily available for plant uptake is either in the soil water at very low concentrations or held (sorbed) onto clay and organic matter particles. The sorption and desorption processes can occur rapidly, but the net effect is that at any time there is a low concentration of P in the soil water. This means P resupply from water movement from other parts of the soil profile is limited, and P is considered an immobile element in clay soils or ‘where you put it is where it stays’. For roots to access P they have to grow into undepleted soil (or be very close to a concentrated P supply like a fertiliser band).
Because of the strong affinity of clays and organic matter for P, roots have to be very close to a P source/high P concentration so that P can diffuse to the root without being sorbed to other particles. Effective P uptake therefore requires either low P concentrations across large soil volumes, with roots always able to grow into soil with available P (perhaps our soils before cropping, in many cases), or concentrated patches of high P availability (bands, slots) which stay moist and where roots can concentrate in large numbers. Once you are relying on P fertilisers, placement is a critical success factor.
Potassium is an interesting blend of these contrasting characteristics. It is still held on clay and organic matter surfaces and occurs in relatively low concentrations in soil water. This means in our high clay soils it also is effectively immobile, although in lighter soils it moves a little further than P. What is challenging, though, is that roots don’t congregate around a patch of high K like they do with P, and so it is harder to get rapid uptake of K from a band – unless you put some P with K, to act as an incentive for roots to get interested and congregate in that area.
Deep P and K - the ‘good’
One of the strengths in the UQ00063 project was the extensive geographic distribution of experiments, with the majority extending from Moree (NSW slopes) to Kilcummin (CQ) (Figure 1). Approximately 30 experiments were established during the research phase.
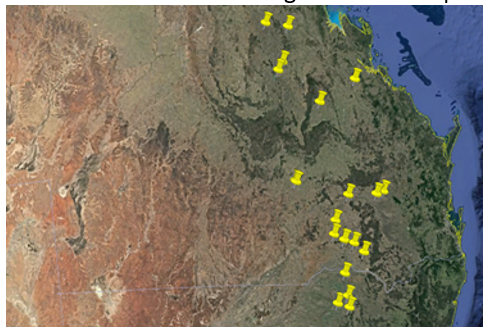
Treatments have generally consisted of rates of P (0 to 40 kg P/ha in CQ or 60 kg P/ha in SQ/NNSW) applied at ~20-25 cm deep in bands spaced roughly 50 cm apart. Sites where K was likely to be marginal based on site soil testing, primarily across CQ, K rates of 0 to 100 kg K/ha on same band spacing as P were made. The K rates were applied with and without P. Most (not all) Qld experiments include an untreated control, acting as a ’Farmer Reference’ treatment to gauge baseline production without tillage. Against this benchmark, the effects of ripping and application of basal nutrients (N, S, Zn) or the addition of various rates of fertiliser P and/or K in addition to the basal nutrients, were assessed. Table 1 provides an example of the treatment combinations used in the later years of the experimental program. All main P plots were then split to annual ‘with’ and ‘without’ starter P fertiliser applications at planting, to assess whether effects of starter P and deep P were complimentary. Crop choice at each site was dependant on the local rotation and the residual benefit of the different rates of applied P was tracked through subsequent growing seasons.
Table 3. Experimental treatments for Mt Bindango deep placed P sites
Deep P treatment nutrient application rates (kg/ha) | |||||||
|---|---|---|---|---|---|---|---|
Trt no | 1 | 2 | 3 | 4 | 5 | 6 | 7 |
P rate (as Mono Ammonium Phosphate) | FR* | 0 | 10 | 20 | 30 | 40 | 60 |
N rate (from MAP and Urea) | - | 40 | 40 | 40 | 40 | 40 | 40 |
Zn rate (Zinc Chelate) | - | 2.0 | 2.0 | 2.0 | 2.0 | 2.0 | 2.0 |
*FR= untreated ‘farmer reference’
Field research under UQ00063 concluded in June 2021. Currently the DAF and UQ research teams are compiling the substantial experimental data for final individual site and a broader project meta-analysis of aggregated data sets, so results presented here are still somewhat preliminary in nature. Not every crop responded in every year, and there are some sites with results still perplexing (see more on that later). However, our general conclusions from the starter x deep P rate experiments are that starter applications are beneficial for cereal crops across the region, with P application with seed at sowing ticking the box for early vigour and setting up of the crop. Overall, starter applications on most winter cereal crops increased yields compared to equivalents without starter application, while starter responses in both chickpea and sorghum were more variable.
An area in which further research is needed is the potential role of liquid starter P applications to apply low rates of starter P uniformly – particularly in summer cereals grown in wide rows, where the number of granules/m of crop row is small. Research has shown the P uptake from starter applications is typically small (only 1-2 kg additional crop P uptake), and so there is potential to ‘save’ on the rate of starter P addition to divert into other parts of the profile where crop recovery is more efficient (e.g., deep bands). Low-rate P applications are sufficient to stimulate root / shoot vigour, set potential grain number and reduce the variability in time to flowering / maturity. This has been observed in wide row sorghum plantings where rates of P application in starter applications are limited by higher in-band concentrations. It is logistically much easier to distribute small amounts of P as a liquid.
Responses to deep P bands
Central Queensland
The grain yield responses to subsurface P banding in Central Queensland for chickpea crops are typically very strong, while wheat and sorghum responses (where N isn’t limiting for cereals) are more seasonally and site dependent (Sands et al., 2021a).
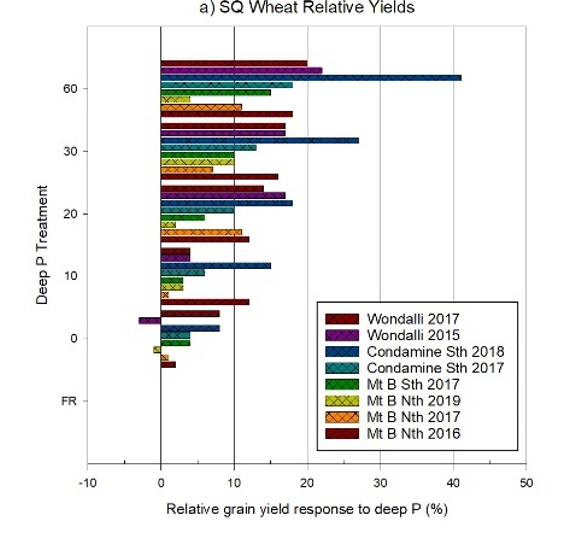
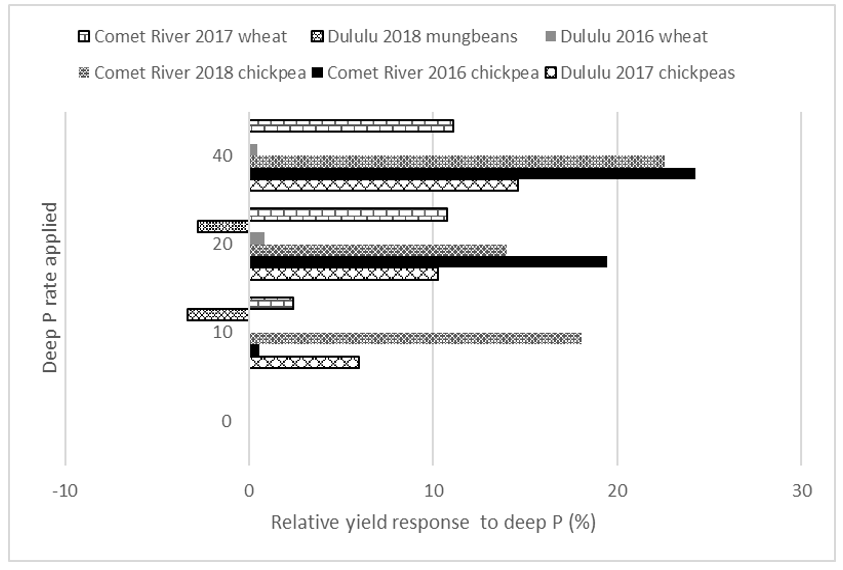
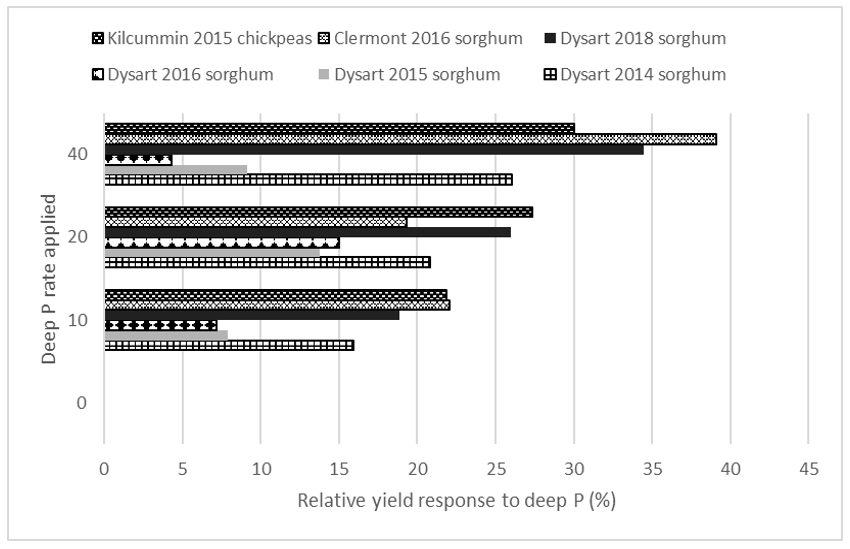
The relative yield responses in those sites with relatively high surface P (Figure 2) generally showed a maximum response of ~25%, with a significant amount of variability across the crop years. More than half the yield responses to the 20 kg P/ha and 40 kg P/ha rates represented yield increases of 10% or lower (Figure 2). This contrasts with the relative response to 20 kg P/ha and 40 kg P/ha rates in those sites that had much lower surface P concentrations (Figure 3), in which 75% of the responses produced yield increases of 15% or more. The maximum relative response was also higher, with close to a 40 % increase in grain yield (Figure 3).
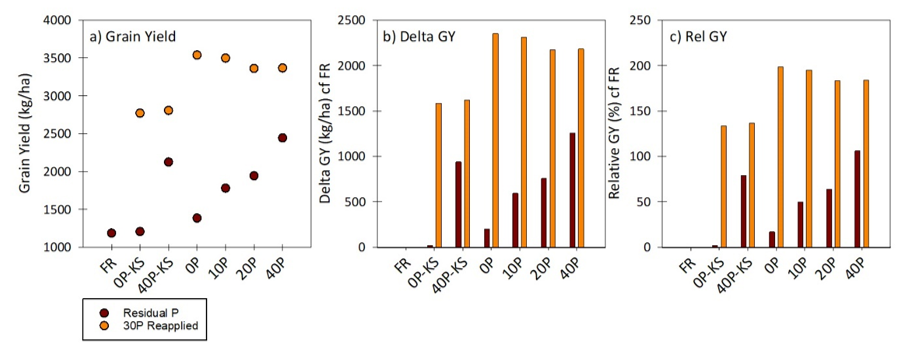
In a very limited set of sites (two sites, one useful) there was even more upside chickpea yield with reapplied P increasing yields further. At the Dysart site (Figure 4) there were similar yields recorded for the FR treatment and the re-ripped 0P treatments with or without extra K and S applications, ranging from 1200-1400 kg/ha. The lack of response to ripping and basal nutrients (N, or N and K) suggest that another factor (P) was the primary nutrient limit to productivity.
There were significant yield increases of 750-1250 kg/ha with the residual deep bands applied at 20 kg P and 40 kg P/ha with background KS, respectively – despite the original application being made back in 2013, and after five crop seasons. If no K had been applied in the original deep bands with the 40 P treatment, yields were reduced by 300 kg/ha – a small but statistically significant drop that suggests availability of K was a secondary limitation to yields at this site, evident only when P availability had been improved first.
The re-application of 30 kg P/ha (as ammonium phosphate plus zinc) prior to the 2019 season saw a further increase in potential yields to 2700-2800 kg/ha without background K, and to 3400-3500 kg/ha when K was also re-applied (Figure 4a). These responses support the primacy of the P limitation but also indicate a growing importance of K limitations once adequate P was available to meet crop demand. The 300-350 kg/ha drop in yields without K seen in the residual P treatments had now increased to 700-800 kg/ha with the improved P availability arising from the fresh re-application (Figure 4b).
The strong P responses at this site were consistent with results from the previous five crops grown on the site (2014, 2015 and 2016 sorghum, 2017 chickpeas and 2018 sorghum), but the magnitude of the response to the re-application was a little surprising given the strong residual effects that were still evident from the original applications – especially the 40P treatment. We have observed that the response to increasing original P rates has changed with time after application. In the first three sorghum crops there was no difference in yields between the 20 and 40 kg P/ha applications, but in subsequent crop years a better relative response was increasingly evident with 40P rather than 20P and yields effectively increased in a linear response to increased P rate. While this linear response is still evident in this 6th crop season, it is clear that crops could respond to more P than was available from the residual bands and that further P from a re-application was needed. The relative increase in yield response in relation to the residual bands raises the question of whether an earlier re-application could have been economically beneficial, and this can only be answered by future research. However, the cost to re-apply 30 kg/ha of P, along with the 50 kg/ha K and 90 kg/ha N in the background fertiliser, was roughly $260/ha. It is very clear that the re-application has paid for itself and delivered a profit in the year of application (assuming $650/t on-farm price).
Southern Queensland
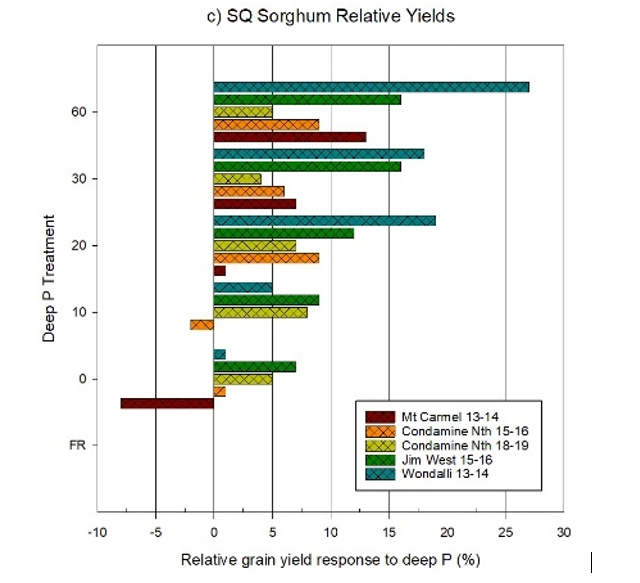
Winter cereals through southern Queensland have generally reliably increased grain yields in a range of seasons by about 15% at the 30 kg P/ha treatment (Figure 5a) – although there are exceptions in drought affected years.
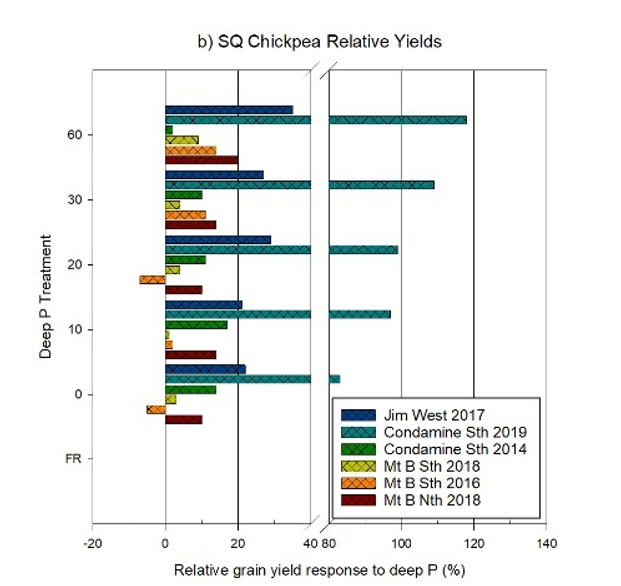
Responses with chickpea are mixed with a large scale of effects (Figure 5b). There are usually always significant dry matter increases measured (data not shown) but they do not always translate into increased grain yields. The yield effects appear perhaps muted when the 0P treatment (tillage and basal nutrient) is having about 10% increase without any additional P. Chickpeas did give the largest relative yield increase with nearly 120% increase at Condamine in 2014 (first crop at site). Excluding the huge response, grain yield increased by 13% at 30 kg deep P/ha compared to untreated control.
Sorghum has contrasting yield responses, with rainfall post-flowering likely the major driver of yield (Figure 5c). Two of the five harvested crops have delivered responses >15% in yield, but the remaining three are 4-7%. There is one notable negative effect at the Mt Carmel site in the 0P treatment, possibly due to tillage effects on crop establishment.
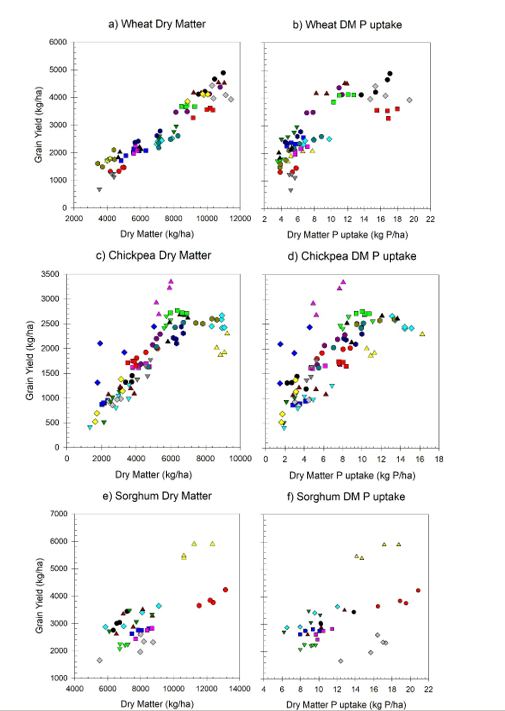
We have confidence in the responses from examining the underlying agronomic drivers measured: dry matter, grain yield and P uptake in each of those studies. Relationships between dry matter (DM) and grain yield (GY) have reasonable correlations (Figure 6 a-c). Subsurface P can increase soil supply of plant available P. That can increase dry matter produced which influences both the P uptake by the plant and concurrently can also influence grain yield. The next question is how to ‘best’ increase plant P supply?
Responses to deep K bands
Review of the potassium data from experiments is still in a preliminary phase as phosphorus has been a more widespread nutrient across the program. A case study site is presented showing some potential responses, but further investigation of the data will be forthcoming as final reports are prepared.
Central Queensland
Full details are contained in Sands et al. (2021b). Briefly, the Dululu trial site had four crops planted and harvested since it was first treated with deep banded fertiliser in November of 2015: Wheat in 2016, Chickpeas in 2017, Mungbean in 2017/18 and Chickpea in 2019. The original soil test from the site indicated adequate levels of P and K in the top 10 cm but a significant change in that analysis in the deeper layers (Table 4).
Table 4. Soil analysis for the Dululu site
Depth (cm) | Nitrate nitrogen | Phosphorus Colwell | Sulphur (KCl-40) | Exchangeable. Potassium | BSES Phosphorus | PBI | ECEC |
|---|---|---|---|---|---|---|---|
(mg/Kg) | (mg/Kg) | (mg/Kg) | (meq/100g) | (mg/Kg) | (meq/100g) | ||
0-10 | 7 | 17 | 4 | 0.23 | 21 | 99 | 22 |
10-30 | 22 | 3 | 7 | 0.12 | 5 | 109 | 28 |
30-60 | 18 | 1 | 18 | 0.09 | 4 | 81 | 29 |
Deep K responses at this site were more consistent than for P. Wheat was the only crop out of four that did not respond to the highest rate of K application when background P was applied. Only mungbean responded to the highest rate of K when no background P was applied. It is unclear whether this is a particular characteristic of mungbean, or due to seasonal variation. Accumulated grain yield responses to K were greater than those in the P trial (data not shown). The highest rate of K (100K) provided ~800 kg/ha more than the 0K treatment, while the highest rate of P (40P) in the P trial provided a ~600 kg/ha gain. While the reapplication of 50 kg K/ha to the 25K treatment produced the same accumulated production as the 100K treatment, the 50K treatment was almost 500 kg/ha behind both these treatments. It appears that the K at this site was used at a faster rate than the P, and reapplication will be needed sooner than normally expected for P responsive sites.
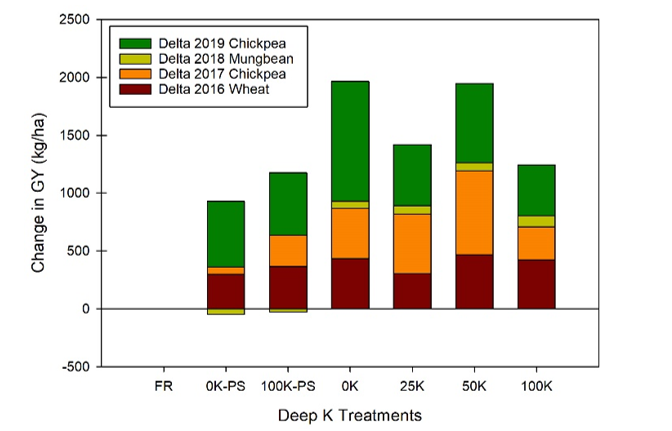
This trial site shows the need for subtle differences in management when soils are more restricted by K than P, and perhaps when higher topsoil P accentuates the differences in P supply between wetter and drier seasons. Plant uptake of K (36 kg K/ha) was much higher than P (7 kg P/ha) when the K and P were re-applied for the 2019 season. This five-fold difference presents a challenge of how much K should be applied and how long it will last. In the K trial in 2019, the re-applied treatment used up 15 kg of K more per hectare then the 100K residual treatment. This means that of the 50 kg K/ha that was re-applied in 2019, almost a third of it has been taken up by the 2019 chickpea crop.
Increasing plant nutrient uptake from fertilisers, including P and K
Acquisition of immobile nutrients applied into the subsurface by plant roots is an exercise in probability – fertiliser needs to be placed such that the roots are more likely to find those nutrients early enough in the plant life cycle to make a difference in growth, and that placement zone has to be wet enough for long enough for roots to be active and acquire enough nutrient to make a difference.
During two projects we have attempted to explore the placement effects of P and K fertiliser applications on crop uptake and yield responses through some field experiments. Early research in DAQ00148 compared applying into the surface, or subsurface or both on three band spacings (Figure 7), but this was all at one constant application rate of 40 kg P/ha as MAP. Research in UQ00078 evolved to explore the diffusion gradients created by a range of P rates (0, 10, 20, 40 or 80 kg P/ha) or K rates (0, 25, 50 or 100 kg K/ha) at each of the three band spacings at depth.

The research outcome suggests that while band spacings are important (narrower is better – 25cm & 50cm give better nutrient access than 100 cm), it is the rate of application that has the greatest impact on crop recovery.
Above ground dry matter at maturity was increased with increasing P rate in 3 of 6 seasons across the two sites (data not shown). Briefly, responses were approximately 10% greater than the 0P treatment, with the effect not really detectable until application rates were > 20 kg P/ha. In several years, distinct visual growth responses were observed in the stages up to flowering (photos not shown). Full details are reported in Lester, Weir et al. (2018b) and Lester and Bell (2020).
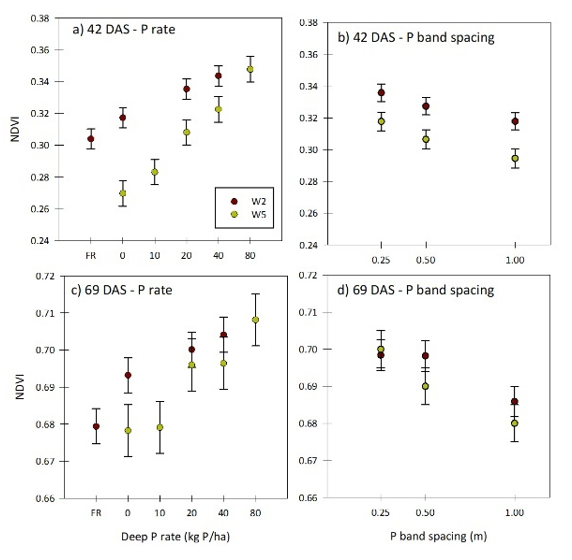
Crops grown in 2017 (chickpea) and 2018-19 (sorghum in two fields) allowed drone platforms to capture NDVI for assessment of relative influence that application rate and band spacing had. In general, the rate of P applied appeared to be a more dominant contributor to NDVI than band spacing (Figure 8). These effects are very difficult to precisely capture through dry matter cuts. Challenges also exist in homogenising whole plant samples for analysis to calculate nutrient uptake.
In northern region cropping soils, granular ammonium phosphates should be the first product choice for application in a subsurface program. Field experiments in UQ00078 at two sites in Qld over several growing seasons compared no P application with applying rates of ammonium phosphates as granular and fluid forms (MAP, DAP, FlowPhos) or calcium phosphates (TSP) without any clear cut result (Lester et al. 2018b), due to the inherent variability in field sites and challenging seasonal conditions where a lack of water/heat stress limit potential yields.
Research conducted through laboratory and glasshouse experiments at University of Queensland (Meyer et al., 2020) examined P products and the interaction with coapplied K on fertiliser bands in a variety of soils. Findings suggest for non-calcareous soils, the pH of the soil and the pH of the P product as it dissolved influenced soil P availability. In general, ammonium phosphate fertilisers are the preferred delivery mechanism for band applications, but there was little evidence of any advantage of MAP over DAP, with similar findings reported in Raymond et al. (these proceedings) for dispersed P.
We have regularly seen increased crop growth on sites comparing the untreated control to the 0 kg P/ha plots, particularly in the initial crop seasons after application. This suggests that tillage associated with subsurface nutrient placement is providing some benefit, although these trials were not designed to separate tillage effects from the added background nutrients that were added at the time. The soil disturbance needs to be disruptive enough to break up legacy compaction, and early enough to allow reconsolidation of soil to allow successful establishment of the next crop.
Economic ROI from deep P and/or K
Deep P and K are long term decisions, with significant upfront costs (Table 4) and returns expected to be recouped over 5 years or more. Analysis of the 8 longest running trial sites spread across southern and central Queensland, where P was applied as MAP, show promising returns from deep P application, with cumulative yield benefits ranging from 1% to 42% at 20kg P/ha (Table 5).
Table 5. Treatment cost by P rate with basal N
Treatment | Application ($/ha) | Urea ($/ha) | MAP ($/ha) | P treatment cost ($/ha) |
|---|---|---|---|---|
0 | $30 | $69 | $0.00 | $99 |
10 | $30 | $61 | $73 | $164 |
20 | $30 | $57 | $109 | $196 |
40 | $30 | $52 | $145 | $227 |
60 | $30 | $43 | $218 | $291 |
Note: Using long term average MAP ($800/t) and Urea ($450/t) prices
Table 6. Cumulative yield benefit vs farmer reference
Central Queensland | Southern Queensland | |||||||
|---|---|---|---|---|---|---|---|---|
P rate (kg/ha) | Comet River (4) | Emerald (5) | Dysart (6) | Dululu (4) | Mt Bindago (4) | Warra (4) | Condamine South (5) | Jimbour West (6) |
0 | 21% | 7% | 13% | 12% | 1% | -8% | 6% | 9% |
20 | 36% | 5% | 42% | 19% | 10% | 1% | 14% | 18% |
30 | 13% | 0% | 16% | 19% | ||||
40 | 39% | 7% | 41% | 19% | ||||
60 | 14% | 4% | 19% | 24% | ||||
Colwell-P | 6 | 6 | 1 | 3 | 3 | 3 | 4 | 8 |
Note: numbers in brackets following site names are the number of crops that have been harvested at these sites. It is expected that the benefits of higher rates of P will become more pronounced the longer each site is cropped.
Using 5-year average prices these yield benefits have largely transferred through to significantly improved profitability, with 20kg/ha P generating up to $1586/ha in additional gross margin above farmer reference treatments (Table 6). Return on Investment (ROI), averages 2.7 across the 8 sites, meaning for every $1 spent on deep-P, profit has increased by $2.70.
Table 7. Cumulative gross margin benefit and ROI of 20P vs FR ($/ha) (ROI expressed as $ return/$ invested)
Central Queensland | Southern Queensland | |||||||
|---|---|---|---|---|---|---|---|---|
Comet River (4) | Emerald (5) | Dysart (6) | Dululu (4) | Mt Bindago (4) | Warra (4) | Condamine South (5) | Jimbour West (6) | |
Gross Margin Benefit | $770 | $27 | $1586 | $767 | $60 | -$94 | $392 | $673 |
Return on Investment | 3.9 | 0.1 | 8.1 | 3.9 | 0.3 | -0.5 | 2.0 | 3.4 |
Sites which have not been responsive highlight some of the uncertainty still surrounding the practice of deep P and K. For example, the Warra site suffered a significant yield penalty due to deep placement in the year 1 sorghum crop (presumably due to lingering tillage effects on soil moisture), which was not able to be overcome by deep P addition due to a strong K deficiency that was observed across the site. This occurred despite soil tests suggesting K was marginal-adequate at the site. Following a background K application all subsequent (grain) crops showed positive responses to deep-P, but these benefits were not enough to offset the treatment costs and the first year yield penalty in the high value chickpea crop to break even.
Where Colwell P concentrations in subsoils are low (<10mg/kg), deep-P appears to offer strong economic returns in many situations, although there were several sites where other constraints, particularly N and K deficiencies, have limited P responses across the trial program. This means growers need to take into account all-nutrient requirements of crops, as well as the constraint status of their soils, and apply nutrition in line with the improved ‘non-P-limited’ yield potentials.
Deep P and K banding - the ‘bad’
There are a number of not so positive results from this program.
- There is a ‘Goldilocks’ soil moisture for putting treatments in. Too dry and you break your gear trying to work hard ground and you can’t get your bands deep enough. Too wet and you don’t get the disturbance needed to break up the upper 20-25cm profile
- Doing deep placement without sufficient rainfall for reconsolidation doesn’t allow successful crop establishment and/or good access to the deep bands. There needs to be good soil-band contact in moist soil for roots to access these nutrients, and fertiliser sitting in air gaps/voids created by tillage will not result in nutrient uptake. The solution is timing deep banding earlier in the fallow once there has been enough rainfall to soften the profile in the tilled zone. The longer the period post-ripping, the more rainfall events (hopefully) and the better the profile reconsolidation
- Growing season conditions will influence the crop response to subsurface applied nutrients – especially when the topsoil layers are quite fertile. The length of time the crop root system has access to different soil layers (i.e. the top 10cm v the subsoil), how enriched each layer is for the nutrient in question and how often each layer rewets during a growing season, will all influence the response to deep banded nutrients. This uncertainty is overcome to some extent by the good residual value obtained from these deep bands, especially for deep P, so a lack of response in a good season can see responses deferred to subsequent growing seasons
- Meaningful data from northern New South Wales is sparse, due to a combination of extended very adverse drought conditions and logistical challenges associated with operating over a large geographic area from a single research base
- Translation from research experiments to grower practice is mixed. There are reports deep P bands are not always working for every grower who does it. A more thorough investigation of these situations (soil characteristics, application method, timing, and rate, seasonal conditions etc) is needed to determine whether these effects are related to soil types or other factors.
Deep P and K - the ‘ugly’
There are still a number of unknowns relating to deep P banding.
- We can’t track uptake directly from fertiliser P bands over multiple crop sequences. The estimates of P uptake are based on the difference between P uptake from untreated and treated plots, with an assumption the change in P uptake is all that is being acquired from the fertiliser band. There may well be greater P uptake from the deep P bands and some sparing of background P from the rest of the soil profile; but we don’t know if this occurring, and if so, how big these effects may be
- It has been challenging to get good estimates of differences in nutrient uptake by crops using the differences between banded treatments. This is due to variability in measurement of the above ground dry matter from a small sample area, and the homogenising of bulky plant samples containing both vegetative material and immature grains into a representative plant sample of < 1 g for acid digestion. Grain yields and grain nutrient concentrations provide a more robust estimate of P/K leaving the paddock, but this fraction varies with crop nutrient status and indeed the nutrient itself. A lack of grain nutrient removal may still mean a lot of the deep-banded nutrient has been taken up by the plant but returned to the relatively enriched topsoil, which is particularly the case for K
- Understanding of P behaviour across diverse cropping soils is limited. There are sites (e.g., Emerald Ag College) where crops are obtaining substantially more phosphorus than current soil tests suggest they should. We still don’t know where that P is coming from, which highlights that our understanding of P dynamics in vertosols still has a way to go
- The longevity of P from undisturbed fertiliser P bands (the ‘fertosphere’) in soils is variable, with work being conducted in UQ00063 by Chelsea Janke following up the banding studies reported by Meyer at al. (2020; 2021) over longer aging periods. Other lab work is being undertaken to assess behaviour of P dispersed through the soil (Raymond et al., 2021b), with this work linked to field studies in Qld and NNSW conducted in UQ00082. The laboratory studies show that for the same rate of P application, some soils allow a much greater proportion of applied P to enter the plant available soil P pools measured by Colwell P than others (Raymond et al., 2022). This is consistent with results from field sites at Gindie, Hopelands and Ningadoo, with the reasons for this still being assessed
- Our knowledge of interactions between soil moisture, root activity and P acquisition for different species is limited (van der Bom et al., 2020). These interactions have significant implications for plant growth and phenology; as well as for breeding programs selecting for specific root morphologies to improve deep water extraction
- The interaction between plant P uptake, growth and phenology responses, soil water extraction and transpiration are also an area of uncertainty. Are crops extracting more water because they have larger root systems, or respiring more efficiently because of better P status?
- Lastly, potassium is a major nutritional challenge emerging in the cropped vertosols and, given the relative immobility of K and the amounts taken up by crops, it is going to provide a significant long-term challenge to fertiliser management programs. There has been less research on K management in clay soils nationally and internationally, as K infertility has not traditionally been a problem due to adequate initial reserves. As those reserves are eroded, the imperative to better understand K dynamics in vertosols is increasing and research in this space is breaking new ground.
Concluding remarks
There is a strong likelihood of having to manage P and K simultaneously in many broad acre cropping sites across the NGR in coming years, to optimise the efficient use of available water. This is already a reality in significant areas of CQ (especially on open downs soils) and we are approaching these conditions in the northwest slopes of NSW and on some box/upland soils in southern Queensland.
Grain yield increases in response to fertiliser K applications in vertosols have been limited to sites in CQ and the inland Burnett, where subsoil K reserves are very low. We have also run trials on soils with marginal K status in southern Qld that have been able to provide insights into crop K acquisition from fertilisers, but at this stage yield responses have been small and inconsistent. This situation will change as the crop removal continues, and so we need to continue to develop both short- and long-term responses to K decline.
Most of the research reported here has involved a single application of deep P/K bands into low P subsoils. Data suggests that while responses are profitable in most situations, these single bands are not completely overcoming the problem of P/K infertility. The strong residual value of banded P in particular, combined with periodic reapplications enriching ‘new’ soil on each occasion, are a way to slowly rebuild soil fertility banks.
An important consideration is how often these re-applications are needed, with our data suggesting there will be a need to reapply subsurface K much sooner than subsurface P. Crop K uptakes are typically ten times greater than P, so the residual amount of deep K after consecutive cereal/sorghum crops will rapidly decline. Most of this K won’t be leaving field in grain, but it won’t be where you put it in the subsoil as it will instead be released from stubbles into the topsoil. How long deep K applications last, and how you manage subsoil P and K will be important, as deep K bands alone are not effectively utilised by plants - an ‘entrée’ of P with the K is needed to give roots a reason to proliferate around the bands. Identifying appropriate P/K blends for different situations and application frequencies will occupy nutrition researchers for some time to come.
Acknowledgements
The research undertaken as part of these and preceding projects has been made possible by the significant contributions of growers through both trial cooperation and the support of the GRDC, and the authors would like to thank them for their continued support.
References
Barber SA (1995) 'Soil nutrient bioavailability: A mechanistic approach.' (John Wiley & Sons: New York)
Bell MJ (2012) DAQ00148: Defining critical soil nutrient concentrations in soils supporting grains and cotton in Northern NSW and Queensland - Grains Research and Development Corporation Available at https://grdc.com.au/research/reports/report?id=3667 .
Bell MJ and Lester DW (2012) Multiple nutrient deficiencies in northern grains cropping – latest results and management responses for system profitability. In 'Grains Research Updates. Goondiwindi', March 2012. (GRDC)
Bell MJ, Lester DW and Sands D (2019) Nutritional strategies to support productive farming systems. In 'GRDC Grains Research Update (Dalby). Dalby Qld', 2 August 2019.
Guppy CN, Bell MJ and Moody PW (2012) Interpreting soil tests in the light of P, K and S research. In 'GRDC Adviser Update - 2012. Goondiwindi'. (Grains Research and Development Corporation) Available at http://www.grdc.com.au/Research-and-Development/GRDC-Update-Papers/2012/04/Interpreting-soil-tests-in-the-light-of-P-K-and-S-research
Lester DW and Bell MJ (2020) Phosphorus: Rate was more important than band spacing for uptake by summer crops in 2018-19. In 'Queensland Grains Research 2019-20 Regional agronomy (research).' (Eds DN Lawrence, T Grundy.) pp. 61-64. (Department of Agriculture and Fisheries (DAF), Brisbane, Qld)
Lester DW, Bell MJ, Weir DJ, Lush D (2018a) Deep-placing phosphorus in NE Australian grain soils: 2. Influence of P rate x band spacing (and form) on crop yield. In '6th Symposium on Phosphorus in Soils and Plants. "From Molecular to EcoSystems". Leuven, Belgium', 10-13 September 2018. pp. 251. (Katholieke Universiteit Leuven (KUL). Available at https://kuleuvencongres.be/PSP6/articles/documents/psp6-abstracts.pdf
Lester DW, Weir D, Lush D and Bell MJ (2018b) How can you get more deep-placed phosphorus into crops to boost grain yield? In 'Queensland Grains Research - 2017-18 Regional Agronomy.' (Eds J Gentry, T Grundy.) Vol. 2017-18 pp. 94-99. (Department of Agriculture and Fisheries (DAF): Brisbane, Qld)
McLaren TI, Guppy CN, Tighe MK, Moody P and Bell M (2014) Dilute Acid Extraction is a useful Indicator of the Supply of Slowly Available Phosphorus in Vertisols. Soil Science Society of America Journal 78, 139-146.
Meyer G, Bell MJ, Doolette CL, Brunetti G, Zhang Y, Lombi E and Kopittke PM (2020) Plant-Available Phosphorus in Highly Concentrated Fertilizer Bands: Effects of Soil Type, Phosphorus Form, and Coapplied Potassium. Journal of Agricultural and Food Chemistry
Meyer G, Bell MJ, Lombi E, Doolette CL, Brunetti G, Novotny EH, Klysubun W, Zhang Y and Kopittke PM (2021) Phosphorus speciation in the fertosphere of highly concentrated fertilizer bands. Geoderma 403,
Raymond N, Kopittke PM, Wang E, Lester D and Bell MJ (2021a) Does the APSIM model capture soil phosphorus dynamics? A case study with Vertisols. Field Crops Research 273, 108302.
Raymond N, Lester DW and Bell MJ (2021b) Boosting deep-phosphorus availability in vertosols. GRDC Groundcover supplement - Nutrient management for enduring profitability. GRDC, North.
Raymond NS, Kopittke PM, Van der Bom F, Lester D, Wang E and Bell MJ (2022) Phosphorus dynamics in Vertosols: improving fertilizer management. In '20th Australian Agronomy Conference - Agronomy System Solutions for Complex Problems. Toowoomba Qld', September 2022.
Sands D, Bell MJ, and Lester DW (2021a) What have we learnt from the deep banding of phosphorus in Central Queensland? In 'GRDC Grower Update 2021. Theodore Qld'.
Sands D, Lester DW Hagan JM, and Bell MJ (2021b) Re-applying deep phosphorus and potassium after three years further boosted chickpea yields—Dululu. In 'Queensland Grains Research 2020-21 Regional agronomy (research).' (Eds DN Lawrence, T Grundy.) pp. 26-32. (Department of Agriculture and Fisheries (DAF), Brisbane, Qld)
van der Bom FJT, Williams A and Bell MJ (2020) Root architecture for improved resource capture: trade-offs in complex environments. Journal of Experimental Botany 71, 5752-5763.
Van der Bom FJT, Williams A, Raymond N and Bell M (2022) Root research: What do wheat and sorghum roots do when water is in one part of the profile and phosphorus is in another? Root angle and why does it matter? In 'GRDC Grains Research Update (Goondiwindi)', March 2022.
Wang X, Lester DW, Guppy CN, Lockwood and PV, Tang C (2007) Changes in phosphorus fractions at various soil depths following long-term P fertiliser application on a Black Vertosol from south-eastern Queensland. Australian Journal of Soil Research 45, 524-532.
Contact details
David Lester
Queensland Department of Agriculture and Fisheries
13 Holberton Street, Toowoomba Qld 4350
Ph: 0428 100 538
Email: david.lester@daf.qld.gov.au
Doug Sands
Queensland Department of Agriculture and Fisheries
99 Hospital Road, Emerald
Ph: 0749 910 811
Email: douglas.sands@daf.qld.gov.au
Mike Bell
University of Queensland, Gatton Campus
Ph: 0429 600 730
Email: m.bell4@uq.edu.au
GRDC Project Code: DAQ00148, UQ1302, UOQ1207-001RTX, UOQ1505-001RTX, UOQ1606-002RTX, UOQ1706-006RTX, UOQ1805-007SAX, UOQ1905-009RTX, UOQ1805-005RTX, UOQ1805-007SAX, UOQ1606-002RTX, UOQ1606-002RTX, UOQ1505-001RTX, UOQ1706-006RTX, UOQ1706-006RTX,
Was this page helpful?
YOUR FEEDBACK

