What have we learnt from the deep banding of phosphorus in Central Queensland?
Author: Douglas Sands (Queensland Department of Agriculture and Fisheries), Professor Michael Bell (University of Queensland, School of Agriculture and Food Sciences) & Dr. David Lester (Department of Agriculture and Fisheries) | Date: 18 Oct 2021
Take home message
- Data extracted from 14 crops grown across 5 sites over several years shows deep P providing significant yield response in 80% of crops
- Yield responses varied from 10% to 40% across species with some chickpea crops doubling and tripling their yield in response to deep applied P in moisture limited situations
- Several factors influence the size of yield response to deep banded P from season to season.
Introduction
Phosphorus is a critical element in plant growth with many key metabolic functions such as photosynthesis and cell division requiring a small but consistent supply of phosphorus throughout the life of the crop (Raven & Johnson, 1989). The supply of phosphorus through soil solution and plant roots can be a complex one given that P is not mobile in clay soils (Glendinning, 1990) and this has long term ramifications to our cropping system.
In the sub-tropics of Queensland many broadacre crops are grown on stored moisture as most of the annual rainfall falls between January and March. Limited in crop rainfall means most of the grain crops grown in this area are flowering and filling grain on sub-surface moisture (10 cm – 40 cm) and this means that most nutrients are also being taken from this zone. In a zero-tillage system, stubble is breaking down and returning some of the nutrients to the surface of the soil, however nutrients such as P and K will not leach through a vertosol soil (Bordoli and Mallarino, 1998) and so become stranded in the top 5 cm of the soil profile.
This stratification of nutrients has shown up regularly in soil tests across cropping soils in Central Queensland (CQ) and has been one of the main reasons that a series of experiments have been undertaken across CQ to investigate if this stratification is an impediment to grain production and whether replacing some of the P back into the middle of this sub-surface profile with granular fertiliser will enhance grain production and how long will one application last.
Experimental outline
Initially up to ten different sites were established across CQ based on soil testing data that showed limited available (Colwell) P in either the surface layer (0 -10 cm) or the sub-surface layer (10 cm – 30 cm) or a combination of both. All experiments included some form of deep placement treatments although not necessarily structured the same way. This paper will examine a consistent set of five trial sites where the experiments were conducted with the same set of treatments.
These five sites will be referred to in this paper based on the closest local township name or the name of the district the property is located in. These sites are listed below along with the year that the deep P treatments were established.
- Dysart – established August 2013
- Clermont – established October 2015
- Dululu – established November 2015
- Kilcummin – established March 2015
- Comet River – established December 2015
The experiments were set up with a two-metre wide Yeomans™ ripper bar set up on 50 cm row spacings. This ripper bar was modified to apply up to four individual granular fertilisers down the same trench but at different depths. In the P trials, the rate of P was varied depending on the treatment, but background fertiliser was also added at the same time. This background fertiliser included nitrogen (N), potassium (K), sulfur (S) and zinc (Zn). Common off the shelf granular fertilisers were used to supply these nutrients (Table 2). The non-mobile nutrients P and K were placed at a depth of 20 cm – 25 cm in one boot, while the N and S were applied at 10 cm – 15 cm through a separate boot. The Zn was applied via a liquid injection outlet positioned 5 cm above the N and S band.
Seven treatments were common across all sites. The rates of nutrient applied in these treatments are summarised in Table 1. The treatment labels in Table 1 will be used throughout the results section to present the data. The ‘FR’ label represents farmer reference, which is essentially a control benchmark for each site. ‘FR’ plots had no deep fertiliser applied and were not ripped so that they represent the original paddock performance. These plots only received what was applied by the farmer co-operator at the time of planting.
Table 1. Rates of nutrient applied across the seven common treatments used in each trial site.
Treatment label | N rate (kg/ha) | P rate (kg/ha) | K rate (kg/ha) | S rate (kg/ha) | Zn rate (kg/ha) |
|---|---|---|---|---|---|
0P | 80 | 0 | 50 | 20 | 0.5 |
10P | 80 | 10 | 50 | 20 | 0.5 |
20P | 80 | 20 | 50 | 20 | 0.5 |
40P | 80 | 40 | 50 | 20 | 0.5 |
0P-KS | 80 | 0 | 0 | 0 | 0.5 |
40P-KS | 80 | 40 | 0 | 0 | 0.5 |
FR | 0 | 0 | 0 | 0 | 0 |
Table 2. Nutrient analysis of common granular fertiliser products that were used to achieve the applied nutrient rates summarised in Table 1.
Fertiliser type | N | P | K | S | Zn |
|---|---|---|---|---|---|
Urea | 46% | ||||
Mono ammonium phosphate | 10% | 22% | |||
Muriate of potash | 50% | ||||
Gran-am | 20% | 24% | |||
Agrichem supa zinc (w/v) | 7.50% |
The seven treatments highlighted in Table 1 were replicated across all five sites with between four and six r replicates of each treatment per site. This paper is focussed on the response to deep P only, so only the data relating to the four rates of P (0, 10, 20, 40 kg P/ha) and the FR treatments will be presented in this paper. The P bands were only applied once at trial establishment, effects were monitored over a variable number of subsequent crops to assess residual benefits at each site. The number of crops grown at each site is summarised in the table below (Table 3).
Plot sizes varied depending on the farming system that existed at each site. Treated plots were fitted in between the controlled traffic laneways that existed in the paddock so that compaction issues would not confound the treatment responses. Depending on the width of planting equipment, plot sizes varied between 4 m wide by 28 m long to 8 m wide by 32 m long. Once treatments were applied, the grower co-operator would then plant over the top of the treated area along with the rest of the paddock when soil profiles were full enough to create a planting opportunity. Choice of crop and rotation sequence were determined by the grower co-operators.
Table 3. Crops gown on each trial site by year
Trial site name | Year by crop | ||||
|---|---|---|---|---|---|
2014 | 2015 | 2016 | 2017 | 2018 | |
Dysart | sorghum | sorghum | sorghum | chickpea | sorghum |
Kilcummin | chickpea | ||||
Clermont | sorghum | chickpea | |||
Dululu | wheat | chickpea | mungbean | ||
Comet River | chickpea | wheat | chickpea | ||
Grain yields were obtained by using a two metre (m) wide plot header to harvest each individual plot and grain samples were kept for analysis. Full destructive dry matter cuts were done on selected treatments on all crops at physiological maturity and samples were sent for chemical analysis.
Results
The mean grain yield data from 14 crop years shows several different levels of response to the different rates of deep P applied (Table 4 a,b). Despite the variability in the data, the response to deep P was significant (P<0.05) in 11 out of the 14 cropping years shown in the tables, which equates to a response rate of ~80%.
The differences in mean grain yields between the 0 and 40 rates of P can be as little as 17 kg/ha or as much as 975 kg/ha. This variability can be attributed to changing seasonal factors mostly related to soil water and in-crop rainfall, however the distribution of P in the soil profile can interact with these seasonal factors to influence the size of the yield response to deep P.
Table 4 (a). Mean grain yields measured across increasing rates of deep placed P bands in trials situated at Dululu, Clermont and Kilcummin.
Deep P rate (kg/ha) | Dululu trial site | Clermont trial site | Kilcummin trial site | |||||
|---|---|---|---|---|---|---|---|---|
2016 wheat | 2017 chickpeas | 2018 mungbeans | 2016 sorghum | 2018 chickpeas | 2015 chickpeas | |||
Grain yield (kg/ha) | Grain yield (kg/ha) | Grain yield (kg/ha) | Grain yield (kg/ha) | Grain yield (kg/ha) | Grain yield (kg/ha) | |||
Control | 3858 | 2686d | 721 | 1628a | 330a | 1833a | ||
0 | 4092 | 2922c | 868 | 1942b | 321a | 1841a | ||
10 | 4095 | 3096b | 839 | 2371c | 790b | 2243b | ||
20 | 4126 | 3221ab | 844 | 2317c | 976c | 2345bc | ||
40 | 4109 | 3348a | 858 | 2701d | 1296e | 2394c | ||
LSD0.05 | n.s | 144 | n.s | 146 | 104 | 97 | ||
Table 4 (b). Mean grain yields measured across increasing rates of deep placed P bands in trials situated at Dysart and Comet River.
Deep P rate (kg/ha) | Dysart trial site | Comet River trial site | |||||||
|---|---|---|---|---|---|---|---|---|---|
2014 sorghum | 2015 sorghum | 2016 sorghum | 2017 chickpea | 2018 sorghum | 2016 chickpea | 2017 wheat | 2018 chickpea | ||
Grain yield (kg/ha) | Grain yield (kg/ha) | Grain yield (kg/ha) | Grain yield (kg/ha) | Grain yield (kg/ha) | Grain yield (kg/ha) | Grain yield (kg/ha) | Grain yield (kg/ha) | ||
Control | 2285a | 2657a | 1855a | 538ab | 2349a | 1623c | 678 | 1376d | |
0 | 2739b | 2985bc | 2196b | 709b | 2817b | 2030b | 1117 | 1445cd | |
10 | 3175c | 3221de | 2353bc | 959c | 3349c | 2041b | 1144 | 1706ab | |
20 | 3310cd | 3395e | 2525c | 1172cd | 3548cd | 2425a | 1237 | 1647abc | |
40 | 3452d | 3258de | 2291bc | 1415d | 3788d | 2522a | 1241 | 1771a | |
LSD0.05 | 224 | 198 | 251 | 231 | 342 | 244 | n.s | 230 | |
The distribution of P in the top 60 cm of the profile of all five trials sites is shown in Table 5, with two distinct profiles in the trial sites examined. The Dululu and Comet River sites show P concentrations in the top 10 cm that are widely regarded as non-limiting, but there is a distinct drop off in the concentration of P in deeper layers. This is a typical example of nutrient stratification for a non-mobile element such as P and is the result of depleted subsoils combined with a topsoil layer enriched by fertilisers and crop residues.
This characteristic has implications for the response of deep applied P in any given season. In situations where in-crop rainfall was well distributed, the plant can access the P held in the surface soil (0 - 10 cm). However, when this surface profile dried out, the P held in this zone would become unavailable to plant roots. The length of time that the plant has access to the surface soil (0 – 10 cm), or alternatively was restricted to the less fertile subsoil layers, largely govern the size of the response to deep applied P.
Table 5. Original Colwell P concentrations in mg/kg for each soil layer at each trial site. Figures of < 2 indicate that the P levels were too low for the laboratory to measure accurately.
Colwell P (mg/kg) | Site name | ||||
|---|---|---|---|---|---|
Dysart | Dululu | Clermont | Comet River | Kilcummin | |
Depth (cm) | |||||
0-10 | 5 | 22 | 8 | 22 | 6 |
10-30 | <2 | 2 | 3 | 6 | <2 |
30-60 | <2 | <2 | <2 | 3 | <2 |
The other three trial sites had limited availability of P in both the surface and the sub-surface profile layers. In these sites, in-crop rainfall was less influential on the response to deep applied P. Evidence of this can be provided by converting the mean grain yield data (Table 4 (a) and (b)) into a relative yield response (%) to deep applied P using the zero rate of P as the basis.
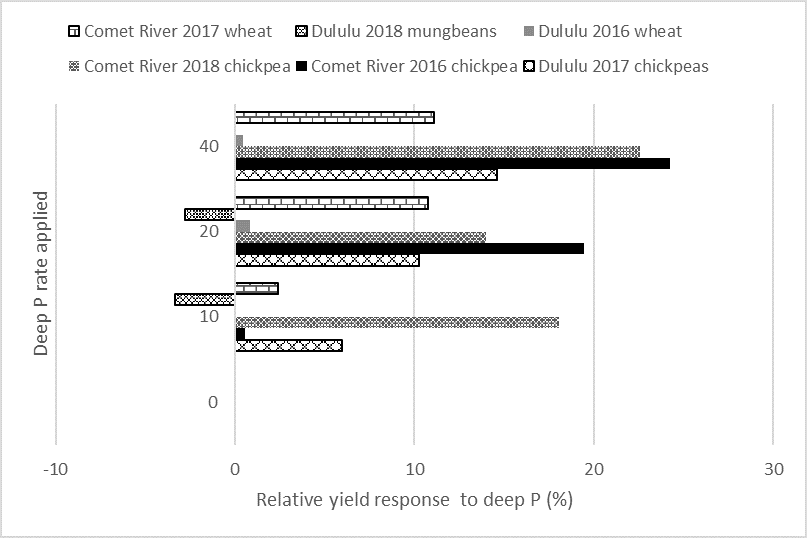
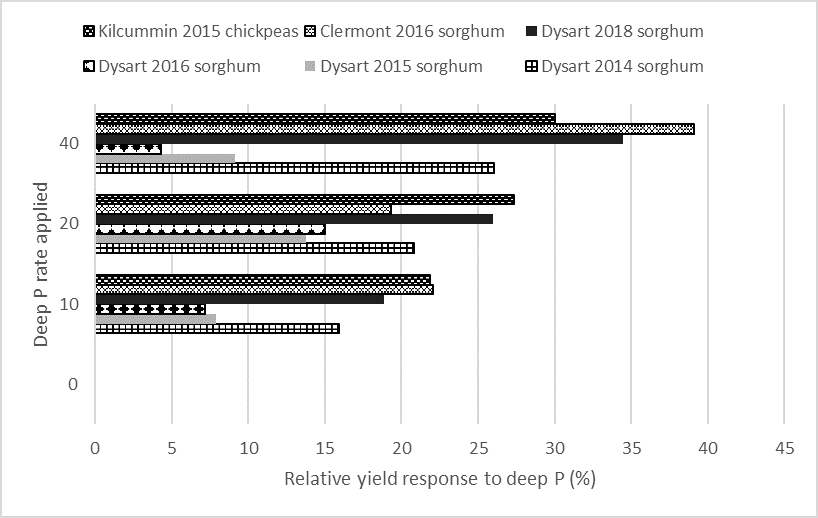
The relative yield responses in those sites with relatively high surface P (Figure 1) generally showed a maximum response of ~25% with a significant amount of variability across the crop years. More than half the yield responses to the 20 kg P/ha and 40 kg P/ha rates represented yield increases of 10% or lower (Figure 1). This contrasts with the relative response to 20 kg P/ha and 40 kg P/ha rates in those sites that had much lower surface P concentrations (Figure 2), in which 75% of the responses produced yield increases of 15% or more. The maximum relative response was also higher, with close to a 40 % increase in grain yield (Figure 2).
 Figure 1. Mean relative grain yield responses to deep applied P treatments as a % of the zero P treatment for those sites that had relatively high Colwell P concentrations (22 mg/kg) in the top 10 cm of soil.
 Figure 2. Mean relative grain yield responses to deep applied P treatments as a % of the zero P treatment, for those sites that had low Colwell P concentrations (< 8 mg/kg) in the top 10 cm of soil.
It is apparent from these results that the distribution of P in the profile is going to affect the consistency of response to deep placed P, especially when in-crop rainfall is variable. On top of this, crop species can also have an impact on the size of the response to deep P and this could be because of rooting structure (tap root system versus adventitious root system) and linkages to nitrogen fertility (i.e., cereal versus legume).
In-crop rainfall across these crop seasons varied from 4mm to 322mm and it is difficult to get a clear trend between in-crop rainfall and yield response alone without more detailed analysis. Further analysis is also required to incorporate the impact of crop species into these yield responses which won’t be covered in this paper.
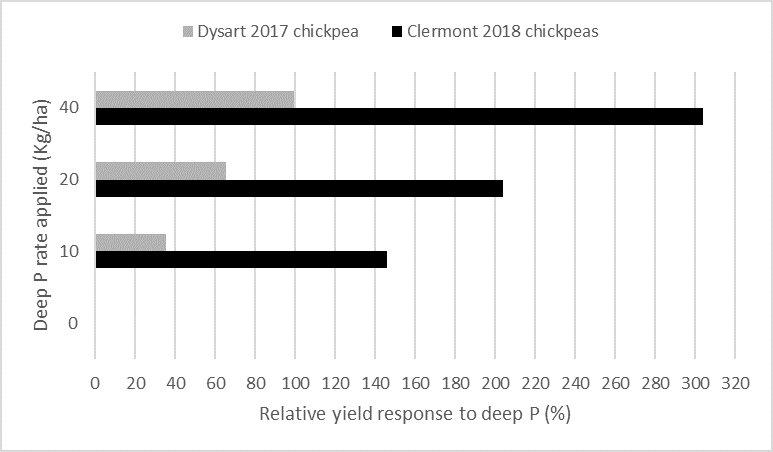
In relation to the previous point, it is worth noting situations where deep P has shown the largest yield response (not shown in Figures 1 or 2). On the extreme end of the relative response results were two chickpea crops that were grown on limited in-crop rainfall at the Dysart site in 2017 and at the Clermont site in 2018 (Figure 3). The relative yield responses to 40 kg P/ha applied were 100% (Dysart 2017) and 300 % (Clermont 2018), respectively.
These trials were grown on 95mm (60mm occurred four days after planting) and 51mm (43mm occurred ten days before harvest) of rainfall in the two growing seasons, with the zero P plots producing 709 kg/ha and 321 kg/ha grain yields at Dysart and Clermont, respectively. This meant the deep P application at the highest rate (40 kg P/ha) effectively double the yield at the Dysart site (1408 kg/ha) and quadrupled the yield at the Clermont site (1298 kg/ha). Further to this, the Dysart chickpea crop was the fourth crop to be grown on the site since the original application of deep P.
 Figure 3. Mean relative grain yield responses to deep applied P treatments as a % of the zero P treatment for two chickpea crops that were grown with limited in-crop rainfall. Both these crops were also grown on sites that had limited surface (< 8 mg/kg) and sub-surface (< 3 mg/kg) P concentrations.
The results for these two chickpea crops (Figure 3) shows what impact deep P can make when in-crop rainfall is limited, and surface P and sub-surface P concentrations are both low. The chickpea root system contributes to the size of this response, as this tap rooted crop would appear to have limited ability to efficiently extract P from soil with low P concentrations. There are also unlikely to be N limitations that limit the P response in this legume species, in contrast to what can occur with cereals in the same soils.

Summary
It is clear from the data presented that the placement of bands of P fertiliser at 20 cm to 25cm deep in the profile is going to increase grain yield in cracking vertosol soils with a low P status (< 8 mg/kg Colwell P) in the sub-surface layer (10 cm – 30 cm). There is also evidence to suggest that there is continued significant grain yield response to the application of deep P for up to five years after the deep banded treatments are applied. (Dysart site, 2018).
The difference in grain yields between 20 kg P/ha and 40 kg P/ha was negligible in most situations although there were indications that in later years the yields from these two treatments were starting to diverge in favour of the higher rate (Dysart site) or in very dry conditions (Clermont site).
It is also clear that there are several conditions that influence the size of that grain yield response to deep applied P. One of those is the concentration of Colwell P in the surface soil layer (0 – 10 cm). Sites with more stratified P contents and where surface soils have Colwell P approaching 20 mg P/kg or higher, typically have smaller grain yield responses (10 - 25 %). Sites with much lower surface P concentrations (i.e., <8mg P/kg) had grain yield responses ranging from 25 – 40 % and higher.
Further analysis of the trial data collected from these sites included P uptake in plant and grain tissue, and this data allowed us to explore the variability more clearly in P responses between seasons. Early indicators would suggest that there is no single factor that drives most of this variability with a combination of factors such as P distribution in the surface and sub-surface layers, timing and amount of in-crop rainfall and the root distribution of the crop species all contributing to the size of the P response.
These factors are consistent with two major concepts that determine plant P acquisition.Diffusion is the major pathway for P uptake into plant roots (Ahmed et al., 2016) and P is a non-mobile nutrient in clay soils (Glendinning, 1990). Diffusion from the soil to a plant root can only take place when there is plant available water present, and the root surface is close to the source of available P. The wetter the soil and the more roots that are present in the vicinity of a P band the greater the likely crop P uptake.
For zero till farming systems in the sub-tropics, these concepts represent major challenges to effective fertiliser application strategies for nutrients like P. These strategies need to account for the fact that crops are grown predominately on stored soil moisture and surface soils are often too dry to contribute to plant nutrient uptake.
References
Ahmed S, Klassen TN, Keyes S, Daly M, Jones DL, Mavrogordato M, Sinclair I, Roose T (2016) Imaging the interaction of roots and phosphate fertiliser granules using 4D X-ray tomography. Plant Soil 401, 125 – 134 (DOI 10.1007/s11104-015-2425-5)
Bordoli JM and Mallarino AP (1998) Deep and shallow banding of phosphorus and potassium as alternatives to broadcast fertilization for no-till corn. Agronomy Journal Vol 90, 27-33.
Glendinning JS (1990) AFL Fertilizer handbook. Australian Fertilizers Limited, North Sydney NSW.
Raven PH and Johnson GB (1989) Biology. Chapter 36 Nutrition and Transport in Plants, pp 729-732, Times Mirror/Mosby College Publishing, St Louis Missouri.
Acknowledgements
The research undertaken as part of this project is made possible by the significant contributions of growers through both trial cooperation and the support of the GRDC, the author would like to thank them for their continued support.
The authors would also like to acknowledge the contributions made by the technical officers who have worked tirelessly on these trial sites to ensure quality data has been extracted from these experiments. Those technical officers include Peter Agius and Max Quinlivan (former technical officer).
Contact details
Douglas Sands
Queensland Department of Agriculture and Fisheries
99 Hospital Road, Emerald. 4720
Ph: 0457 546993
Email: Douglas.sands@daf.qld.gov.au
™ Trademark
GRDC Project Code: UOQ1207-001RTX,
Was this page helpful?
YOUR FEEDBACK
