P dynamics in vertosols - factors influencing fertiliser P availability over time and the implications for rate, application method and residual value
Author: Mike Bell (University of Queensland), Nelly Raymond (University of Queensland), Peter Kopittke (University of Queensland), Chelsea Janke (University of Queensland), David Lester (DAF Queensland) | Date: 28 Jul 2022
Take home message
- Fertiliser P is an increasingly important contributor to profitable cropping and efficient use of available water and nitrogen
- The method of P application, soil characteristics and seasonal moisture availability will significantly impact the recovery of fertiliser P by plants. Starter P is important but only supplies a small proportion of the crop total P requirement in the year of application
- Dispersing or spreading P fertiliser through large soil volumes to increase root exposure to fertilised soil reduces the risk of P precipitation but enhances the risk of low crop recovery due to strong P sorption to soil surfaces. This risk is enhanced when soil P reserves are strongly depleted and occurs somewhat independent of PBI
- Conversely, applying P in concentrated bands limits the risks of irreversible P sorption but increases the chances of precipitating insoluble P minerals – particularly when fertiliser bands are acidic and/or co-application of other cations like K increases calcium availability in the soil solution
- Fertiliser strategies need to balance the competing risks and rewards from differing volumes of soil P enrichment, while ensuring adequate available P in both topsoils and immediate subsoil layers to meet water limited crop demands
- Closer spaced, less concentrated P bands applied more frequently hold the keys to more effective crop P use in these soils and will increase the return of P in crop residues to enhance the background P supply in topsoil layers.
Introduction
Many Australian Vertosols were originally characterised by moderate, and in some cases quite high, phosphorus (P) fertility. However, declining soil organic matter, net positive nutrient removal (including P) in grains and increasing stratification of P in shallow topsoil layers has led to increasingly widespread occurrences of P limitations to yield. An overly simplistic solution to this problem would be to simply increase the inputs of fertiliser P into the rainfed cropping systems to balance removal, or even to partly rebuild the soil P bank. However, as research has shown in recent years, this is not a simple task due to two main factors. Firstly, P is held very tightly to solid surfaces (clay minerals, organic matter) in these clay soils, with the resulting low concentrations of P in the soil solution. Because P is tightly held by clay minerals any fertiliser P, and P released from decomposing residues (stubbles), effectively remain in the shallow topsoil layers where they are placed. Secondly, our rainfed cropping systems rely heavily on subsoil moisture stored during fallows to support growth during periods (in some cases, whole growing seasons) when the P-enriched topsoil layers are dry. The impact of this periodic topsoil drying on the availability of P to crops, regardless of the amount of topsoil P applied, is illustrated in Figure 1 (reproduced from Raymond et al., 2021). While P stress is a dominant limit to growth in all seasonal conditions without applied P, we see alternating water and P stress occurring in treatments with a highly P-enriched topsoil, with P stress typically observed during drier periods as the topsoil moisture content drops.
These responses clearly illustrate the vulnerability of fertiliser P strategies that focus only on the topsoil layers, and hence the need to consider not only increased fertiliser P inputs but also how that P is placed in the soil profile to improve seasonal P availability.
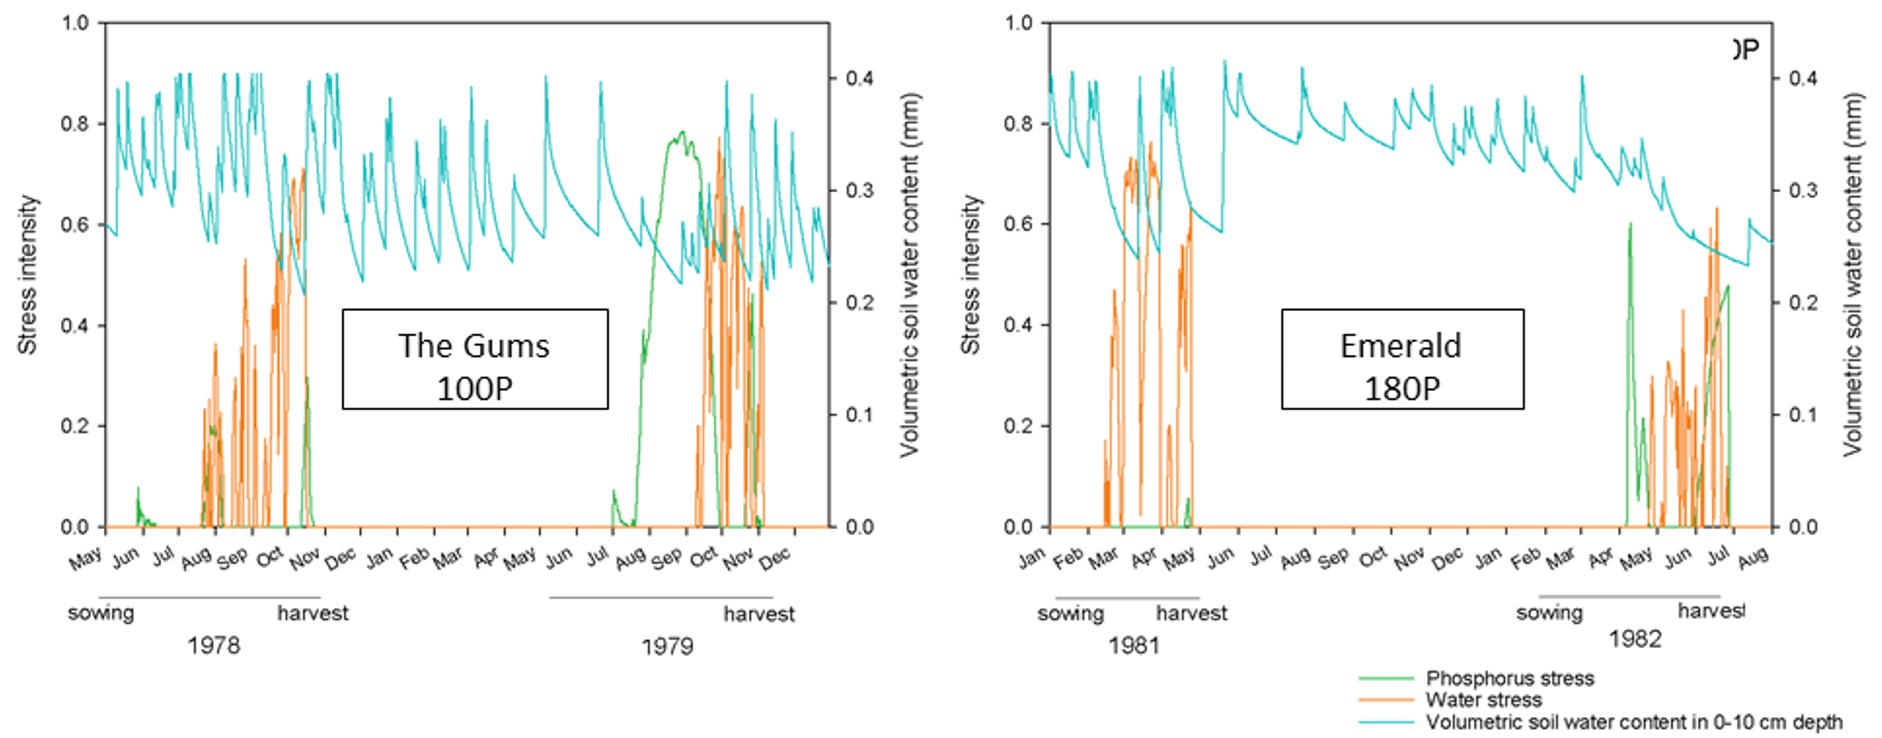
Figure 1. Simulated interactions between crop-water stress (orange solid line), P-stress (green solid line) and soil water content in the topsoil layer (10 cm, magenta line) in successive ‘high yield’ (initial) and ‘low yield’ (second) growing seasons, based on trials from The Gums and Emerald. Plots had 100 kg P ha-1 (100P) and 180 kg P ha-1 (180P) mixed into the top 10cm soil layer for The Gums and Emerald respectively. Simulations produced with APSIM and reported in Raymond et al. (2021).
Fertiliser strategies to address declining soil P fertility
Deep P banding:
The stratification of P reserves in topsoil and the vulnerability of crops to P deficiency in drier seasonal conditions, regardless of profile moisture availability, saw the development of the GRDC supported deep P program that was conducted across a wide range of field sites from 2013 to 2021. This focused on the placement of P deeper into the soil profile (typically 15-25cm) in concentrated bands was designed to improve plant access and uptake of P and preserve of topsoil structure and residue cover. While generally very successful and able to generate significant (Table 1) and profitable responses to applied P in most situations, responses did vary with seasonal conditions (yield potentials and access to topsoil layers) and were driven by relatively small increases in crop P uptake in many instances (e.g., typically only 2-4 kg P ha-1: see Bell et al. 2022).
Table 1. Yields for the farmer reference treatment (Y0) and the greatest deep P response (Ymax) for each site and season. Symbols (*) indicate yield increase was significant (P<0.05). Cited from Bell et al. (2022)
District | Crop 1# | Crop 2 | Crop 3 | Crop 4 | Crop 5 | Crop 6 | ||||||||||||
|---|---|---|---|---|---|---|---|---|---|---|---|---|---|---|---|---|---|---|
Y0 | Ymax | Y0 | Ymax | Y0 | Ymax | Y0 | Ymax | Y0 | Ymax | Y0 | Ymax | |||||||
Dysart | 2.6 | 3.5* | 2.7 | 3.5* | 1.8 | 2.5* | 0.4 | 1.4* | 2.3 | 3.8* | 1.2 | 3.6* | ||||||
Clermont | 1.6 | 2.7* | 0.3 | 1.3* | 1.5 | 1.5 | - | - | - | - | - | - | ||||||
Dululu | 3.9 | 4.2 | 2.7 | 3.3* | 0.7 | 0.9 | 0.4 | 1.3* | - | - | - | - | ||||||
# Crop sequences were – Sorghum-sorghum-sorghum-chickpeas-sorghum-chickpeas at Dysart; Sorghum-chickpeas-sorghum at Clermont; and Wheat-chickpea-mungbean-chickpea at Dululu.
Despite these strong yield responses, the yield response to increasing rates of deep banded P was often linear, suggesting that deep banding was often not able to completely overcome P limitations to grain yield. The reasons for this are still under investigation but are thought to be due to the limited volume of soil P enrichment (Figure 2a), the intense competition between roots that proliferate around these spaced P bands (Figure 2b - van der Bom et al. 2022) that causes rapid drying of the soil around the band (reducing P availability), the low frequency of band re-wetting during a growing season – especially in winter and the very low initial Colwell P values in the surface (0-10cm <18 mg P kg-1) and subsurface (10-30cm <4 mg P kg-1) soils (see Bell et al. 2022).
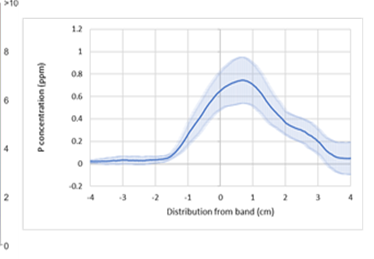
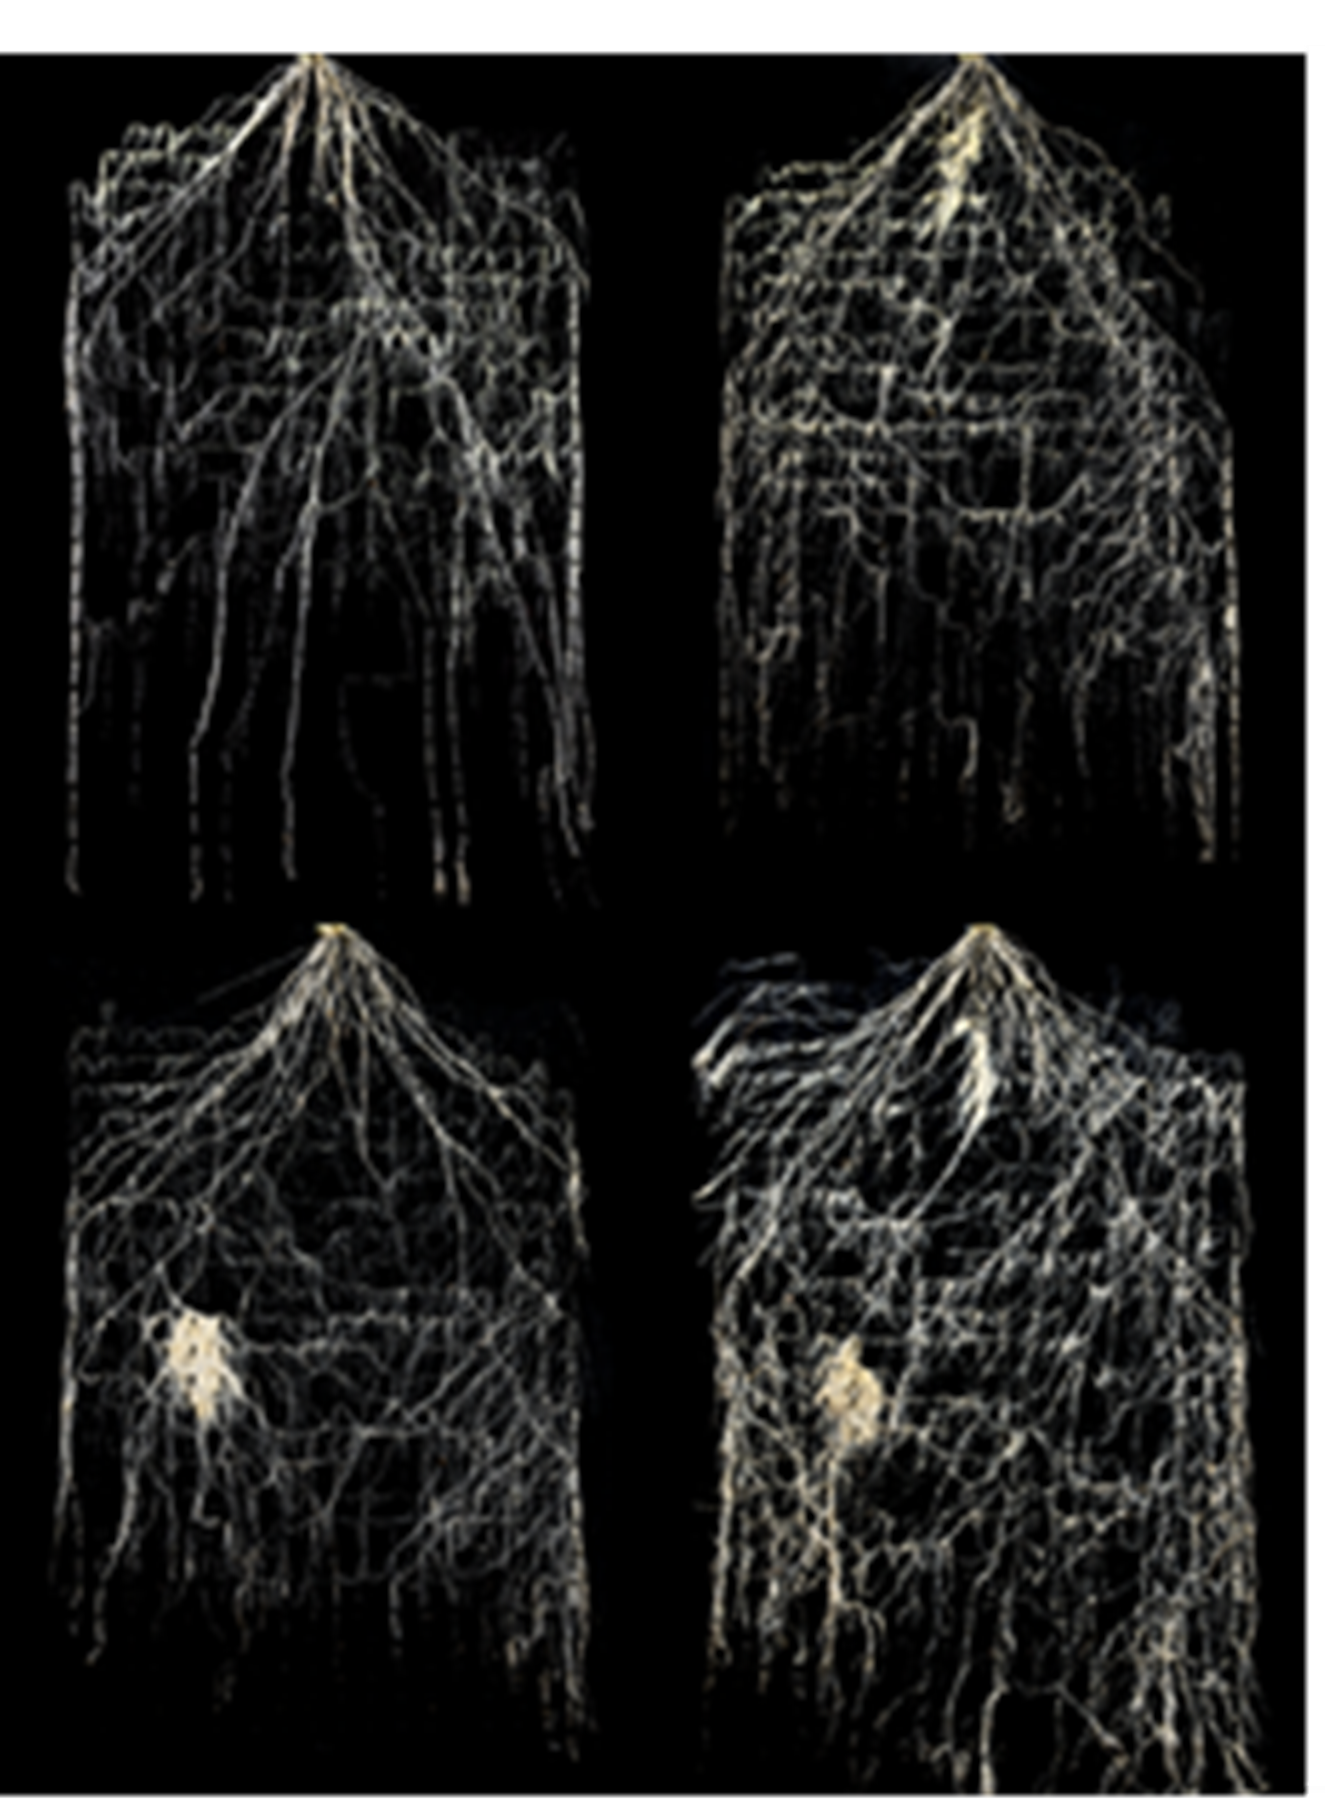
Figure 2. (a) Banded P in Vertosols enriches only small soil volumes in and close to the band, as shown by this net increase in P in diffuse gradient technology (DGT) strips at varying distances from an MAP band (Janke et al. unpublished data). (b). This makes localized root proliferation around each band a critical success factor for accessing that P in these soil types (image from van der Bom et al. 2022).
It has also been demonstrated that the chemical environment in concentrated P bands (i.e., high rates of P and wide band spacings) can limit the amount of extractable P (e.g., Colwell P, or isotopically exchangeable P) in the enriched zone within and around the band. The most important factor driving this effect is pH in the band (the more acidic the pH the lower the proportion of extractable P due to the precipitation of P as Al-P minerals), but soil related factors such as mineralogy (clay content and clay type – Fig. 3) and the addition of other cations (e.g., potassium – K) can also be important (Meyer et al. 2021). These effects can cause the precipitation of applied P as a variety of taranakites and calcium-phosphate minerals (Meyer et al. 2020; Janke et al. 2022 in press), further restricting any likely diffusion of P out into larger soil volumes. The relationship between these soil test measures of extractable P, which collectively suggest reduced P availability in concentrated P bands with and without added K, and the extent to which plants can exploit these P bands over time in the field (e.g., Table 1) are currently under investigation. However, it may be possible for crop roots to slowly access at least some of this precipitated P to support residual benefits in the field.
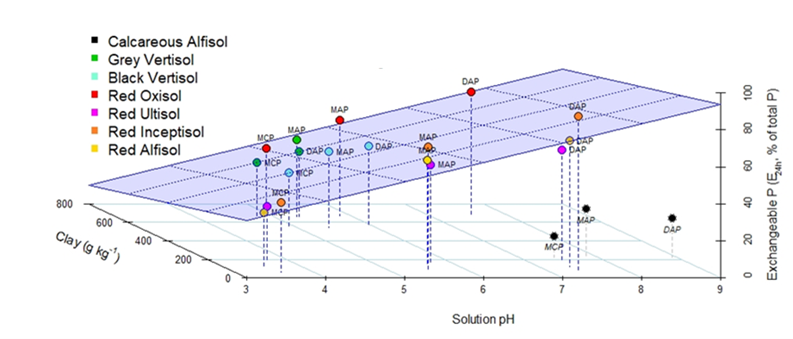
Figure 3. A graph showing the relationship between an estimate of bioavailable P (E24h), pH in the band environment and soil clay content is shown for mono- and di-ammonium P (MAP and DAP) and mono-calcium P (MCP, or triple super phosphate) in a range of contrasting soil types (Meyer et al. 2021).
Overall, it is known that deep P bands produce good crop responses in Vertosols in the field. However, there are some factors that seem to be reducing their effectiveness for completely overcoming P infertility, and perhaps resulting in lower-than-desired fertiliser P use efficiency. It is possible that some of these issues may be overcome with time in a deep banding program, by re-application of deep P bands in different places in the field on each occasion, thereby increasing total subsurface P and the frequency of bands. This will progressively enrich a larger soil volume while exploiting the strong residual value of banded P fertilisers in these soils. Given that P decline in northern cropping systems has slowly increased with crop removal over many decades, it is logical to assume that management responses will also take time to halt and/or reverse the P depletion. However, these findings have also raised the question of whether there are other ways to overcome this P availability problem more rapidly.
Mixing fertiliser P through larger soil volumes:
Limited volumes of P enrichment are a characteristic of banded P applications, with implications for the ability of various crop root systems to proliferate and access P from bands. Consequently, there are questions as to whether mixing P Fertilisers through a greater soil volume in a single application may be a more effective way of supplying P. This strategy would likely avoid some of the P precipitation/solubility issues that arise in concentrated bands (Figure 3), but any advantage may possibly be countered by greater interactions between the soil and fertiliser, increasing the exposure of the applied P to adsorption by clay minerals and organic matter. Vertosols are typically considered to have low-moderate sorption capacity, which is a measure of the ability of a soil to retain P on soil particles when it is applied in solution. The soil Phosphorus Buffer Index (PBI) shown in commercial soil tests is a measure of this sorption capacity, and represents the ability of a soil to sorb P in response to a large rate of P addition (1000 mg P kg-1). While differences in PBI between soils reflect differences in P sorption capacity, a more detailed understanding of differences in the dynamics of added P between soil types is needed to understand fertiliser-soil interactions and can be obtained by conducting more labour-intensive P sorption curves such as those shown in Figure 4. Sorbed P can act as a major reservoir of ‘stored’ P that can replenish soil solution P concentrations. However, understanding the amount of added P needed to ‘fill’ the reservoir and the rate at which that reservoir can supply P to the soil solution to meet crop demand, requires a more detailed understanding of P sorption processes – especially in Vertosols which have not been extensively studied. Raymond et al. (2022) has recently completed studies demonstrating that while Vertosols as a classification have a number of properties in common, there is still a lot of diversity between Vertosols from different locations. As Sol famously said, ‘oils ain’t oils’ and the same can be said for Vertosols.
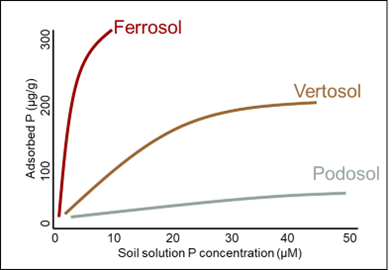
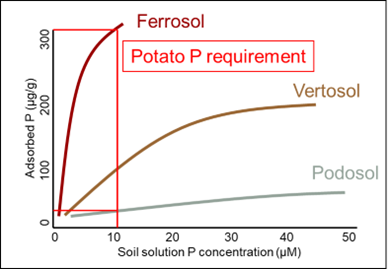
Figure 4. (a) The relationship between soil solution P concentration and the amount of P adsorbed to the soil solid phase for soils with a high (Ferrosol), moderate (Vertosol) and low (Podosol) PBI, and (b) the difference in amount of sorbed P that would be needed in each of these soils to achieve a critical solution P concentration to grow a potato crop. (P Kopittke 2022 - unpublished).
Previous work on the fate of dispersed and incorporated P fertilisers was conducted by Strong et al. (1997) on Vertosols in the western Downs (Billa Billa and The Gums). That work developed a relationship between the amount of P applied (as Triple Super Phosphate [TSP]) and the increase in soil Colwell P at the end of the growing season. This relationship showed that the increase in Colwell P was equivalent to only 29% of the P added in fertiliser, so we used this relationship to establish field experiments with dispersed P on Vertosols at Hopelands and Gindie (both with a PBI of ~120) to define critical topsoil and subsoil P concentrations for different crop species. However, soil tests taken after the initial crop season showed that while the measured Colwell P response was correlated to the P added, the concentrations obtained were less than those targeted, and the relationship varied between sites and profile depths (Figure 5). The Colwell P in the top 10cm layer at Hopelands and Gindie was only 46% (Hopelands) to 59% (Gindie) of that predicted by the Strong et al. (1997) model, and while the subsoil (10-30cm) layer at Gindie behaved similarly to the topsoil (52% of predicted), the subsoil from Hopelands only reached 16% of the targeted Colwell P concentration. The reasons for this were unknown, but these large variations will have a big impact on the efficacy of dispersed P applications and highlighted the need to better understand what drives these differences and how to predict them for different locations.

Figure 5. Relationship between Colwell P predicted using the relationship developed on Vertosols at The Gums and Billa Billa (Strong et al. 1977) and the actual change in Colwell P in the 0-10cm (a) and 10-30cm (b) layers in field trials at Hopelands and Gindie. Data from Bell, Lester and Sands – UQ00082 unpublished).
Studies undertaken by Dr Nelly Raymond in the GRDC project UOQ1905 examined the P sorption and desorption characteristics of Vertosols collected from grain growing fields across Qld and NNSW, with a detailed coverage of this work reported in Raymond et al. (2022). Of particular interest was the large variation in sorption characteristics across the Vertosol group (Figure 6a), and perhaps more importantly, the variability in P desorption that can occur after relatively low rates of P addition (Figure 6b). The latter is of particular interest, in that it is a short-term indicator of the ease with which sorbed P can be re-released into the soil solution in response to crop P uptake.
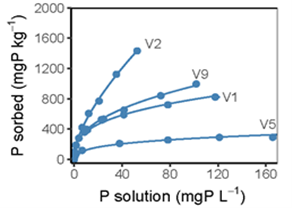
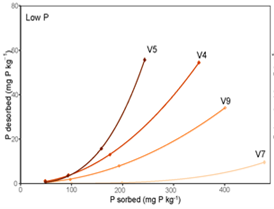
Figure 6. (a) Phosphorus sorption curves for soils collected from the 10-30cm layer of cropped Vertosols, with curves fitted using a non-linear regression model based on a Freundlich equation; and (b) Phosphorus desorption curves for four Vertosols differing in their P release at low concentrations of P initially sorbed (< 500 mg P kg-1; Low P).
These short-term assays reflect the initial interactions between fertiliser P and soil and suggest that despite a relatively narrow range of PBI’s (100-200), there are large variations in the sorption capacity and more importantly, in the likelihood of sorbed P from low application rates into P-depleted soils being readily desorbable again in the short term. This low proportion of readily desorbable P reflects a high proportion of vacant P-specific sorption sites which will tightly retain fertiliser P that is mixed through large soil volumes. Interestingly, as the amount of sorbed P increases with increasing P inputs, these P-specific sorption sites become much less prevalent, the fraction of desorbable P increases and differences between Vertosols were much reduced. This suggests that the severity of P depletion is likely to have a large impact on the plant availability of P mixed through large soil volumes and is consistent with the much lower Colwell P observed in the P depleted and unfertilized 10-30cm layers in Figure 5 – especially at Hopelands.
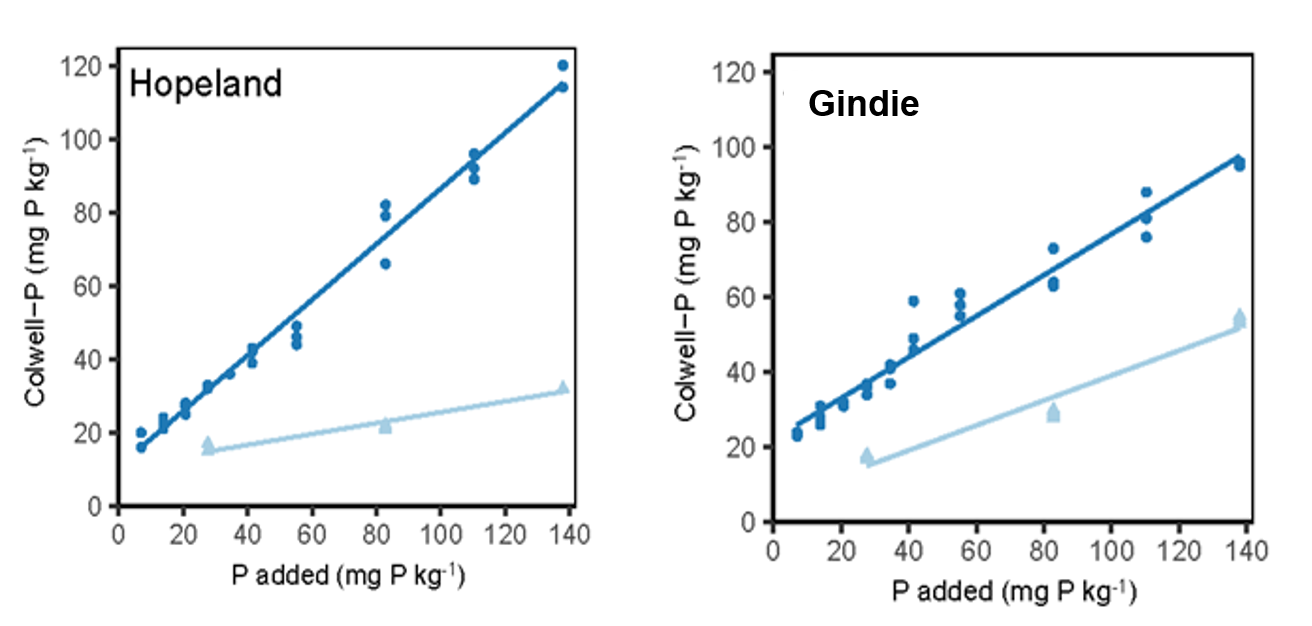
Figure 7. Potentially plant soil available P indicated by Colwell-P following fresh (dark blue line) and aged (light blue line) MAP applications for sites at Hopelands and Gindie. Both were Vertosols with similar PBI (~120), with slightly higher initial Colwell P at Gindie. Raymond et al. 2022 (unpublished)
However, these findings have been derived from short term assays that do not necessarily reflect the longer-term fate of dispersed fertiliser P over time. It is generally accepted that availability of fertiliser P declines with time in contact with soil as a result of processes such as slow diffusion of adsorbed P into surfaces of adsorbing material, P moving into cracks and voids in mineral structures and increased chemical reactions that result in products of low solubility. This is clearly illustrated in Figure 7, which shows the increase in Colwell P immediately after incorporation in topsoils from Gindie and Hopelands and in soils collected from field plots two years after fertiliser application. The drop in Colwell P was much more pronounced in the soil at Hopelands than it was in the Gindie soil, suggesting a lesser long term residual P benefit. The work reported by Raymond et al. (2022) clearly shows that both the initial increase in Colwell P in response to fertiliser application, and the new equilibrium P concentration that results from it, are most closely correlated to the PBI of the soil and the Colwell P concentration prior to fertiliser application. These factors can be combined in an index called the P saturation index (PSI : Colwell P/PBI), with the likely beneficial impact of a dispersed P application decreasing as Colwell P declines or PBI increases. We have not worked with a wide enough range of soils with contrasting PSI values to establish whether this index will be useful in determining the effectiveness of dispersed P applications, but it is reasonable to suggest that all the tested 10-30cm layers would fall in the very low PSI category where dispersed P would be relatively ineffective (i.e., Colwell P <10 and PBI 120-180).
Implications for fertiliser P management in Vertosols:
More effective fertiliser P management is increasingly critical for productive cropping on Vertosol soils in northeast Australia, with inputs into both topsoils (0-10cm) and subsoils (10-30cm) needed to meet P demand under the variable rainfall conditions experienced in these opportunistic cropping systems. Ammonium phosphates are the most effective form of P fertiliser, with little difference in P availability between DAP and MAP. However, the wide range in soil physical and chemical characteristics within this soil type and the highly variable seasonal rainfall will have major implications for fertiliser P management.
Periodic deeper placement is essential to reverse declining fertility in layers that are important sources of P when topsoils are dry, with effective placement in these layers mainly reliant on banding to minimise loss of groundcover, soil tilth and moisture. Trying to disperse P through larger soil volumes with aggressive tillage in these deeper soil layers is likely to be relatively ineffective due to the very low PSI and the high proportion of highly specific P sorption sites that limit P availability to plants. However, if fertiliser bands are too concentrated (e.g., high rates in wide row spacings), root access is limited, and precipitation reactions reduce the proportion of applied P that remains available for plant uptake. The demonstrated residual benefits of banded subsoil P support less frequent applications conducted when moisture conditions are favourable and fertiliser prices are affordable. Closer spaced but less concentrated bands will increase the volume of P-enriched soil and minimize the chance of precipitation reactions within and around the bands. Closer band spacing can be achieved by either closer tine spacing or staggering band positioning during reapplications to treat ‘new’ soil each time. We have conducted experiments to explore interactions between P rate and band spacing at a single application time, but despite early season NDVI showing narrow bands were giving stronger crop responses, it was ultimately the amount of P applied (rate) that drove yield increases.
In topsoil layers with (generally) higher PSI and fewer vacant P-specific sorption sites, there is a less compelling argument for application of concentrated P bands given the fluctuating soil moisture availability. The exception is starter P applied in or near the seeding trench to enhance early seedling vigour and meet the demands of young plants with small and inefficient root systems, but P application rates are often limited by the nitrogen content in the ammonium phosphate fertilisers on which starter products are typically based and the quantity of P acquired by the plant is normally small. However, while the response to an increased volume of soil P enrichment is likely to be more positive in these surface layers, the P sorption capacity is still sufficient to limit the fraction of fertiliser P recovered by plants. Root access to dispersed P in topsoils will also be highly dependent on seasonal moisture availability and resulting root activity, and so a focus on topsoil P enrichment will provide highly variable seasonal contributions to crop P uptake.
Conclusions
This research is unveiling the complexity and contrast in P behaviours that exists in soils which have nominally similar characteristics of classification and PBI. Deep banding fertiliser P (MAP/DAP) into the 10-30 cm layer remains an effective option to increase plant P availability in Vertosols across the northern grains region. Growers are also encouraged to continue applying starter fertilisers with their crops at sowing.
Enriching large volumes in subsoils (10-30 cm) with dispersed P appears prone to delivering only relatively small changes in plant P availability despite applying high P rates, let alone being relatively impractical.
Research opportunities exist to further understand the nature of these P sorption behaviours in the subsoil, the interactions with multiple bands not only in space but time, and the dynamics of P within the band.
Further reading
Mike Bell, Doug Sands and David Lester (2022). Deep P bands – the solution to subsoil decline or just a useful supplement? Proceedings of the 20th Agronomy Australia Conference, 2022 Toowoomba Qld
Meyer G, Bell M J, Lombi E, Doolette C L, Brunetti G, Novotny E H, Klysubun W, Zhang Y, Kopittke P M (2021). Phosphorus speciation in the fertosphere of highly concentrated Fertiliser bands. Geoderma. https://doi.org/10.1016/j.geoderma.2021.115208
Nelly Raymond, Peter M. Kopittke, Enli Wang, David Lester and Michael J. Bell (2021). Does the APSIM model capture soil phosphorus dynamics? A case study with Vertisols. Field Crops Research 273, https://doi.org/10.1016/j.fcr.2021.108302
Nelly S Raymond, Peter M Kopittke, Frederik van der Bom, Michael J Bell (2022). P dynamics in vertosols – which soil properties affect the decline in P availability over time, and are there differences between MAP and DAP? GRDC Update Goondiwindi, March 2022.
Douglas Sands, Mike Bell and David Lester (2022). Increasing grain yields in the sub-tropics by deep banding phosphorus. Proceedings of the 20th Agronomy Australia Conference, 2022 Toowoomba Qld.
Frederik van der Bom, Alwyn Williams, Nelly Raymond, Mike Bell (2022). Root research: What do wheat and sorghum roots do when water is in one part of the profile and phosphorus is in another? Root angle and why does it matter? GRDC Update Goondiwindi, March 2022.
Acknowledgements
The research undertaken as part of this project is made possible by the significant contributions of growers through both trial cooperation and the support of the GRDC, the author would like to thank them for their continued support.
Contact details
Prof Mike Bell
University of Queensland
Gatton Campus, Gatton 4343
Ph: 0429 600 730
Email: m.bell4@uq.edu.au
GRDC Project Code: UOQ1207-001RTX, UOQ1606-002RTX, UOQ1905-009RTX, UOQ1706-006RTX,
Was this page helpful?
YOUR FEEDBACK
