Deep applied phosphorus and potassium: Reapplication of deep bands, timing, and economics
Deep applied phosphorus and potassium: Reapplication of deep bands, timing, and economics
Author: Doug Sands (DAF Qld), Michael Bell (University of Queensland), David Lester (DAF Qld) | Date: 23 Nov 2022
Take home message
- The re-application interval for the deep placement of phosphorus (P) and potassium (K) will depend on the most limiting nutrient
- Reapplication timing of deep P bands will depend on whether the supply of P is adequate in the first place. Trial data suggest a linear relationship between grain yield and P uptake in total dry matter after reapplication. Therefore, the reapplication is providing additional supply rather than replacement of original banded supply
- Positive gross margins are generated in first year after reapplication of deep P despite high input costs
- Potassium-limited sites may require shorter re-application intervals than sites where the main limit is phosphorus
- Potassium uptake in total dry matter after reapplication shows one third of K supply is taken up in the first crop
- Gross margins on K limited site show negative gross margin in the first year after reapplication, but the result was complicated by limited water.
Introduction
Trial work carried out in 2019 on long-term deep banded trial sites has revealed some new data that relates to the reapplication of deep banded phosphorus (P) and potassium (K). The original trial sites have been monitored for 3-6 years, evaluating the long-term benefit of one application of P or K over several cropping cycles. In late 2018, three of these trial sites had a fresh application of P and K added to selected treatments. This was done to evaluate the difference in crop production between the residual fertiliser bands and those where a re-application of deep banded fertiliser was made.
Results from this season are then integrated with those from these sites over the full experiment cycle, and the implications are discussed in relation to the timing of reapplication and the gross margin returns.
Experimental outline
This paper discusses the results of two experiments in which chickpea crops were grown during the 2019 winter season in Central Queensland (CQ), with both sites having re-application of both deep P and K bands.
Experiment 1 – Dysart long-term nutrition site
Phosphorus trial
Originally, seven unique treatments were applied in August 2013 (Table 1). These treatments consisted of a Farmer Reference (FR) treatment (existing practice on that property), and six treatments that were deep ripped. Four of the ripped treatments received background fertiliser to supply nutrients that might otherwise limit responses to P (80 kg nitrogen (N)/ha, 50 kg of K/ha, 20 kg sulphur (S)/ha and 0.5 kg of zinc (Zn)/ha), while the other two treatments did not receive any extra K or S fertiliser. All ripped plots received one of four P rates as deep bands applied at a depth of 20-25 cm and 50 cm apart. Rates were 0, 10, 20, and 40 kg of P/ha applied as MAP. The four P rates were applied in the ripped plots with all additional nutrients, but only the 0P and 40P treatments were applied to plots without additional K and S background fertiliser. Plots were eight metres (m) wide by 32 m long and the fertiliser bands were placed in the same direction as the old stubble rows. There were six replicates making a total of 48 plots for the trial. Treatments are outlined in Table 1.
In 2019, plots that had received the four original P treatments (0, 10, 20 and 40 kg P/ha) were split and a fresh 30 kg P/ha was applied using a similar placement strategy to the original 2013 applications (Table 1). However, the implements and tractors were different, and it is most likely the residual bands, and the re-application bands were positioned slightly offset to each other. Additional background fertiliser was applied at the same time; 50 kg K/ha (granular) and 90 kg N/ha (liquid). The half of the plots that received no additional P were also ripped with the same amount of background fertiliser applied (N and K). The original treatments that previously had no background fertiliser applied (0P-KS, 40P-KS) except N and Zn, were also split and had extra P applied (30 kg/ha) to one half of the plot (Table 1). These treatments had an extra 90 kg N/ha applied to both sides of the plot while they were being ripped, however received no K or S. The original farmer reference plots (FR) were left untreated and had no ripping.
Starter fertiliser was applied by liquid injection with the seed at planting (10 L/ha ammonium polyphosphate,10-34-0, plus 3 L/ha Foundation™ - fertiliser biocatalyst). This starter rate was split in the P trial so that all treatments could have a ‘with’ and ‘without’ starter treatment, effectively doubling the number of plots assessed. Kyabra chickpea was planted at 50 kg/ha on 10 May 2019 into good moisture with a plant available water content (PAWC) of 176 mm two weeks after planting. The crop received 41 mm of in-crop rainfall, all before flowering.
Potassium trial
This trial was established in a similar fashion to the P trial outlined above. Different rates of K were applied in the deep bands and P was substituted for K in the background fertiliser applications (Table 1). The original trial had seven unique treatments applied in August of 2013, with a farmer reference (FR) (unripped) treatment, four rates of K that received the complete background fertiliser mix (0, 25, 50, 100 kg of K/ha) and two treatments that received 0 or 100 kg K/ha but without P and S in the background fertiliser mix.
In 2019, the four original K treatments (0, 25, 50 and 100 kg K/ha) had their plots split and 50 kg K/ha was applied using a similar strategy as outlined for the P trial (Table 1). Additional background fertiliser supplying 30 kg P/ha and 90 kg N/ha was applied at the same time, with and without the fresh K application in the respective sub-plots, while the farmer reference (FR) plots were not tilled and received no additional background nutrition (Table 1). The original treatments that had no P and S applied in the background fertiliser mix (0K-PS, 100K-PS) were treated similarly this time, receiving only the additional 50 kg K/ha.
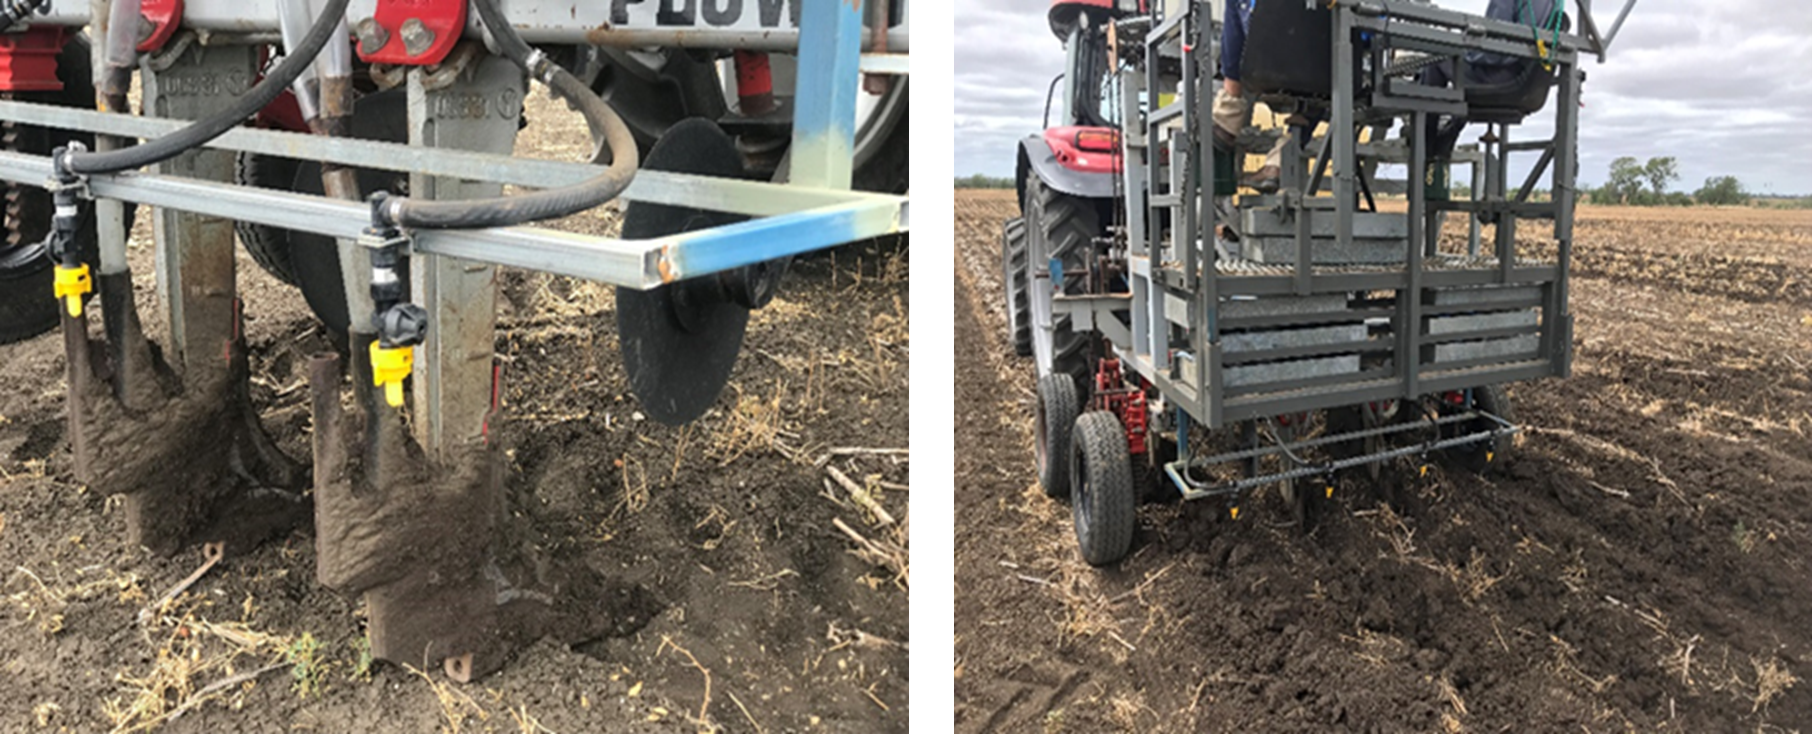
Figure 1. Re-application in phosphorus and potassium trials.
Table 1. Summary of extra nutrient application rates and change of treatment labels after re-application of fertiliser rates in January 2019 for P and K trials at the Dysart site.
Trial | Original treatment label (2013) | New treatment label | Additional | Additional | Additional | Additional | Additional |
|---|---|---|---|---|---|---|---|
Phosphorus | 0P | 0P+30P | 90 | 30 | 50 | 0 | 0 |
0P | 90 | 0 | 50 | 0 | 0 | ||
10P | 10P+30P | 90 | 30 | 50 | 0 | 0 | |
10P | 90 | 0 | 50 | 0 | 0 | ||
20P | 20P+30P | 90 | 30 | 50 | 0 | 0 | |
20P | 90 | 0 | 50 | 0 | 0 | ||
40P | 40P+30P | 90 | 30 | 50 | 0 | 0 | |
40P | 90 | 0 | 50 | 0 | 0 | ||
0P-KS | 0P-KS+30P | 90 | 30 | 0 | 0 | 0 | |
0P-KS | 90 | 0 | 0 | 0 | 0 | ||
40P-KS | 40P-KS+30P | 90 | 30 | 0 | 0 | 0 | |
40P-KS | 90 | 0 | 0 | 0 | 0 | ||
FR | FR | 0 | 0 | 0 | 0 | 0 | |
Potassium | 0K | 0K+50K | 90 | 30 | 50 | 0 | 0 |
0K | 90 | 30 | 0 | 0 | 0 | ||
25K | 25K+50K | 90 | 30 | 50 | 0 | 0 | |
25K | 90 | 30 | 0 | 0 | 0 | ||
50K | 50K+50K | 90 | 30 | 50 | 0 | 0 | |
50K | 90 | 30 | 0 | 0 | 0 | ||
100K | 100K+50K | 90 | 30 | 50 | 0 | 0 | |
100K | 90 | 30 | 0 | 0 | 0 | ||
0K-PS | 0K-PS+50K | 90 | 0 | 50 | 0 | 0 | |
0P-KS | 90 | 0 | 0 | 0 | 0 | ||
100K-PS | 100K-PS+50K | 90 | 0 | 50 | 0 | 0 | |
100K-PS | 90 | 0 | 0 | 0 | 0 | ||
FR | FR | 0 | 0 | 0 | 0 | 0 |
Note: The ‘new treatment labels’ will be used in the results section to present data rather than the ‘original treatment labels.’(FR = farmer reference)
Experiment 2 – Dululu long-term nutrition site
The original P and K trials were established at this site in late 2015, with the first crops sown in 2016 winter season. Deep P and K bands were re-applied after harvest of the 2018 winter crop.
Phosphorus trial
A similar set of seven treatments were established in this trial as in the P trial at Dysart, with a farmer reference and six other ripped treatments receiving one of four rates of deep P (0, 10, 20, and 40 kg of P/ha) and background fertiliser with or without potassium (K) and sulphur (S) (0P-KS and 40P-KS). These are listed in Table 2. Deep applications were made in a similar fashion to Dysart, but plots were split to receive one of two starter P treatments (with or without starter P). Plots at this site were 6 m wide and 28 m long, each treatment had four replicates and the trial consisted of 64 plots in total.
The trial was modified on the 10 December 2018 with the re-application of some deep bands of fertiliser. As the trial had not run as long as the one at Dysart, not all plots were split to ‘with’ and ‘without’ a fresh deep P application. Instead, only the plots with the original rate of 10 kg P/ha applied had another 30 kg P/ha applied, to provide a ‘fresh deep P’ benchmark to gauge the residual effectiveness of the original deep P applications. All originally ripped plots were re-ripped and received additional background fertiliser of 90 kg N/ha and 50 kg K/ha, except for the 0P-KS and 40P-KS treatments, where the K was deleted from the background fertiliser blend. As at Dysart, the FR treatment received no deep ripping and no additional background fertiliser. Plot labels for each of the seven treatments were modified to represent their new status (see Table 2).
Kyabra chickpea was planted at 50 kg/ha on 10 May 2019 into a profile with a plant available water content (PAWC) of only 77 mm to a depth of 120 cm (50-60% full). The crop was deep planted at a depth of 15 cm as there was no planting rainfall for this crop, and the site only received 34 mm of in-crop rainfall, all before flowering. Crop performance was therefore strongly limited by available water.
Potassium trial
Treatments were again similar to those described in the K trial at Dysart, with treatments listed in Table 2. The re-application strategy was similar to that employed in the P trial at this site, with the plots receiving the initial application rate of 25 kg K/ha and receiving a further 50 kg K/ha in addition to background fertiliser that consisted of 90 kg N/ha and 30 kg P/ha. All other treatments were ripped down to 25 cm and had background N and P fertiliser applied but no extra K was added, except for the original 100K-PS and 0K-PS treatments, that only received additional N but no P. The FR plots were again left completely undisturbed. There were no split starter P treatments in the K trial, so every plot received starter P (Granulock Z® @ 40 kg/ha) at sowing.
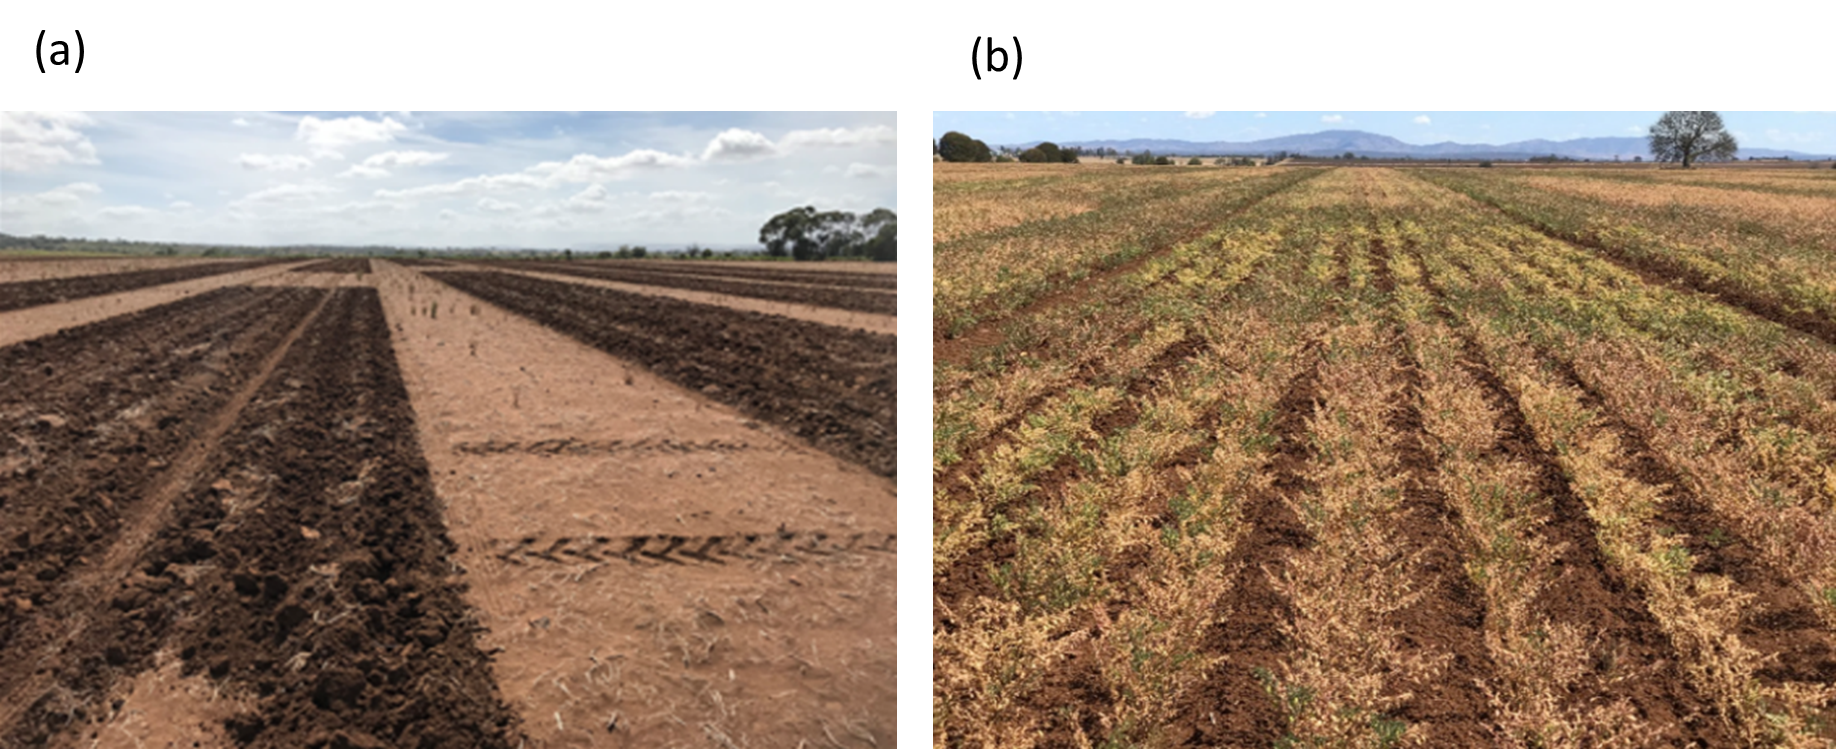
Figure 2. (a) Re-application of plots in December 2018 at Dululu, and (b) the chickpea nearing maturity in 2019.
Table 2. Summary of nutrient application after re-application in December 2018 for the Dululu trial site.
Take note the new treatment labels will be used in the results section. (FR = Farmer reference)
Trial | Original treatment label (2015) | N rate (kg/ha) | P rate (kg/ha) | K rate (kg/ha) | S rate (kg/ha) | Zn rate (kg/ha) | New treatment label (2018) | N rate (kg/ha) | P rate (kg/ha) | K rate (kg/ha) |
|---|---|---|---|---|---|---|---|---|---|---|
Phosphorus | 0P | 80 | 0 | 50 | 20 | 0.5 | 0P+NK | 90 | 0 | 50 |
10P | 80 | 10 | 50 | 20 | 0.5 | 10P/30P+NK | 90 | 30 | 50 | |
20P | 80 | 20 | 50 | 20 | 0.5 | 20P+NK | 90 | 0 | 50 | |
40P | 80 | 40 | 50 | 20 | 0.5 | 40P+NK | 90 | 0 | 50 | |
0P-KS | 80 | 0 | 0 | 0 | 0.5 | 0P-KS+N | 90 | 0 | 0 | |
40P-KS | 80 | 40 | 0 | 0 | 0.5 | 40P-KS+N | 90 | 0 | 0 | |
FR | 0 | 0 | 0 | 0 | 0 | FR | 0 | 0 | 0 | |
Potassium | 0K | 80 | 20 | 0 | 20 | 0.5 | 0K+PN | 90 | 30 | 0 |
25K | 80 | 20 | 25 | 20 | 0.5 | 25K/50K+PN | 90 | 30 | 50 | |
50K | 80 | 20 | 50 | 20 | 0.5 | 50K+PN | 90 | 30 | 0 | |
100K | 80 | 20 | 100 | 20 | 0.5 | 100K+PN | 90 | 30 | 0 | |
0K-PS | 80 | 0 | 0 | 0 | 0.5 | 0K-PS+N | 90 | 0 | 0 | |
100K-PS | 80 | 0 | 100 | 0 | 0.5 | 100K-PS+N | 90 | 0 | 0 | |
FR | 0 | 0 | 0 | 0 | 0 | FR | 0 | 0 | 0 |
Data collection for both trials included emergence plant counts, with starting soil water and starting nitrogen (N) measurements taken shortly after emergence. Total dry matter cuts were taken at physiological maturity and yield measurements were taken with a plot harvester when commercial harvesting started in the same paddock. A grain sample was kept from the plot for nutrient analysis. Both the dry matter samples and the grain samples were analysed for nutrient contents.
Results
The detailed results from the reapplication for both the P and K trials at both these sites has been discussed in detail in a previous GRDC update paper (Sands et al, 2020).
The focus of this paper is on lessons learnt on the timing and economic benefit of reapplication. Selected data will be highlighted from both trial sites to demonstrate some of the issues that exist around reapplication of deep banding P and K nutrients.
The timing of reapplication depends on several factors.
- Which nutrient is the most limiting. Uptake figures for P and K are quite different, therefore the timing of reapplication will also be different.
- The relationship between nutrient uptake in total dry matter (TDM) and grain yield.
- The cost of reapplication in relation to crop returns.
Phosphorus reapplication
Firstly, the results from the accumulated grain yields achieved at each site give an indication of the most limiting nutrient at each site. The accumulated yield data shows the net increase in grain yield over the farmer reference treatments rather than the absolute yields.
The Dysart site (Figure 3) includes the five crops grown before reapplication was done across the six treatments in the deep P trial. The accumulated grain yield data shows a 1500 kg/ha (33%) difference between the two 40P treatments where the background fertiliser of K and S was applied and not applied (-KS). This is a significant difference but less than the difference in P treatments between the lowest (0P) and the highest (40P) of ~3000 kg/ha.
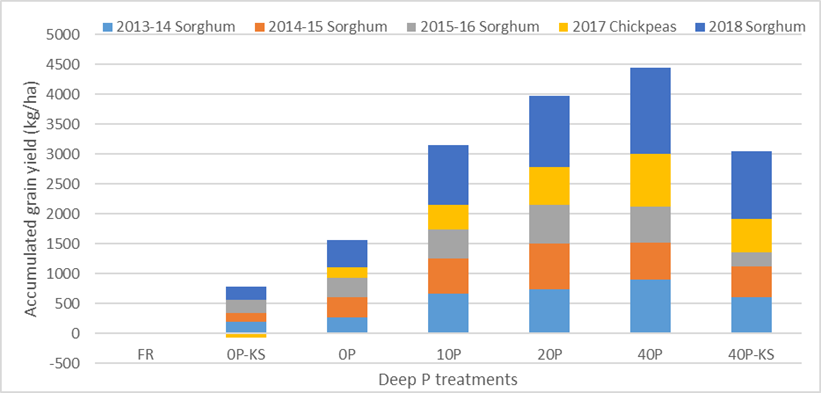
Figure 3. Comparison of accumulated grain yield differences for P treatments over five crops in the
Dysart trial site, using the farmer reference (FR) treatment as a baseline of zero.
In comparison, the K trial at the Dysart site shows a much bigger relative difference when the background P and S fertiliser is not applied (Figure 4). The 100K-PS treatment is 2500 kg/ha less than the 100K treatment which shows an 80% reduction in yield. Additionally, the 100K-PS has no more accumulated grain yield then the 0K-PS treatment, which means there is no response to putting 100 kg K/ha unless there is background P added. These two pieces of data demonstrate that P is the most limiting factor at this site and that additional K will only provide a response once the P limitation is resolved.
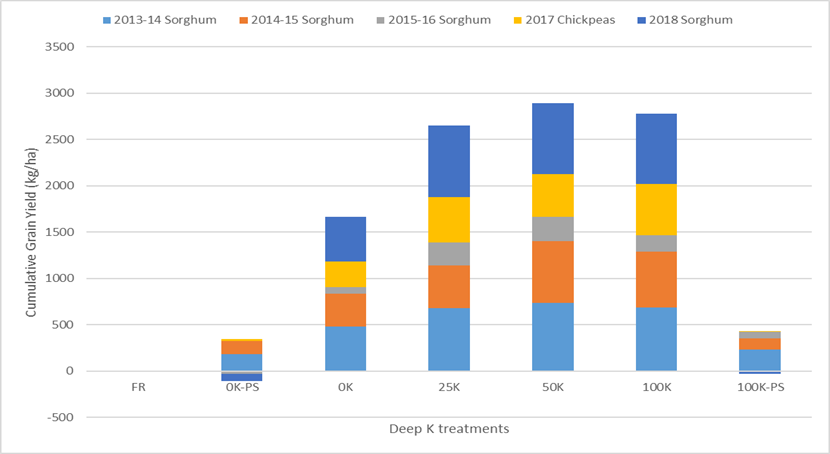
Figure 4. Comparison of accumulated grain yield differences for K treatments over five crops in the
Dysart trial site, using the farmer reference (FR) treatment as a baseline of zero.
Being able to predict when reapplication is required for a P responsive site is difficult as a simplified mass balance model does not apply very well. The Dysart P trial is a good example of this when the differences in P uptake between the 0P and 40P treatments are added up over the five seasons (Table 3). These uptake figures can be compared to the grain yields achieved from these treatments (Table 3), showing that the 40P treatments have produced an extra 2654 kg/ha of grain over the 0P treatments but only removed an extra 8.29 kg P/ha over the five crops that have been grown in this period.
This amount of P taken up by the crop from the 40P treatment represents just 20% of the total amount applied. Projecting this data forward and assuming all the original treatment is available, suggests that it would take another 22 years before the deep bands would run out. Yield data taken after the reapplication treatments (Figure 5) suggest that there are other factors governing P uptake.
Table 3. Differences in in P uptake in TDM across five consecutive crops in selected treatments with related grain yields.
P uptake in TDM (kg/ha) | ||||||
|---|---|---|---|---|---|---|
Treatments | Sorghum | Sorghum | Sorghum | Chickpea | Sorghum | Totals |
FR | 6.61 | 6.18 | 5.07 | 1.62 | 6.73 | 26.21 |
0P | 9.54 | 9.13 | 5.64 | 1.73 | 8.12 | 34.15 |
40P | 12.81 | 10.15 | 6.91 | 3.07 | 9.50 | 42.44 |
Diff. 40P-0P | 3.27 | 1.02 | 1.27 | 1.34 | 1.38 | 8.29 |
Grain yields (kg/ha) | ||||||
FR | 2606 | 2713 | 1845 | 522 | 2282 | 9969 |
0P | 2868 | 3058 | 2184 | 689 | 2721 | 11520 |
40P | 3504 | 3334 | 2280 | 1379 | 3677 | 14175 |
Diff. 40P-0P | 636 | 276 | 96 | 690 | 956 | 2654 |
The P uptake data (Table 3) also shows that the corresponding grain yields fluctuate despite the P uptake figures being similar. This means that P uptake data is not a good predictor of yield, and we know that seasonal conditions and N supply have both had an impact in this trial over the years.
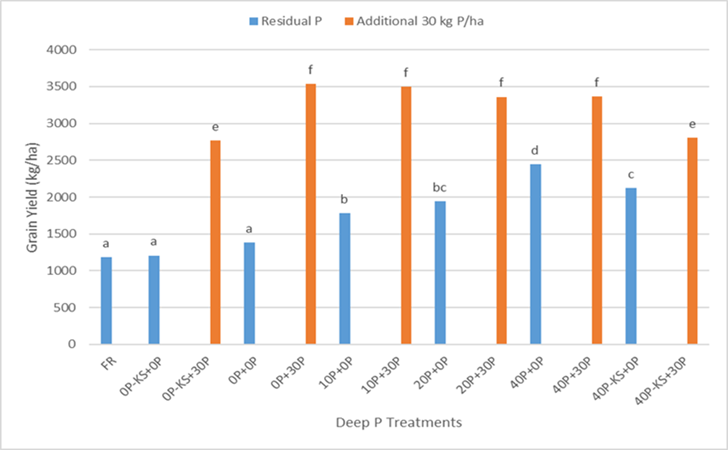
Figure 5. Comparison of mean grain yields across all deep phosphorus treatments in 2019 Dysart chickpeas.
Means with the same letters are not significantly different at the 5% level (LSD = 251.7) (FR = farmer reference).
The yields produced from the 2019 chickpea crop (Figure 5) after reapplication had occurred, would suggest that the residual 40P and 20P applications have still provided a significant yield increase of over one ton/ha in comparison to the original 0P treatment. However, the reapplied treatments (+30P) have provided another ~1 ton/ha increase in yield over the residual 20P and 40P treatments.
There was also a significant difference between the original 20P and 40P treatments (~500 kg/ha) which would suggest that the extraction of P is becoming harder out of the original 20P treatment bands. Particularly as the reapplied treatments (+30P) have all produced similar yields.
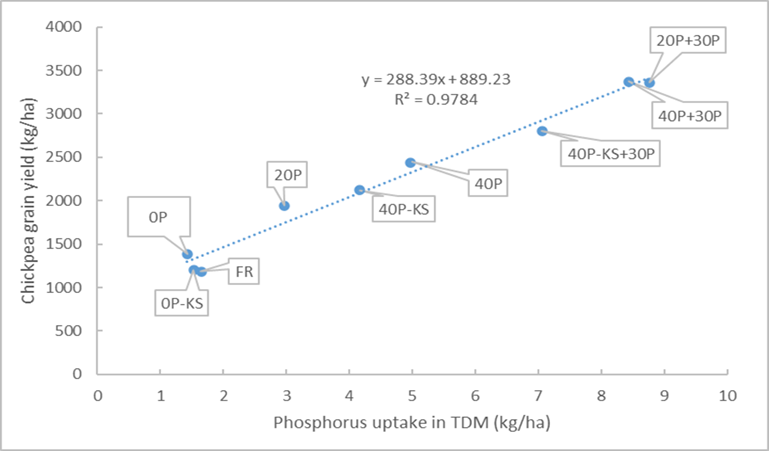
Figure 6. Scatter plot of grain yields versus plant uptake of phosphorus in total dry matter (TDM)
across selected deep phosphorus treatments in the 2019 chickpea crop after reapplication.
Plotting grain yield against P uptake (Figure 6) confirms that P uptake is getting harder in the original treatments (20P, 40P) compared to those that have reapplied P (20P+30P, 40P+30P). This is despite the fact that only 20% of the total P applied in the original 40P treatment has been taken up in the previous five crops. This data indicates there is a significant difference in availability of P from the bands between freshly applied P (40P+30P) versus the original P bands (40P) that were applied in 2013. This is why predicting reapplication timing from mass balance is difficult and supports the conclusion that some other factor is affecting the availability of the P in the original bands.
Vertosol soils can vary a lot in their phosphate sorption capacity. This was highlighted in a recent incubation study (Raymond et al, 2022), however this study revealed that most of the sorption occurred in the first 30 days after application and remained stable out to 12 months after application (Figure 7). This means the net effect of this sorption capacity would occur before the first crop was planted.
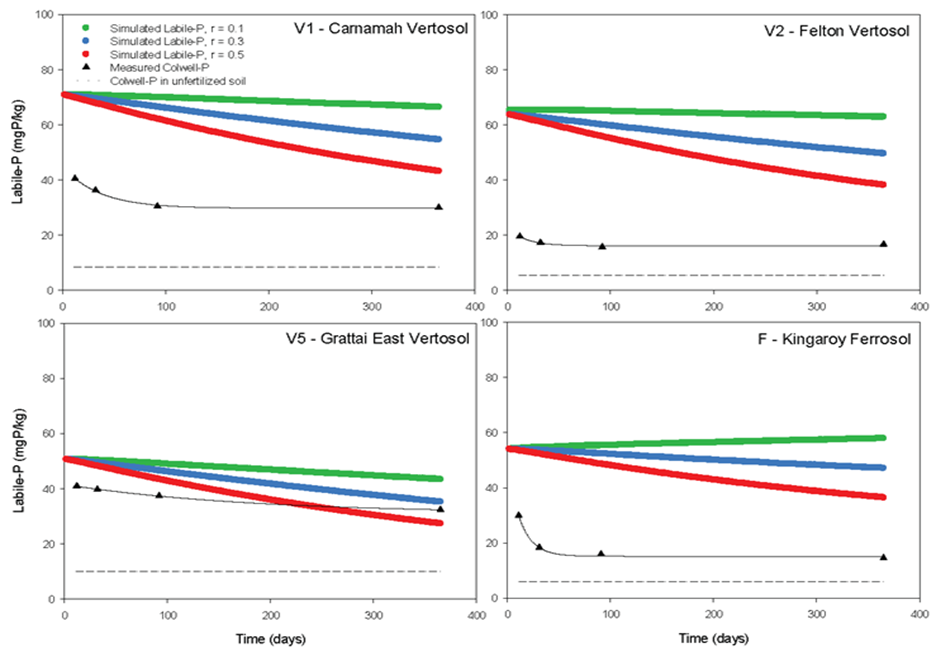
Figure 7. Data from field measurements (black line) and APSIM-simulated (coloured lines) showing
the decrease of available P over time after P-fertilizer addition (published Raymond et al., 2020).
The unknown factor is how much P is precipitated out as non-soluble calcium phosphates over time and the impact this could have on the supply of soluble P out of the deep bands applied in 2013. Understanding the soils’ capacity to convert soluble P into non-labile P would assist in predicting an optimum reapplication timing.
The other issue with using data from the P trial at Dysart, is that plotting the yield versus uptake (Figure 6) indicates that maximum yield (Ymax) has not been achieved in relation to P uptake. There is clearly a linear regression between P uptake and grain yield in the 2019 chickpea crop (Figure 6).
This data strongly indicates that the success of reapplication at this site was not a mechanism of timing but more a building of critical P supply. Theoretically, this response could have been achieved in any of the subsequent years after the original applications were put down. In other words, the Dysart site was so low in P supply that the original bands applied in 2013 were unable to meet crop requirements despite yield responses being positive.
Further evidence of this is seen when the Dysart P data and the Dululu P data from 2019 are plotted on the same scatter graph with yield versus P concentration in total dry matter (TDM) (Figure 8). The Dysart data shows that any small change in P concentration is leading to a large change in yield response at a site that we know is strongly P limiting. The Dululu data is the opposite with larger changes in P concentration, producing only small changes in yield from a site where the P limitation is secondary to a K limitation.
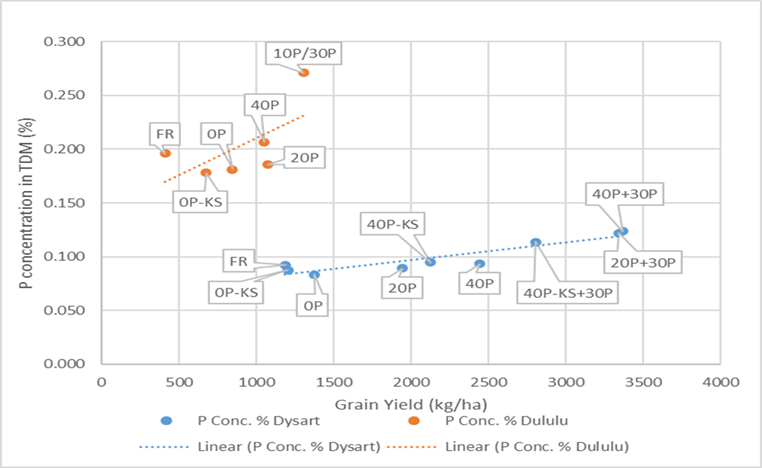
Figure 8. A scatter plot showing the relationship between biomass P concentration and
chickpea grain yield in the P trials at Dululu and Dysart trial sites for 2019.
The reapplication of P at the Dysart trial site has shown that P supply is still the major issue, however there are several factors that impact on the plants level of response to P supply. Not all paddocks will have the same response to P uptake that has occurred at the Dysart site.
Firstly, the water holding capacity of the soil at Dysart when fully wet down to 120 cm is between 180 -200 mm. There are no other restrictions in the soil profile in relation to sodicity and salinity; and the site has been under controlled traffic conditions for over 10 years (no compaction issues). All these factors means that the site has quite a high production potential if nutrition factors are resolved.
Secondly, the original soil test from the Dysart site (Table 4) suggests that P is limiting in both the surface (0-10 cm) and sub-surface soil (10-30 cm). This means that the deep P bands are providing almost all the increase in P uptake that is being converted into grain yield. Consequently, efficiency of deep applied P is at its highest, but the inherent restrictions created by banding nutrients is also a factor. Banding does create a positive concentration gradient for diffusion uptake, but it also means the concentration of roots around the band will dry out the nutrition zone much faster than the surrounding soil and consequently reduce access to the nutrient in the band.
Table 4. Original Colwell P and BSES P soil test analysis of the Dysart and Dululu trial sites.
Units (mg/kg) | Trial site | |||
|---|---|---|---|---|
Dysart | Dululu | |||
Depth (cm) | Colwell P | BSES P | Colwell P | BSES P |
0-10 | 5 | 8 | 22 | 20 |
10-30 | <2 | 3 | 2 | 4 |
30-60 | <2 | 4 | <2 | 2 |
The critical timing of reapplying deep P does have an economic aspect to the decision-making process, particularly in relation to the current price of fertiliser and commodities. A basic gross margin analysis based on the grain yields from 2019 chickpeas (Table 5) shows that despite the elevated costs of fertiliser and the reduced price of chickpeas the gross margin still returns more than $600/ha after a reapplication of 30 kg P/ha plus background K. The size of the grain response to reapplication makes a big difference to these calculations.
It is also worth noting that the residual 40P treatment still returned $457/ha which is $181/ha less than the reapplication treatments but $450/ha more than the 0P treatments (Table 5). When the same gross margin calculations are done with prices that are averaged over the last 10 years (2011 – 2021), then the gap between the residual P treatments and the reapplication treatments are closer to $500/ha (Table 5).
The difficulty in using the 2019 yield data from the Dysart trial is that the evidence suggests the response is more about increasing the supply of P rather than about replacing the supply of P. This makes it difficult to use this data as an indicator for the optimum timing of reapplication.
In terms of risk management, the gross margin data suggests that payback can be easily managed in the first year of production, which means there is no reliance on subsequent crop yield improvement to meet the reapplication outlay and the period of exposure to the extra cost is limited to just one season. Other crops such as wheat, sorghum or barley may have a different gross margin outcome based on historical pricing of those commodities.
Another unknown in this scenario is what the reapplication benefits will be on successive crops. Logic suggests that if a response to deep P has already been proven, then the benefit in future crops from reapplication will be considerable.
Table 5. Gross margin analysis of selected treatments from Dysart 2019 P trial using current fertiliser prices and prices that are averaged over the last 10 years.
Current prices | |||||
|---|---|---|---|---|---|
Treatment | Grain yield | Revenue | GM | Add Fert | GM |
0P | 1.38 | 587 | 127 | 120 | 7 |
20P | 1.94 | 825 | 365 | 120 | 245 |
40P | 2.44 | 1037 | 577 | 120 | 457 |
20P+30P | 3.36 | 1428 | 968 | 330 | 638 |
40P+30P | 3.37 | 1432 | 972 | 330 | 642 |
10-year average prices (2011 - 2021) | |||||
Treatment | Grain yield | Revenue | GM | Add Fert cost | GM |
0P | 1.38 | 938 | 478 | 75 | 403 |
20P | 1.94 | 1319 | 859 | 75 | 784 |
40P | 2.44 | 1659 | 1199 | 75 | 1124 |
20P+30P | 3.36 | 2285 | 1825 | 195 | 1630 |
40P+30P | 3.37 | 2292 | 1832 | 195 | 1637 |
The reapplication costs do not have additional N cost included as the analysis is based on a chickpea crop. Current and averaged chickpea prices have also been used in the analysis.
Potassium reapplication
The Dululu site shows a slightly different pattern of response to the Dysart site. The P trial (Figure 9) shows the accumulated grain yield from the three crops leading up to reapplication. This data shows that the 40P treatment without background K (-KS) is no better than the 0P treatment. This means that the addition of 40P gives no yield response unless the background K is added.
The K trial (Figure 10) at the Dululu site shows a 400 kg/ha difference in the two 100K treatments which demonstrates the impact of background P; however, this is not as large as the 600 kg/ha of additional yield between the 0K and 100K treatments. These two figures show that at this site, that K is the most limiting nutrient as there is no response to P unless there is background K added.
The accumulated grain yield data (Figures 9 and 10) demonstrates the Dululu site is a K limited site first and as a result the value of reapplication is more directly attributable to the performance of the crop in relation to K supply.
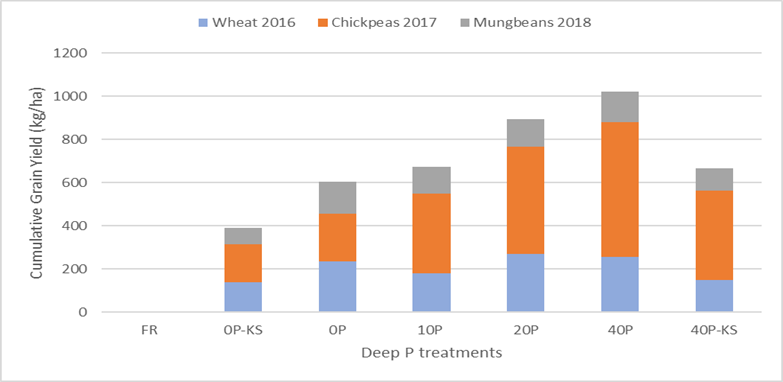
Figure 9. Comparison of accumulated grain yield differences for P treatments over three crops in the
Dululu trial site, using the farmer reference (FR) treatment as a baseline of zero.
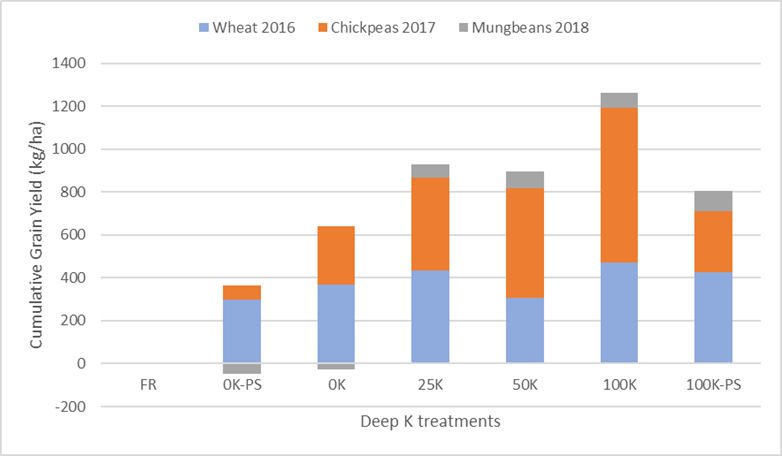
Figure 10. Comparison of accumulated grain yield differences for K treatments over three crops in the
Dululu trial site, using the farmer reference (FR) treatment as a baseline of zero.
The measurement of K uptake in total dry matter (TDM) from the K trial at the Dululu site (Table 6), demonstrates that the scale of K uptake from the deep bands is quite different to P uptake in the Dysart trial. The first three crops grown at the Dululu site removed a total of 63.1 kg K/ha from the 100K treatment bands for a total of 649 kg/ha of extra grain yield (Table 6). To put this into context the Dululu K trial has used up 60% of the K supplied in the 100K treatment over a period of three crops, while the P trial at Dysart has only used 20% of the original P supplied in the 40P treatment spread over five crops. This data (Table 6) illustrates how far more K is taken up in the crop in a K limited situation than when P is the limitation (Table 3). This data suggests that the replacement of that K will need to occur on a shorter time frame or larger amounts will need to be applied to keep up with the supply required. This why a K limitation in the sub-surface profile is a more difficult and potentially a more expensive situation to fix then a P limitation.
Table 6. Differences in K uptake in total dry matter (TDM) across three consecutive crops in selected treatments with related grain yields.
K uptake in TDM (kg/ha) | ||||
|---|---|---|---|---|
K trial | Wheat | Chickpeas | Mungbeans | Totals |
FR | 50 | 27.3 | 47.9 | 125.2 |
0K | 52.6 | 26.1 | 46.6 | 125.4 |
100K | 74.9 | 48.4 | 65.1 | 188.4 |
Diff. 100K-0K | 22.3 | 22.3 | 18.5 | 63.1 |
Grain yield (kg/ha) | ||||
FR | 3975 | 2552 | 665 | 7192 |
0K | 4342 | 2825 | 639 | 7806 |
100K | 4444 | 3276 | 735 | 8455 |
Diff. 100K-0K | 102 | 451 | 96 | 649 |
The yield data from the reapplied K trial at the Dululu (Figure 12) shows a significant improvement in yield from the only treatment that had a reapplication of K (25K/50K). All other treatments had similar yield outcomes, which means despite the additional P and N added to these treatments there was no significant difference between any of the other treatments. This highlights that any residual K remaining from the original 50K and 100K treatments was not enough to produce more yield than those treatments that never had any K applied (0K, 0K-PS).
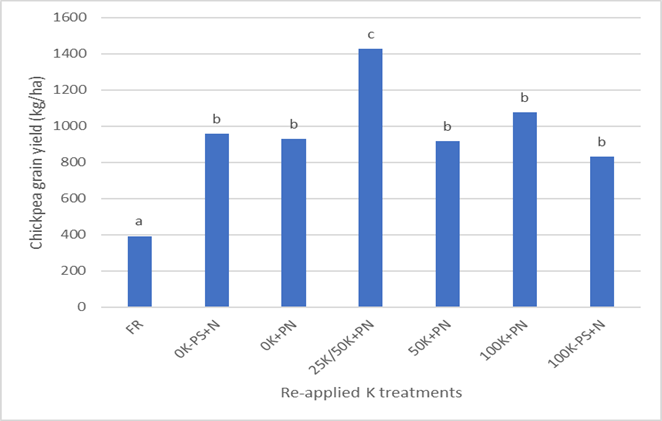
Figure 11. Comparison of mean grain yields across all deep potassium treatments in
2019 Dululu chickpeas (FR = farmer reference).
Means with the same letters are not significantly different at the 5% level (LSD = 222).
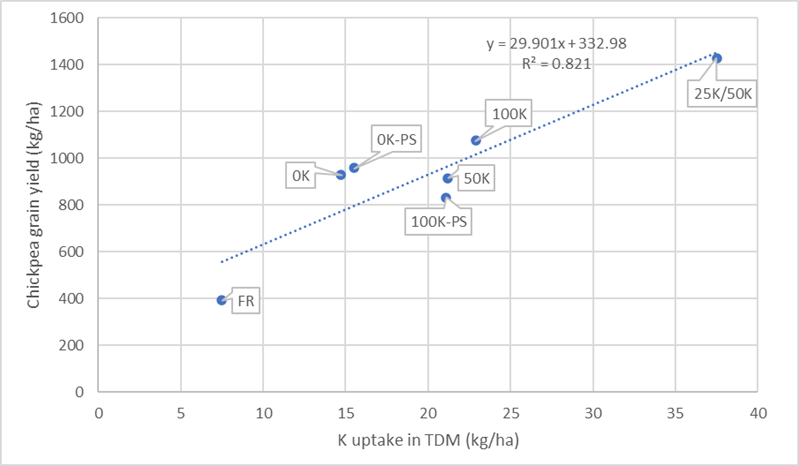
Figure 12. Scatter plot of grain yields versus plant uptake of potassium in total dry matter (TDM)
across selected deep potassium treatments in the 2019 chickpea crop after reapplication.
This is also confirmed by the K uptake data versus grain yield scatter plots (Figure 13), which shows a small improvement in uptake of K from the residual K treatments (~8 kg/ha above the 0K treatment) but not enough to cause any significant yield difference. The uptake data also shows that the difference in uptake of K from the highest residual plot (100K) and the reapplied treatment (25K/50K) is about ~15 kg K/ha which is around one third of the amount that was reapplied (50 kg K/ha). This means that potentially the reapplication could be fully utilised in three seasons and reapplication would be required again.
It is worth noting that the scatter plot data (Figure 13) shows the reapplication results having a linear regression on grain yield versus K uptake. This means maximum yield (Ymax) has not been reached in relation to K uptake. It is possible that if the site had not been water limited, then K uptake from the reapplied treatment bands could have been much higher with subsequently increased yield. This is one of the limitations to making predictions from one set of observations.
The loss mechanisms that occur with K (fixation and absorption) are just as important as those that apply with P, however the mechanisms governing these loss pathways are slightly different. Within vertosols there may be more consistency in the way K is made available in the exchangeable pools. Comparing the K uptake data from the K trials at both trial sites on a scatter graph (Figure 14) shows a more uniform slope in the regression lines. This means that the relationship between yield response and access to K might be more predictable and this could lead to a more reliable prediction of when reapplication will be required.
The caveat on this data is although the slope of the linear regression is similar for the Dysart K trial, we know that this site is P limited first and much of the higher yields expressed in the K trial can be attributed to the background P that was added. This does provide evidence that once the P limitation is met then the K uptake will follow a normal linear relationship with grain yield. Another caveat worth noting, is that in this comparison, the Dululu trial was far more moisture limited which will have had an impact on the overall relationship between uptake of K and grain yield.
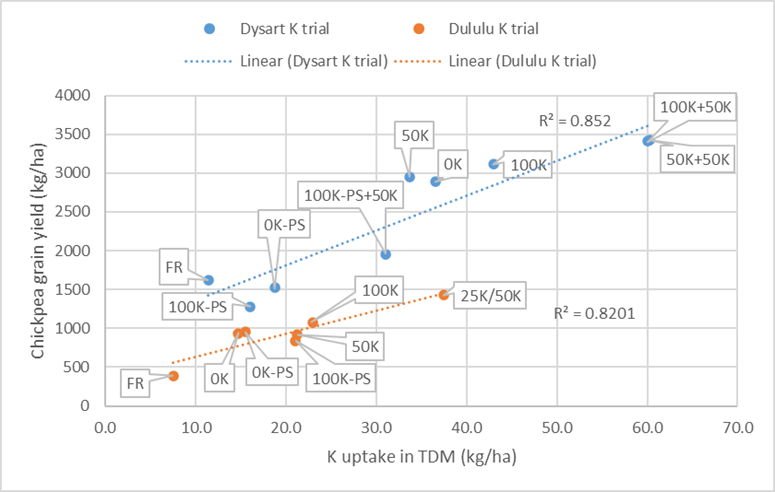
Figure 13. A scatter plot showing the relationship between K uptake in total dry matter (TDM) and
chickpea grain yield in the K trials at Dululu and Dysart sites for 2019 (FR = farmer reference).
While the ability to predict the supply shortfall for K seems to be less complicated than for P, the economic analysis is less clear cut. Gross margin calculations have been done using the 2019 chickpea data from the K trial at the Dululu site (Table 7).
Table 7. Gross margin analysis of selected treatments from Dululu 2019 K trial using current fertiliser prices and prices that are averaged over the last 10 years.
Current prices | |||||
|---|---|---|---|---|---|
Treatment | Grain yield | Revenue | GM | Add Fert cost | GM |
0K | 0.93 | 395 | -65 | 240 | -305 |
50K | 0.92 | 391 | -69 | 240 | -309 |
100K | 1.1 | 468 | 8 | 240 | -233 |
25K+50K | 1.43 | 608 | 148 | 330 | -182 |
10-year average prices (2011-2021) | |||||
Treatment | Grain yield | Revenue | GM | Add Fert cost | GM |
0K | 0.93 | 632 | 172 | 150 | 22 |
50K | 0.92 | 626 | 166 | 150 | 16 |
100K | 1.1 | 748 | 288 | 150 | 138 |
25K+50K | 1.43 | 972 | 512 | 195 | 317 |
The reapplication costs do not have additional N cost included as the analysis is based on a chickpea crop. Current and averaged chickpea prices have also been used in the analysis.
The gross margin analysis (Table 7) shows a net loss on the first crop after reapplication with 50 kg K/ha under present fertiliser and commodity prices. Part of this is that the size of the yield response at this site has been limited by moisture and that makes it difficult to cover the upfront cost of reapplying deep P and K. It is worth noting that the reapplication treatment has made the smallest loss thanks to the increase in yield that it has produced.
The same gross margin analysis done on average prices for the last 10 years (2011 – 2021) shows a positive return in the first year after application (>$300/ha) despite the water limited yield. This result is $179/ha better than the 100K residual treatment. This analysis does not consider the yield advantage of subsequent crops from the reapplication of K. Based on the K uptake data it would be expected that the yield advantage should be maintained for the next two crops at least. If the cost of reapplication can be met in the first crop, then the risk of making a loss on this fertiliser investment is diminished.
Summary
The data from these two trial sites (Dysart and Dululu) on the optimised timing of reapplication of deep banded P and K nutrients, is not sufficient to make an absolute recommendation. The data does present some useful insights between plant uptake of P and K and grain yields.
The severity of the P limitation will have an impact on reapplication. This is linked to whether the P requirements of the plant can be fully met from the one deep banded application. The size of the grain yield response to the deep bands is a useful indicator. Responses that are >20% may suggest that P supply is very restricted, and, in these circumstances, reapplication will have an economic benefit at any time after the first season as extra bands in the soil will create a better supply pool.
When responses to P are more modest (<20%) then potentially the longevity of the one application can be extended before reapplication is required or is economical. There are several caveats to this conclusion.
- Need to make sure that the modest response to P is not due to a limitation to another nutrient like N or K. Chickpeas is a useful diagnostic crop as it removes N from being a limitation to the response from P
- Be aware of seasonal constraints and makes sure the modest response to P is not simply a result of a dry season where the deep P bands where only wetted once and therefore the issue is moisture supply not P supply
- Be aware of the distribution of P in the profile. If there is good supply of P in the surface soil (0-10 cm) and substantial in-crop rainfall, then the response to deep bands will be more moderate
- Be aware that not all vertosols fix or absorb P at the same rate. The longer the bands of P are in the ground, the greater the potential for precipitation as insoluble calcium phosphates. This may lead to more modest responses to the deep P bands.
A simple diagnostic tool that could be used to help growers understand when timing of reapplication is getting close, is to include a ‘double rate’ and missed strip when doing the first deep application. Initially the difference in grain yields between the single application and the double application will be similar in the first 2-3 seasons. When these two treatments start to diverge significantly in grain yield, this might be indicating that the P uptake might be getting more difficult from those bands and a fresh reapplication will produce an economic yield response.
Test strips in the paddock will also be useful for soils that are very low in K. The same caveats apply to K uptake as they do for P, however paying attention to how much K is being taken up by the plant is also useful and whether K is the major limiting nutrient. Data from the Dululu trial suggests that the deep K bands could be exhausted within 3 - 4 crops from a 100K band, therefore reapplication for a K limited site will need to be within this time frame.
While fixation and absorption are not easy to predict in K limited soils, a double up strip in the paddock could provide some useful indication of when the effectiveness of the deep bands are starting to become compromised (by fixation or absorption) or exhausted.
The economics of reapplication can be viewed in two ways. Firstly, if the site is responsive to P or K, then the improved crop returns post the initial application have not only paid for the first application but also the reapplication.
Secondly if the site has proven to be responsive to P or K then the data extracted from both the Dysart and Dululu sites suggest that reapplication will create significant extra grain yield even if reimbursement of money outlaid is not guaranteed in the first crop after reapplication under a higher cost scenario. While there was no data collected from these sites in relation to subsequent crops after the first year of reapplication, it is expected that these reapplication treatments will continue to lead to improved grain yields and gross margins.
References
Sands D, Bell M and Lester D (2020). Fine tuning deep phosphorus and potassium management. GRDC Updates Webinar series (Nov 19, 2020).
Raymond N, Kopittke P, van der Bom F, Lester D, Wang E and Bell M (2022) Phosphorus dynamics in Vertosols: improving fertilizer management. Proceedings of the 20th Agronomy Australia Conference, 2022.
Acknowledgements
The research undertaken as part of this project is made possible by the significant contributions of growers through both trial cooperation and the support of the GRDC, the author would like to thank them for their continued support.
Contact details
Doug Sands
Queensland Department of Agriculture and Fisheries
99 Hospital Road, Emerald
Ph: 07 4991 0811
Email: douglas.sands@daf.qld.gov.au
® Registered Trademark
Varieties displaying this symbol beside them are protected under the Plant Breeders Rights Act 1994
GRDC Project Code: UOQ1207-001RTX,
