Modifying farming systems in northern grains region – legacies, profit and risk of pulse and nitrogen strategies
Author: Jon Baird (NSW DPI), Kathi Hertel (NSW DPI), Lindsay Bell (CSIRO), Jayne Gentry (DAF Qld), Andrew Erbacher (DAF Qld), Darren Aisthorpe (DAF Qld), David Lawrence (DAF Qld), Branko Duric (NSW DPI), David Lester (DAF Qld) | Date: 22 Feb 2023
Take home message
- Applying N fertiliser rates targeting high yields boosted long-term system productivity at three of the research sites compared to fertilising for a median crop yield
- 'Banking' soil N via a robust fertiliser N strategy can maintain higher soil N levels and reduce reliance on tactical fertiliser applications
- Over the long term, the profitability of systems growing 50% legumes can be equal or higher than current district Baseline systems
- Farming systems containing a high frequency of legume crops do not necessarily reduce fertiliser N use
- While legumes can provide inputs of N via fixation from the atmosphere, they can extract soil mineral N if it is available, similar to non-legume crops
- High yielding legumes will export N at a far higher rate than similar yielding cereals, often negating any N they have fixed
- Long term, soil mineral N reserves and system N balances are declining regardless of different farming system strategies, except where high N replacement has been applied
- Crops are more efficient at sourcing N from soil sources than applied fertiliser, so soil monitoring is essential to determine fertility levels to match crop requirements, and adjust for possible losses and trends over time.
Introduction
Long-term sustainability and profitability of farming systems need to evolve to manage the challenges of climate variability, increasing soil-borne pathogens, herbicide resistance and problem weeds, and declining soil fertility and increasing reliance on costly fertiliser inputs. A major challenge for our farming systems is to match crop nutrient supply and demand under variable growing conditions and maintain our soil's underlying fertility in the long-term. The northern farming systems project is looking at the long-term implications of different fertiliser application strategies and using more legumes in the farming system.
Nationally, legume (pulse) crops represent just 10% of the total cropping area (Pulse Australia 2023), with winter species dominating the pulse crop area in the northern cropping region. Legume crops both fix nitrogen (N) (via rhizobia symbiosis) and remove N from the system (via plant residues and grain). This creates a different dynamic to the overall farming system compared to that of non-legume crops. Given that N is a major variable cost in most farming systems with heavy reliance on off-farm sources (primarily urea), the effect of legumes on subsequent crops' N requirements, performance, and soil N balance can be significant. Understanding these impacts together with the legume crop profitability and risk are key to improving the future sustainability and profitability of farming systems.
The northern farming systems research project commenced in 2015 with long-term experiments at seven locations: a core experimental site comparing 38 farming systems at Pampas near Toowoomba, and a further six regional sites that included 6−9 locally relevant farming systems at Emerald, Billa Billa and Mungindi in Queensland and Narrabri, Spring Ridge and Trangie covering red and grey soils in NSW.
This paper will focus on three core farming systems treatments implemented across the experimental sites: the local regional ‘Baseline’ or current best management system, and systems with modified strategies which increase N fertiliser rates and legume crop frequency across the crop system.
- Baseline – derived to represent local best management practice where the selection of crops and their management were designed in partnership with local grower panels and analysed as the control treatment. Crops were planted at or above soil moisture of 50% plant available water (PAW) and fertiliser N and phosphorus (P) rates were applied to meet the demand of a 50th percentile crop yield.
- Higher nutrient system — contains identical crop sequence to Baseline but with higher N and P fertiliser rates applied to meet the demands of a 90th percentile crop yield.
- Higher legume system where at least 50% of planted crops are legumes, crops were planted at or above 50% PAW. Legume crops did not have N fertiliser applied and P fertiliser rates were calculated to meet export rates, and fertiliser N and P rates were applied to meet the demand of a 50th percentile crop yield for non-leguminous crop.
Over the seven years of the project (2015 to 2021), seasonal conditions at regional experiment sites have varied, including extremes of drought and local flooding, as well as 'average' and 'favourable' seasons.
Results
Grain productivity
High nutrient strategy
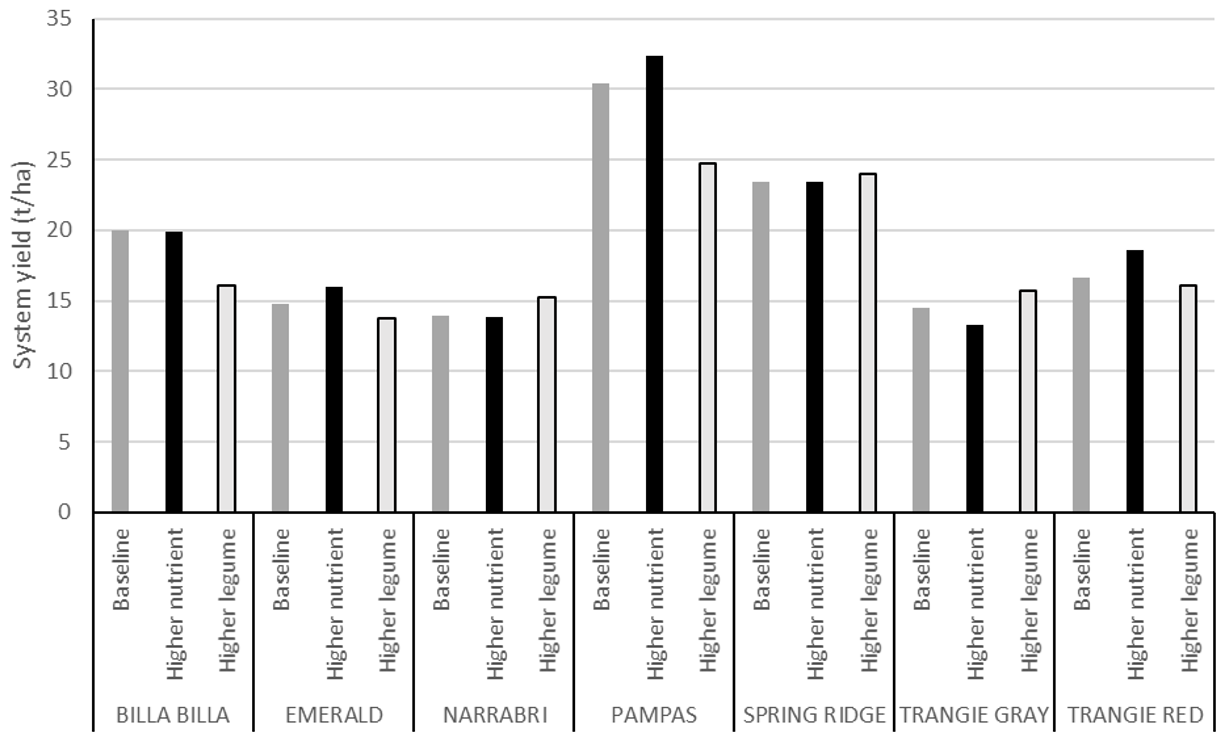
Applying the higher fertiliser rates strategy across seasons maintained higher residual N levels in the soil. The legacy of this higher soil fertility within the system provided a strong foundation for future crops to optimise production especially in average or above average rainfall seasons. At three of the seven regional sites, applying additional fertiliser in the Higher nutrient system increased grain productivity compared to the Baseline system. At these sites grain production was increased on average by half a tonne per hectare over the seven seasons (Figure 1). At other sites there was no positive response to the additional N applied, because the drier than average seasonal conditions meant that crop demand did not exceed supply provided in the Baseline, and hence the additional N was not required.
At one site (Trangie grey soil), grain yield was lower in the Higher nutrient system compared to the Baseline. In this example a lower yield was obtained in one crop year and in other crop years seasonal conditions were not favourable to take advantage of the extra soil N.
High legume frequency
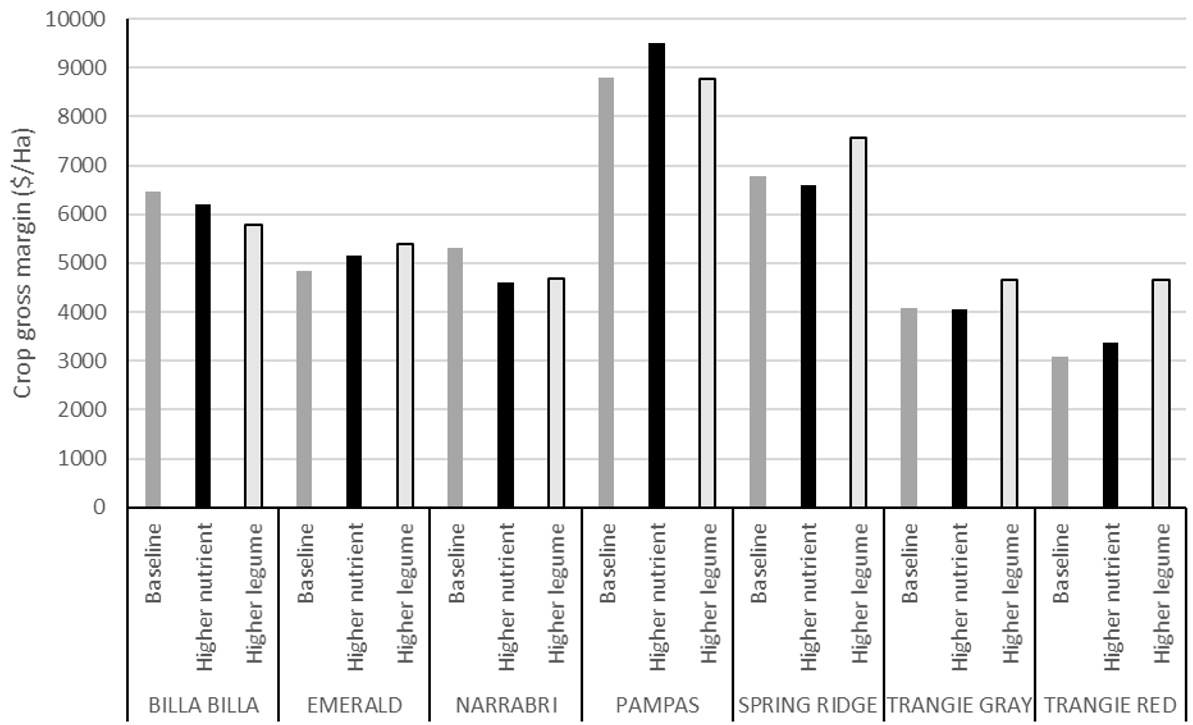
Recently there has been increased plantings of grain legumes in cropping systems, driven in part by the profitable prices for pulses but also goals to reduce N fertiliser use and potentially improve soil health/fertility. The addition of legumes to the farming system had little to no influence on productivity over the seven years at most sites. However, we identified variability and a higher risk with the adoption of legumes as two sites – Pampas and Billa Billa which had lower system grain yield than the Baseline system. Grain legumes often produce lower yields than cereals but many have higher prices per tonne and hence, the economic outcome may look quite different to non-leguminous crops (Figure 2).
Figure 1. Grain production (t/ha) in the Baseline, Higher nutrient, and Higher legume systems over 7 years (2015−2021) at long-term farming systems experiments.
System Economics - profit/loss
Economic analysis of the farming systems was conducted using 10-year average grain prices (2011-2020) and general input/machinery/processing costs. System gross margins from the last six seasons show that while current growers' practices are performing well in their regions, several sites have improved returns by incorporating more legumes or applying more fertiliser for higher yield production (Figure 2).
High legume frequency
Over the 7 years, the Higher legume systems produced higher or equal returns at 5 of the 7 sites compared to the Baseline, while there was a small penalty ($500/ha) at 2 sites. For example, at the Spring Ridge and the Trangie red soil site, systems gross margins were >$1000/ha in the Higher legume system compared to the Baseline system (Figure 2). The higher gross margins are related to the higher grain value of legumes over this period. However, recently experience shows these high values can be variable; therefore, this advantage can disappear, reducing the profitability of growing legume crops. Growers should be aware of current grain prices and understand the often-higher input costs associated with high-yielding legumes.
High nutrient strategy
At only 3 of the 7 sites was there a benefit of growing higher grain yield with additional fertiliser application. Higher fertiliser input generated a greater cost to the Higher nutrient system, reducing long-term system profitability at the other sites where there was no grain yield response to the additional N applied. This analysis does not consider the value of N 'banked' in the soil. However, even with the added value, there were deficits to the gross margin compared to the Baseline system (Bell et al. 2022). Nonetheless, the cost of this high nutrient strategy is relatively small, equating to around $20/ha/yr. compared to the upside that can be achieved when seasonal conditions are positive.
Figure 2. Cumulative crop gross margins over 7 years (excl. fallow costs) of the modified farming systems with additional fertiliser input and legume crops (2015−2021).
Legacy effects of legumes on crop yields and nitrogen use of following cereals
A closer investigation into the legacy of legumes in a farming system was conducted by examining particular crops and short-term sequences within the various systems across our experiments. Table 1 shows the grain yield and crop N use of subsequent crops grown after either a winter legume or non-legume crop. In addition, it highlights comparisons where the same crops were grown after a legume or cereal with similar moisture and fertiliser application rules.
Of the 7 comparisons, only 2 occasions saw an observable yield benefit following legumes compared to a non-legume crop. On all but one occasion the crop following the legumes also received a similar N application to meet the N budget predicted for that crop in that season. Typically crops grown after a legume crop had higher N use (i.e., the change in mineral N between sowing and harvesting plus applied fertiliser N). This was due to sourcing more N from the soil mineral pool and N derived from the legume's N fixation activity rather than applying higher fertiliser N rates.
Table 1. Legume crop influence on the following crop yield, N applied and used (applied fertiliser plus the change in soil mineral N) across various comparisons in farming systems experiments.
Site | Season | Crop | Previous crop | Grain yield | Applied N fertiliser | Crop N use |
|---|---|---|---|---|---|---|
| 2017 | Wheat | Chickpea | 2.4 | 76 | 129 |
Fababean | 2.2 | 76 | 112 | |||
Canola | 2.0 | 76 | 79 | |||
| 2017 | Wheat | Chickpea | 3.2 | 52 | 152 |
Fababean | 3.2 | 52 | 123 | |||
2020 | Wheat | Chickpea | 4.8 | 27 | 139 | |
Canola | 4.9 | 96 | 107 | |||
| 2018 | Barley | Wheat | 0.4 | 9 | 9 |
Chickpea | 0.1 | 9 | 9 | |||
2020 | Wheat | Canola | 2.0 | 9 | 157 | |
Fababean | 4.3 | 11 | 269 | |||
| 2017 | Wheat | Chickpea | 1.8 | 26 | 93 |
Wheat | 1.6 | 26 | 43 | |||
2020 | Wheat | Chickpea | 1.8 | - | 45 | |
Wheat | 2.2 | - | 9 |
Farming system influence on fertiliser N input requirements
Current fertiliser prices are at record levels, so improving fertiliser recovery and efficiency is crucial to maximising growers' return on investment. Here we examine the degree that different farming systems have altered the N inputs required and the balance of N applied and exported over the 7 experimental years.
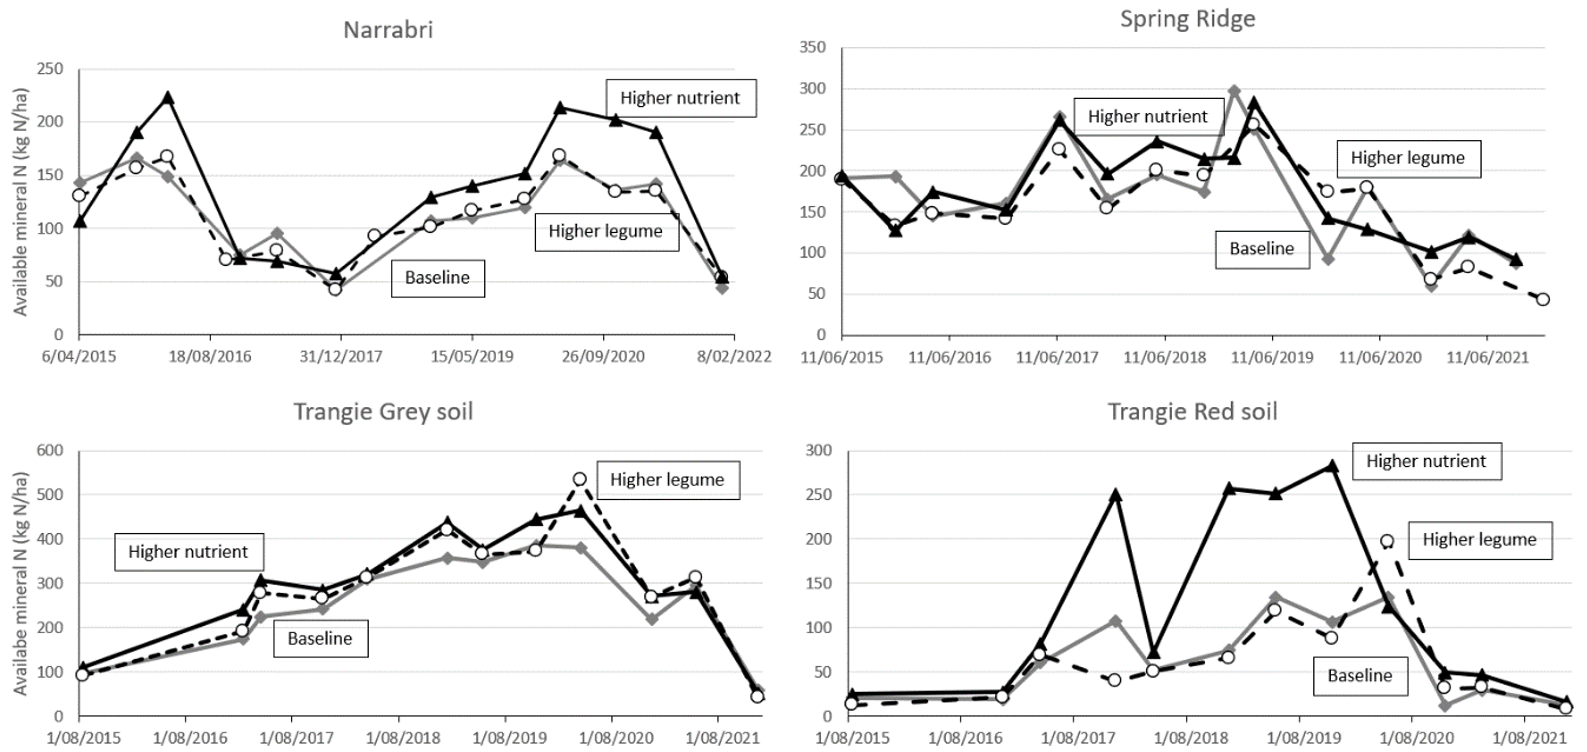
One aspect of the Higher legume system was to investigate whether additional legumes will maintain or improve soil fertility while at the same time reducing fertiliser input over the long term. At most sites, there was little if any change in the total fertiliser N required in the Higher legume system compared to the Baseline (Table 2).On average across all sites the Higher legume systems required 45 kg N/ha less over the 6 years than the Baseline (i.e. only 8kg N/ha/yr. less). This was because the legumes exported much more N from the system (Table 2), and this meant that there was little additional N cycled to offset subsequent N applications in non-legume crops. Spring Ridge is one site where the application of fertiliser input (N fertiliser) was significantly reduced under the Higher legume system compared to the Baseline system. This showed a potential saving in fertiliser use by growing more legumes in this region. However, soil N has also been extensively used during the same period (Figure 3), and therefore, growers need to monitor their soil nutrients to ensure native soil nitrogen use is not detrimental to long-term soil fertility.
A common theme across most farming system sites is that applying the higher fertiliser strategy clearly required additional N inputs (ranging from an additional 6 to 260 kg N/ha over the 6 years). However, the surplus N unused was retained in the soil and so maintained higher mineral N levels in the soil than the Baseline system – much of the additional N that was applied was retained and was available to offset N applications in subsequent crops (Figure 3). Maintaining a higher system N status via N banking is a potential management practice in northern farming systems to ensure greater yields can be achieved in high decile seasons. Lester et al (2021) found that fertiliser recovery can be improved when nitrogen is applied early in the fallow, and there is improved logistics for growers when they fertilise during lower labour demand period rather than at sowing or during the growing season. One implication growers need to be aware of when they apply fertiliser early in a fallow period, is the potential losses that may occur during the fallow, before the crop can utilise the N. For example, a severe weather event at Spring Ridge caused high mineral N loss in late 2019 when Baseline and Higher nutrient systems were in a fallow period and losses ranged between 203 and 152 kg N/ha (Figure 3).
Table 2. Fertiliser N applied and grain N exported from Baseline, High nutrient and High legume systems across 6 farming systems sites over 7 experimental years (2015-2021).
Location | Fertiliser N applied (kg N/ha) | Exported N (kg N/ha) | ||||
|---|---|---|---|---|---|---|
Baseline | Higher nutrient | Higher legume | Baseline | Higher nutrient | Higher legume | |
Billa Billa | 18 | 77 | 23 | 417 | 451 | 430 |
Emerald | 49 | 55 | 11 | 330 | 347 | 335 |
Narrabri | 206 | 447 | 208 | 345 | 350 | 468 |
Pampas | 155 | 337 | 80 | 498 | 538 | 556 |
Spring Ridge | 307 | 446 | 146 | 482 | 496 | 450 |
Trangie Grey | 63 | 169 | 89 | 235 | 287 | 322 |
Trangie Red | 137 | 395 | 105 | 263 | 344 | 300 |
Figure 3. Mineral nitrogen long-term dynamics at Farming system sites in Northern NSW. The grey line and diamond marker are Baseline system, Black line and triangle is the Higher nutrient system, and the dashed line with open circle is the Higher legume system. Note y axis scale varies at each site.
Source of crop N use
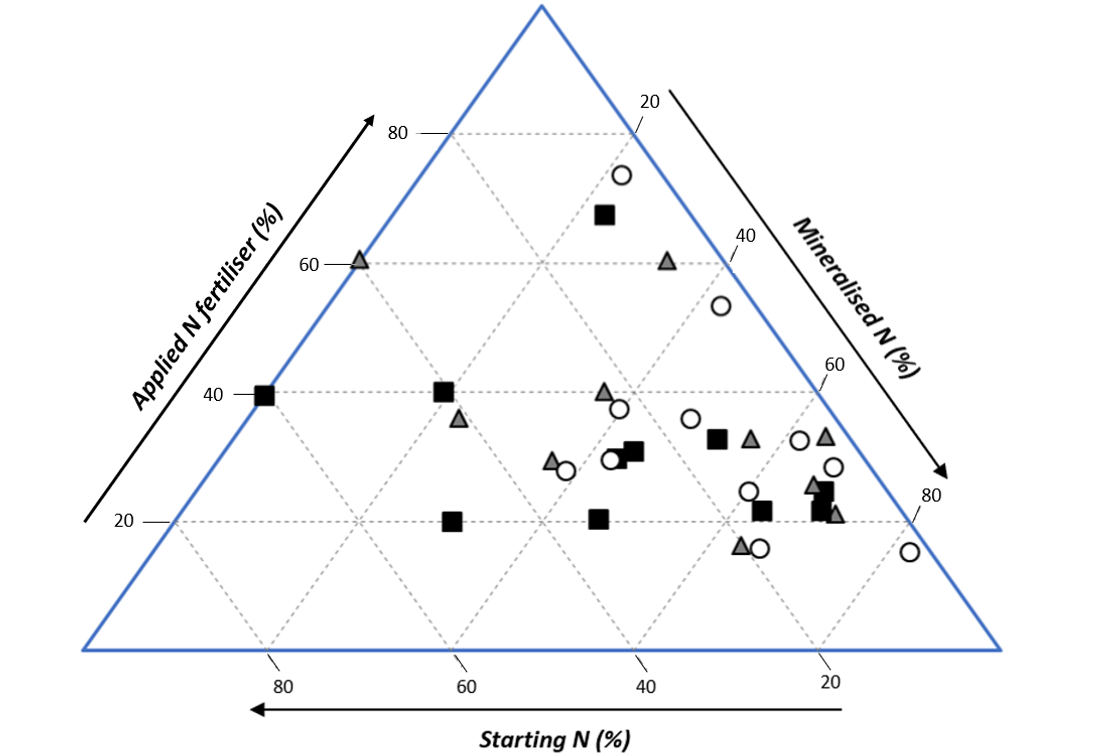
For the three modified cropping systems across the seven experimental sites – Baseline (triangle), Higher nutrient (square) and Higher legume (circle), Figure 4 illustrates the source of N in terms of the percentage of the crop N used. The source of N is calculated over the experimental period (2015-2021) for the proportion that was derived from either the starting soil mineral pool (i.e., the change in soil mineral N between the start and end of our sequence), applied fertiliser or was mineralised from the soil (i.e., N accumulated during a fallow or the balance of crop uptake not from fertiliser or soil mineral pools).
The study highlights the importance of cropping systems' efficiency in utilising N from stored organic sources. Most systems and experimental sites sourced at least 40% N from mineralised organic or stored N (spared N) rather than drawing down from starting N levels. This data supports findings from Daniel et al. (2019) where the efficiency of N grain recovery from soil N sources was ≈4 times greater than that of applied fertiliser N.
As stated before, incorporating more legumes resulted in crops utilising more N from mineralised N, attributable to the faster breakdown of legume residues that can be used in subsequent crops. This meant there is generally a lower reliance on using background N (starting N) and synthetic fertilisers.
Figure 4. The source of N used by modified systems as a percentage of crop use. Baseline is grey triangles; Higher nutrient is black squares and Higher legumes is white circles. The dotted lines represent 20% levels of percentage for each N source.
Effect of crop choice on nitrogen export from a farming system
Previous reports from the Northern Farming Systems project have shown there is minor to no reduction in fertiliser application when legume crop frequencies were increased (Baird et al. 2019). This paper has shown that legumes increase cropping systems' N balance compared to cereals, with the majority of N sourced from increased cycling of N.
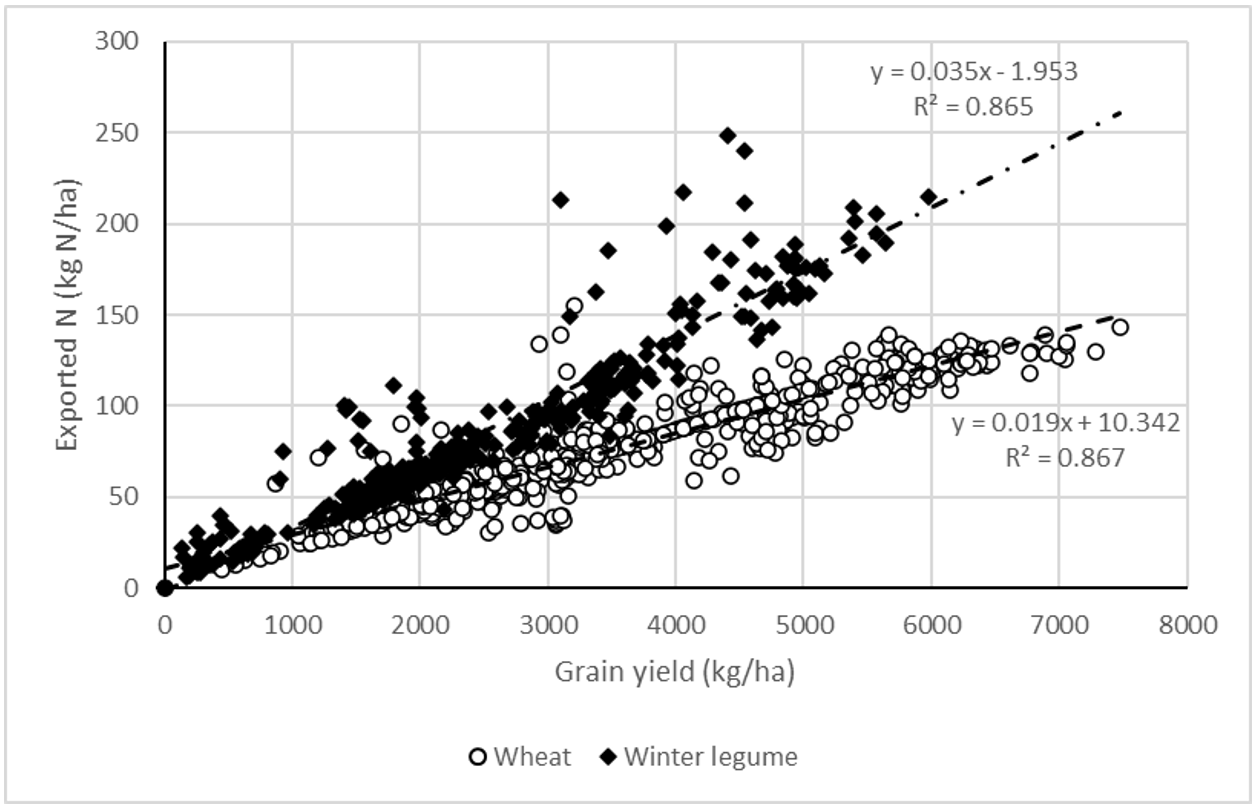
Crop N export rates help us understand the gap between system N balance and fertiliser input between legumes and cereals. High yielding legumes with a high harvest index will export N at a far higher rate than similar yielding cereals (Figure 5). The N export rate is significantly different for yields above 2.5 t/ha. For example, a legume crop yielding 5 t/ha will on average export 174 kg N/ha while wheat will export 110 kg N/ha.
Therefore, farming systems implementing more legumes should be mindful of the high use (and cycling) of N. It's recommended that growers monitor their soil N levels to ensure their systems won't be yield limited due to low soil N which may happen if a high loss event occurs. Knowing the current soil N status is always useful, rather than assuming that legumes will have left or contribute additional N to subsequent crops. The high N removal and potential to extract mineral N may in fact mean that legumes have little or no direct benefit or on occasion lower mineral N than following non-legume crops. The N balance outcome is largely dependent upon the grain yield (amount of N exported kg/ha) and peak biomass of the legume crop (directly related to the amount of N fixed kg/ha).
Figure 5. Crop export rates of wheat and winter legumes (including chickpea, fababean and field pea) from the farming system project (2015−2021).
Conclusion
Modifying farming systems can provide growers with potential improvements in yield and gross margins, but legacies need to be monitored as every system will have pros and cons. For example, adopting a system with a higher frequency of legumes will increase N cycling, but the system has higher export rates of N which ultimately result in no net benefit for N balance or a large offset of fertiliser N requirements.
Systems that include high application rates of N fertiliser maintain higher levels of background N, but this practice may not be economically viable at today's fertiliser prices and a positive return on investment is contingent on receiving favourable climatic conditions when the crop can convert the additional N supply into higher grain yields.
Acknowledgements
We thank the local growers and consultants who have actively supported and continue to contribute towards this project. We also thank the Grains Research and Development Corporation, the Department of Primary Industries in New South Wales, the Department of Agriculture and Fisheries in Queensland, and the CSIRO who have supported this long-term project.
References
Baird J, Gentry J, Lawrence D, Bell L, Aisthorpe D, Brooke G, Erbacher A, Verrell A, Zull A and Klepper K (2019). The impact different farming systems have on soil nitrogen, phosphorus and potassium.
Bell L, Baird J, Lawrence D, Lester D, Gentry J, Aisthorpe D, Erbacher A, Hertel K and Anderson B (2022). Farming system nutrient legacies – impacts of N strategies on N inputs, cycling and recovery over multiple years.
Daniel R, Norton R, Mitchell A, Bailey L, Kilby D, Duric B and Price L (2019). 5 years of nitrogen research – have we got the system right?
Lester D, Bell M, Sands D (2021). (Possible) Nitrogen strategies, application timing and surface spreading in CQ (or," things I know that I don't know").
Pulse Australia (2023)
Contact details
Jon Baird
NSW DPI – Australian Cotton Research Institute
21888 Kamilaroi Hwy, Narrabri 2390 NSW
Ph: 0429 136 581
Email: jon.baird@dpi.nsw.gov.au
Kathi Hertel
NSW DPI – Trangie Agricultural Research Centre
7878 Mitchell Highway, Trangie 2823 NSW
Ph: 0427 104 344
Email: kathi.hertel@dpi.nsw.gov.au
Date published: February 2023
GRDC Project Code: DAQ1406-003RTX, CSP1406-007RTX, DAQ2007-004RMX,
Was this page helpful?
YOUR FEEDBACK

