Profitable low-emission crop rotations?
Profitable low-emission crop rotations?
Author: Sud Kharel, Christophe d’Abbadie, Amir Abadi, Ross Kingwell | Date: 27 Feb 2023
Key Messages
- In some southern WA grainbelt regions it is feasible to alter crop rotation selection while maintaining farm profitability and reducing agricultural GHG emissions.
- In the northern WA grainbelt, shifting into crop-based rotations increases profitability while decreasing agricultural GHG emissions.
- Research and innovation in low-emission fertilisers and anti-methanogenic feeds or pastures will help further reduce agricultural emissions.
Introduction
In Australia, various agricultural organisations and regional governments have announced plans to achieve carbon neutrality over the next few decades like Meat and Livestock Australia’s Carbon Neutral 2030 plans (MLA CN30) (Meat and Livestock Australia, 2020). Agriculture contributes about 13% of Australia’s greenhouse gas (GHG) emissions each year, with 42% of these emissions being methane generated primarily by ruminants via fermentation of plant matter in their rumens (Climate Council, 2021). Other emissions come from sources such as nitrogenous fertilisers, lime, manures, and decaying crop and pasture residues. Effective anti-methanogenic feed supplements are being developed and may eventually be widely adopted, helping to lower emissions from ruminant animals in Australia's sheep, beef and dairy industries.
To reach carbon neutrality, Australian agriculture needs to cost-effectively reduce or offset its net emissions over the next few decades. This will include activities such as increasing soil carbon levels, reforestation or revegetation, use of anti-methanogenic (methane-reducing) supplements, and shrubs, adopting energy-efficient farm practices including variable fertiliser application technologies and increasing the proportion of electricity use from renewable sources.
Spatial analyses of emissions from Australian agriculture are rare. One exception is Kingwell (2021) who provided an overview of shire-level agricultural emissions in the Western Australian grainbelt and examined how targeted sequestration could cost-effectively allow the region's agriculture to become carbon neutral. However, the study overlooked the important role that changes to farming systems can play in reducing emissions and also only considered Scope 1 emissions. The study reported here aimed to address these deficiencies by exploring where and how changes in farming systems across the WA grainbelt can cost-effectively reduce Scope 1 emissions (emissions from farm activities), Scope 2 emissions (emissions from the production of electricity used on farms) and Scope 3 emissions (emissions from the production of inputs used on farms) (Ekonomou and Eckard, 2022). Due to limited space, the results in this paper discuss only Scope 1 emissions. Please refer to Kharel (2022) for more details on Scope 3 emissions.
Method
Eighteen locations across the WA grainbelt were used to represent the region’s geographic, edaphic and climatic diversity. Production inputs, crop types and yields, stocking rates, input costs, product returns and emission profiles for each location are described in detail in Kharel et al (2022). All rotation data and associated biological relationships were embedded in a Microsoft Excel® time series VBA model called EVALUS. The construction of the model involved a team of subject matter experts collaborating to parametrise and structure the model.
Economic Valuation of Alternative Land Use Sequence model (EVALUS)
EVALUS is a model designed to capture the biology and financial characteristics of commonly observed land use sequences, their associated Scope 1, 2 and 3 emissions, and yields of crops and pastures. EVALUS uses a modified French and Schultz model (French and Schultz, 1984) that draws on soil information and estimates of rainfall, based on historical records, at each location. Further information about EVALUS can be found in Kharel et al (2022).
GHG emissions associated with any selected land use sequence are based on the PICCC’s (Primary Industries Climate Change Centre) Sheep and Beef GHG Accounting Framework (SB GAF) and the Cropping GHG Accounting Framework (C GAF). See Ekonomou and Eckard (2022) for further detail.
Results
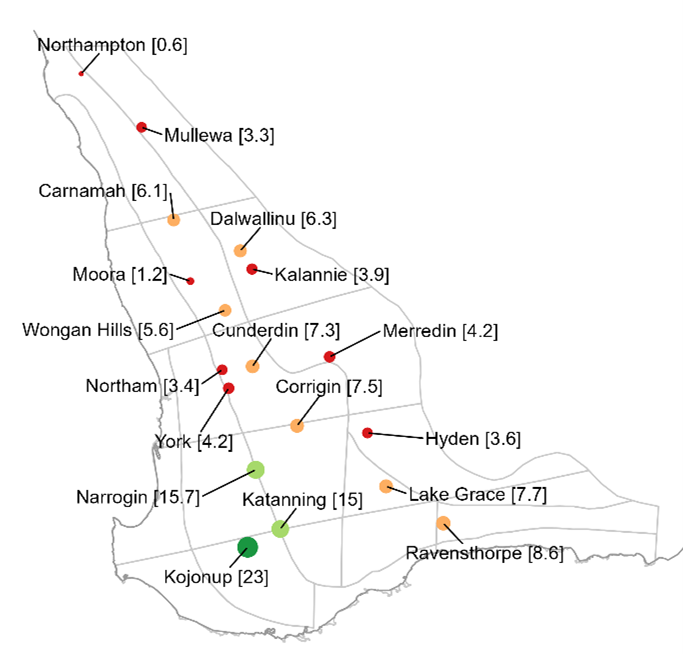
Rotational land use sequences were assessed at 18 locations for their net margins (gross margins minus fixed costs) and GHG emissions (Scope 1, 2 and 3). At all locations in the northern agricultural region, net margins declined with a 1% increase in the pasture proportion of the land use sequence, while in all other southern agricultural regions, net margins increased with a 1% increase in the pasture proportion of the land use sequence. This response pattern reflects agro-ecological differences, where northern parts of the study region are warmer with shorter growing seasons that favour crop production over pasture-based sheep production. While in the southern parts of the study region, pasture-based sheep production plays a larger role in farming systems. As a result, crop-dominant farming systems are more prevalent in the northern region whereas pasture-based sheep production is relatively more important in the more southern areas. Therefore, net margins increase when the pasture proportion of land use sequences increases in the more southerly locations.
 |  |
|---|---|
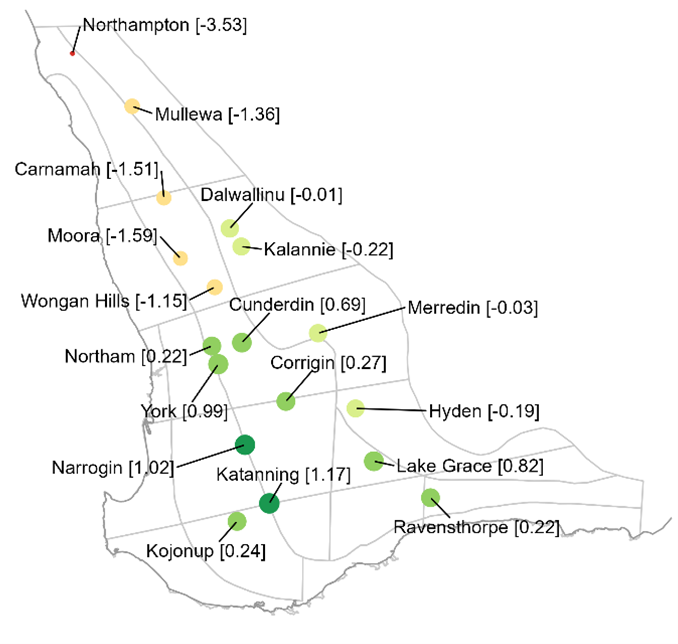
Figure 1. Changes of net margin per percent change in pasture percentage. Numbers displayed represent the change in annual net margin ($/year) per 1% increase in the pasture. | Figure 2. Changes of scope 1 emissions per percentage change in pasture percentage. Numbers displayed represent the change in scope 1 emissions (kgCO2e/year) per 1% increase in the pasture. |
Results in Figure 1 are derived from a fitted linear relationship between net margins of land use sequences and the percentage of pasture in those land use sequences. However, as demonstrated in Kharel et al (2022), the response relationship can be curvilinear, meaning that the results in Figure 1 do not fully convey the complexity of the interaction between net margins of land use sequences and the percentage of pasture at all locations.
Figure 2 lists the slope of fitted linear equations for each location revealing the change in scope 1 emissions per percentage change in the pasture proportion of land use sequences. The locational results mirror agroecological differences where higher rainfall, cooler and longer growing season environments favour pasture-based, high stocking rate sheep farming. Locations in these environments (e.g., Kojonup, Narrogin and Katanning) generate high rates of Scope 1 emissions for each additional percentage increase in land allocated to pasture production. By contrast, in drier environments that support sheep production at lower stocking rates, lower rates of Scope 1 emissions are observed for each additional percentage increase in land allocated to pasture production.
These results reveal there can be a diversity of land use sequences across a broad agricultural region, and the pattern and magnitude of emissions that accompany those land use sequences can be very different. The responsiveness of the emissions profile at different locations to small changes in land use sequences can also differ.
 |  |
|---|---|
| (a) | (b) |
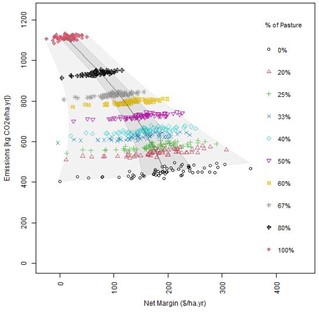
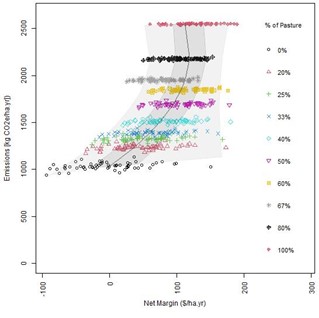
Figure 3. Scope 1 emissions and net margins at Carnamah (a) and Narrogin (b) for land use sequences that contain different proportions of pasture; all subject to weather-year and price variations
The study also reports the variability in net margins at each location as the pasture percentage of land use changes, with resultant impacts on emissions (Figure 3). For example, Figure. 3a displays land use sequences at Carnamah ranked by percentage of pasture and shows emissions and net margins as generated by 60 randomised price and weather-year sequences. In Figures 3a and 3b the light grey shaded areas represent the first and fourth quartiles of the distribution of net margins. The darker grey shaded areas show quartiles 2 and 3 of the distribution of net margins and the dark line is the locus of median values of the net margin.
The results in Figure 3a show that as the percentage of pasture in land use sequences increases, Scope 1 emissions also increase. However, the median net margin increases as the percentage of pasture in land use sequences decreases, but the response is slightly curvilinear. The volatility of the net margin also increases. Increased volatility is unattractive to risk-averse farmers. However, at Narrogin (Figure 3b) net margins and emissions tend to increase as the percentage of pasture in land use sequences increases, and the volatility of the net margin decreases. Reducing emissions at such locations will be challenging, as it will require the development of low-emission technologies to support profitable sheep production or the development of more profitable crops or alternate farming systems less dependent on sheep production.
Caveats
This paper presents modelling results that reveal locational differences in the relative profitability of land use sequences and their associated emissions profiles. These findings, however, may not apply to every farm at each location due to differences in farm resources and preferences. The findings also ignore potential innovative land management practices that could have different emissions and profitability profiles.
Conclusion
Crop-dominant land use sequences are found to be most profitable in the northern parts of the WA grainbelt, while pasture-based sheep production is more profitable in southern parts. However, a handful of locations display no strong profit preference for particular crop or annual legume-based pasture dominant land use. Research and innovation to reduce emissions, such as manufacturing low-emission fertilisers and developing anti-methanogenic feeds, are likely to be increasingly worthwhile. Additionally, at some locations, it may be feasible to alter land use sequences and yet maintain farm profitability while simultaneously reducing emissions.
Acknowledgements
This research was partly funded by the MLA funded SheepLinks: Climate adaptation to ensure a sustainable WA Sheep industry.
References
Climate Council, 2021. Agriculture’s contribution to Australia’s greenhouse gas emissions. Available at: https://www.climatecouncil.org.au/resources/australia-agriculture-climate-change-emissions-methane/.
Ekonomou, A., Eckard, R.J., 2022. A Greenhouse Accounting Framework for crop production (G-GAF) based on the Australian National Greenhouse Gas Inventory methodology. Updated April 2022. http://www.piccc.org.au/resources/Tools.
French, R.J., Schultz, J.E., 1984. Water use efficiency of wheat in a Mediterranean- type environment. I. the relation between yield, water use and climate. Aust. J. Agric. Res. 35, 743–764.
Kharel, S., d'Abbadie, C., Abadi, A., & Kingwell, R. 2022. Reducing farming system emissions via spatial application of payoff functions. Agricultural Systems, 203, 103534. https://doi.org/10.1016/j.agsy.2022.103534
Kingwell, R., 2021. Agriculture’s carbon neutral challenge: the case of Western Australia. Australian Journal of Agricultural and Resource Economics. https://doi.org/10.1111/1467-8489.12440, 2021 (early view).
Meat and Livestock Australia., 2020. The Australian Red Meat Industry’s Carbon Neutral by 2030 Roadmap. https://updates.mla.com.au/globalassets/mla-corporate/research-and-development/program-areas/environment-and-sustainability/2689-mla-cn30-roadmap_d3.pdf
Contact
Sud Kharel
Research Scientist
DPIRD, 1 Nash Street, Perth
Email: sud.kharel@dpird.wa.gov.au
