Managing heavy stubble loads without compromising the “big things” – weeds, disease, pests, timeliness and profit! Experience from a decade of farming systems experiments.
Take home messages
- Don’t let stubble compromise the BIG THINGS - weeds, disease, pests and timeliness
- Be flexible and pro-actively manage stubble for your seeding system!
- Harvest high = reduced costs and is quicker
- N tie-up can reduce cereal yield in modern stubble retain farm systems
- Cereal stubble should be thought of as a source of carbon (C), not nitrogen (N) (<6% crop N needs met from straw)
- 2 - 3 t/ha of stubble = 70% ground cover, enough for erosion control and water infiltration
- Post-harvest management: if necessary, reduce stubble load by mulching, incorporation + nutrients, baling, grazing or late strategic burn (especially before second wheat crop or if sowing canola into large stubbles)
- Managing N at sowing: deep band N and add 5 kg N/t cereal stubble to reduce N tie-up
- Diversify your crop sequence and add legumes to rotation.
Background
Following a GRDC review that identified gaps regarding the impact of stubble retention in southern cropping systems, a five-year program was initiated by GRDC in 2013. Ten projects comprising 16 farming systems groups and research organisations which included BCG, CSIRO, CWFS, EPARF, Farmlink Research, Hart Field Site group, ICC, LEADA, MFMG, MSF, Riverine Plains, SARDI, UNFS, VNTFA, and Yeruga Crop Research were involved in exploring the issues that impact the profitability of retaining stubbles across a range of environments in southern Australia.
Previous studies have highlighted potential negative yield impacts of retained stubble in SNSW (Kirkegaard 1995; Scott et al. 2013), but strict no-till advocates recommend retaining all of the stubble to enhance water capture and storage, ‘soil health’ and crop yields. Over the past decade, farmers and scientists have continued to examine methods to flexibly manage stubble to improve profitability, including the use of zero till (disc seeders), diversified crop sequences, supplemental nitrogen (N) and new herbicide options.
In this paper, we consider the questions farmers and advisers ask when managing stubble using a flexible approach. We then summarise some of the main issues that farmers need to deal with when trying to retain stubble in their farming systems. More in-depth information and explanations on experiments, methodologies and results can be found in the reading list and GRDC website (see References).
We would also like to acknowledge the many co-authors who contributed to two previous GRDC update papers, Swan et al (2017a) and Kirkegaard et al (2018). Large sections of those papers have been reproduced here and involved Paul Breust, Claire Brown, Amanda Cook, Blake Gontar, Clive Kirkby, Helen McMillian, Michael Nash, Sarah Noack, Trent Potter, Cassandra Schefe, Naomi Scholz and Felicity Turner.
Managing stubble with a flexible approach
There are many benefits to a flexible stubble management approach because there is no perfect stubble management strategy for every year. Crop rotations, weeds, diseases, pests, stubble loads, sowing machinery, seasonal conditions, and potential sowing problems will dictate how stubble is managed. But all start at harvest.
A flexible approach means crops can be harvested high or low depending on the season and situation, stubbles can be retained intact, but could also be grazed with considerable economic advantage, or straw baled and sold, or burnt. Consider reducing stubble in paddocks where the stubble may impact the following crop yield e.g., wheat on wheat paddocks.
To successfully establish a crop into a full stubble-retained system requires an integrated management approach incorporating three stages of stubble management – (i) pre-harvest, (ii) post-harvest/pre-sowing, and (iii) at sowing. During these periods, a series of questions arise:
- What is my seeding system – disc or tine – row spacing and accuracy of sowing?
- What crop will be sown into the paddock next year?
- What crop am I harvesting, potential grain yield and estimated crop residue level?
- What is the preferred harvest height and potential harvest speed?
- Is the crop standing or lodged?
- Do I need to harvest very low and spread straw evenly – tine/weeds?
- Do I have a weed problem which requires harvest weed seed control
- [narrow windrow burning, chaff carts or chutes, seed mill e.g. integrated Harrington Seed Destruction (iHSD)]?
- Will I need any post-harvest stubble management (grazing, baling, mulching, incorporate + nutrients or to burn)?
- What is the risk of pests and disease in the following crop?
- What herbicide options am I considering for all crop types and stubble loads?
- What is the erosion risk based on soil type and topography?
Prior to harvest, all crops should be assessed to estimate grain yield, potential stubble load and weed issues. As a rule of thumb the stubble load following harvest will be approximately 1.5 to 2 times the grain yield for wheat and between 2 to 3 times the grain yield for canola.
Stubble height
Using a stripper front or harvesting high is the quickest and most efficient method to produce the least amount of residue that needs to be threshed, chopped and spread by the combine. Harvesting high (40 cm) compared to low (15 cm) increased grain yield and combine efficiency by reducing bulk material going through the header and reduced harvests costs by 37% (Table 1). As a general rule, there is a 10% reduction in harvest speed for each 10 cm reduction in harvest height (Table 1). Slower harvest speed across a farm also exposes more unharvested crop to the risk of weather related losses (sprouting, head/pod loss, lodging) during the harvest period, and the cost of this is not accounted for in Table 1.
Table 1. Harvesting wheat low or high using a Case IH 8230 combine with a 13 m front in 2015. Ground speed was altered to achieve a similar level of rotor losses at both harvest heights. Operating costs determined at $600/hr.
Harvest height | Efficiency (ha/hr) | Speed (km/hr) | Fuel use (L/ha) | Harvest efficiency | Grain yield (t/ha) | Cost | Cost |
|---|---|---|---|---|---|---|---|
40 cm | 12.0 | 8.5 | 6.6 | 45 | 3.8 | $50.00 | $13.50 |
15 cm | 7.5 | 6.0 | 10.6 | 30 | 3.9 | $80.00 | $20.20 |
% change to 15 cm | -38% | -29% | +61% | -33% | ns | +37% | +33% |
(ns = no significant difference) | |||||||
However, there are some negatives to retaining tall wheat stubble. Wheat sown into taller wheat stubble (45 cm compared with 15 cm) received less radiation and was exposed to lower temperatures, which reduced early growth and tiller numbers. For example, in experiments conducted by Riverine Plains in 2014, grain yield was reduced from 5.7 t/ha to 5.0 t/ha (lsd @ P<0.05 = 0.45 t/ha) in tall compared to short stubble. In 2015 and 2016 the group found no difference in grain yield although in 2016, there were fewer tillers in tall stubble.
Table 2. Effect of HWSC on wheat grain yield and harvest efficiency of a Case IH 9120 combine harvesting conventionally at 30 cm, harvesting at 15cm for baling or narrow windrow burning, and harvesting at 15 cm with a prototype iHSD at Furner, SA in 2016. (Data supplied by GRDC project SFS00032)
Treatment | Harvest height | Grain yield (t/ha) | Speed (km/hr) | Engine load (%) | Fuel use (L/ha) | Fuel efficiency (L/hr) |
|---|---|---|---|---|---|---|
Conventional harvest – burn | 30 cm | 4.7 | 3.8 | 59.8 | 14.3 | 52.7 |
Harvest – bale or narrow windrow burn | 15 cm | 4.6 | 4.0 | 65.5 | 16.4 | 59.5 |
% change to 15 cm | ns | ns | +10% | +15% | +13% | |
iHSD | 15 cm | 4.6 | 4.0 | 88.7 | 22.7 | 87.8 |
% change to iHSD |
|
| +35% | +38% | +47% |
Herbicide resistant weeds, especially annual ryegrass (ARG) remain a problem. Harvest weed seed control (HWSC) including narrow windrow burning, chaff carts, chaff lining, direct baling, and mechanical weed seed destruction, slow the evolution and spread of herbicide resistance by reducing seed banks. HWSC requires crops to be harvested low so weed seeds are captured in the chaff fraction from the combine. This provides an additional reason to harvest low. The challenge for growers is making sure the weed seeds enter the harvester in the first place.
A pro-active and flexible approach to stubble management is one that recognises and avoids situations in which stubble can reduce productivity or profitability. It must be acknowledged that following harvest, there is often large amounts of retained stubble with a high C:N ratio, especially cereal stubble. This can ‘tie-up’ soil nitrogen leading to N deficiency in the following crop and could reduce yield. The timing, extent and consequences of N tie-up are all driven by variable weather events (rainfall and temperature) as well as soil and stubble type, so quite different outcomes may occur from season to season and in different paddocks (Kirkegaard et al 2018).
Can stubble really reduce yield significantly in no-till systems – and is N-tie up a factor?
(extracted from Kirkegaard et al 2018)
https://grdc.com.au/resources-and-publications/grdc-update-papers/tab-content/grdc-update-papers/2018/02/the-effects-of-stubble-on-nitrogen-tie-up-and-supply2
Harden long-term site
In a long-term study (30 years) at Harden in NSW the average wheat yield has been reduced by 0.3t/ha in stubble retained versus stubble burnt treatments, but the negative impacts of stubble were greater in wetter seasons (Figure 1). Nitrogen tie-up may be implicated in wetter years, due to higher crop demand for N and increased losses due to leaching or denitrification. But significant differences in the starting soil mineral N pre-sowing were rarely found. For many years, we were not convinced N tie-up was an issue (although there were insufficient measurements to confirm it).
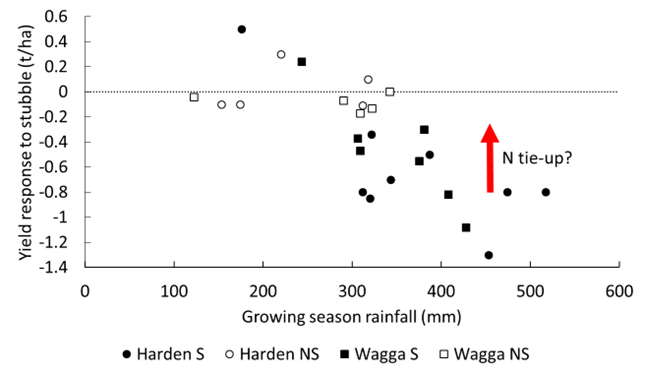
Figure 1. Effect of retained stubble on wheat yieldis greater in wetter seasonsat the Harden(circles) and Wagga (squares) long-term (30 years) tillage experiment sites. Open symbols are where difference between retain and burnt were not significant (NS), solid where significant (S).
The process of ‘N-tie up’ (immobilisation) – put simply
Extracted from Kirkegaard et al 2018
Farmers are always growing two crops – the above-ground crop (wheat, canola, lupins etc) is obvious, but the below-ground crop (the microbes) are always growing as well; and like the above-ground crop they need water, warm temperatures and nutrients to grow. There’s as much total nutrient in the microbes per hectare as in the mature crop, and two thirds are in the top 10 cm of soil.
There are two main differences between these two ‘crops’ – firstly the microbes can’t get energy (carbon) from the sun like the above-ground plants, so they rely on crop residues as the source of energy (carbon). Secondly, they don’t live as long as crops – they can grow, die and decompose (‘turnover’) much more quickly than the plants – maybe 2–3 cycles in one growing season of the plant. The microbes are thus immobilising and then mineralising N as the energy sources available to them come and go. In a growing season it is typical for the live microbial biomass to double by consuming carbon (C) in residues and root exudates – but they need mineral nutrients as well. Over the longer term the dead microbe bodies (containing C, N, phosphorus (P), sulphur (S) become the stable organic matter (humus) that slowly releases fertility to the soil. In the long term, crop stubble provides a primary C-source to maintain that long-term fertility, but in the short term the low N content in the cereal stubble means microbes initially need to use the existing soil mineral N (including fertiliser N) to grow, and compete with the plant for the soil N.
Cereal stubble isn’t a good source of N for crops
Extracted from Kirkegaard et al 2018
Studies at three sites in southern Australia (Temora NSW, Horsham VIC and Karoonda SA) have tracked the fate of the N in stubble to determine how valuable it is for succeeding wheat crops under Australian systems. Stubble labelled with 15N (a stable isotope that can be tracked in the soil) was used to track where the stubble N went. At Temora (Figure 2), of the 55 kg/ha of N contained in 7.5 t/ha of wheat residue retained in 2014, only 6.6 kg N/ha (12%) was taken up by the first crop (representing 12% of crop requirement); and 5.6 kg N/ha (10%) was taken up by the second wheat crop (4.4 % of crop requirement). After two years the majority of the N remained in the soil organic matter pool (19.1 kg N/ha or 35%) and some remained as undecomposed stubble (5.5 kg N/ha or 10%). Thus we can account for around 67% of the original stubble N in crop (22 %), soil (35 %) and stubble (10%) with 33% unaccounted (lost below 50 cm, denitrified). In similar research carried out in the UK over four years, crop uptake was 6.6%, 3.5%, 2.2% and 2.2% over the four years (total of 14.5%), 55% remained in the soil to 70 cm, and 29% was lost from the system (Hart et al., 1993).
The main point is that the N in cereal stubble represented only 6% of crop requirements over two years (7.6 % Year 1; 4.4 % Year 2) and takes some time to be released through the organic pool into available forms during which losses can occur.
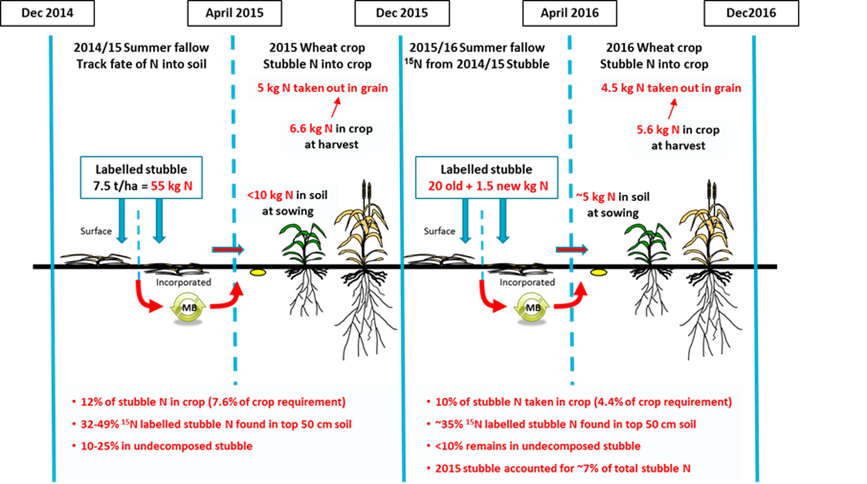
Figure 2. The fate of the N contained in retained wheat stubble over two years in successive wheat crops following the addition of 7.5 t/ha of wheat stubble containing 55 kg N/ha. The successive crops took up 12% (6.6 kg N/ha) and 10% (5.6 kg N/ha) of the N derived from the original stubblerepresenting only 7.6% and 4.4% of the crops requirements. Most of the stubble N remained in the soil (35%) or was lost (33%).
Post-harvest management options in stubble retained farming systems
Option 1: Mulch and incorporate
Lightly incorporating the stubble into the surface soil using a disc chain or disc implement (e.g. Speedtiller®, Grizzly, Amazone, Cattross, Vaderstad, Topdown or Lemken Heliodor) soon after harvest while the stubble has a higher nutritional value is another option for farmers wanting to maintain all of their stubble, especially where a tined seeder is the primary sowing implement, or where lime and stubble needs to be incorporated into the soil in a disc-seeding system. Lightly incorporating means to incorporate a large percentage of the stubble residue, but to leave enough on the soil surface to minimise erosion and improve infiltration following rainfall events. On the lighter sandier soils in SA, the recommendation would be to delay incorporation until 3–4 weeks before seeding as these soils are more prone to wind and water erosion. Mulching and incorporation requires soil moisture, warm soil temperature, soil/stubble contact and nutrients to convert a carbon rich feed source into the humus fraction. Early mulching and incorporation allows time for the stubble to decompose and immobilise N well before sowing, reducing the likelihood of reduced N availability.
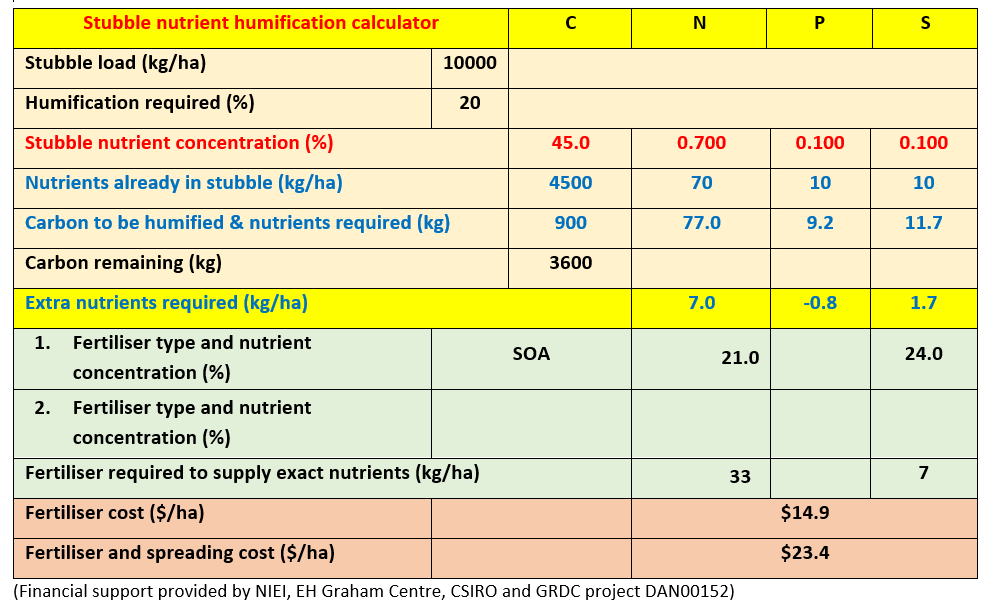
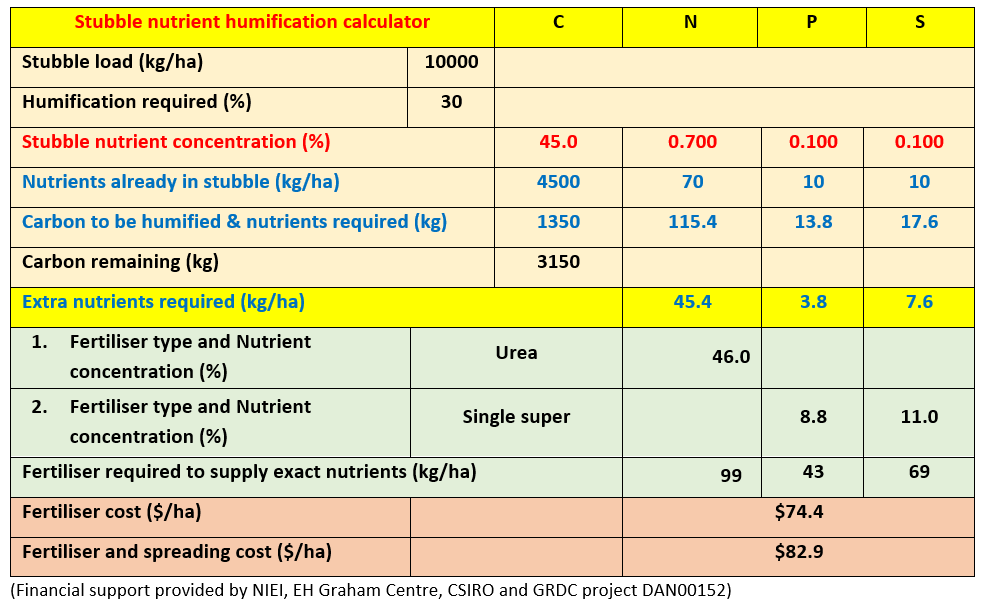
When trying to decompose a large quantity of stubble in a short period of time, and to maximise conversion of stubble into stable soil C (humus), it may be beneficial to add some nutrients to the stubble prior to incorporation. To assist in minimising the amount of fertiliser required to add to the stubble, determining the concentration of the nutrients in the stubble is important. Only a small proportion of the total carbon in the crop residues can be converted into humus. Dr Clive Kirkby has found that a maximum of ~30 % of the total carbon from stubble residues could be converted to humus (the rest is used for energy and respired by microbes), so recommends lowering the humification rate to 20 % rather than 30 %. In our example (Table 3), the quantity of fertiliser (sulphate of ammonia) that would need to be applied to the 10 t/ha residual cereal stubble load where the stubble had a nutrient concentration of 0.7% N, 0.1% P and 0.1% S and the target was a humification rate of 20% would be 33.1 kg/ha of N and 7 kg/ha of S at an estimated cost of $14.90/ha for nutrients only. In contrast, if a farmer was trying to build up their organic carbon concentration in the soil from this stubble residue to the maximum possible amount (30% humification rate), the quantity of nutrients required increases to 45.4 kg N/ha, 3.8 kg P/ha and 7.6 kg S/ha, at a cost of $74.40/ha for nutrients (Table 4). The nutrients applied are not lost but should form a source of slow release nutrition to the following crop as humus while avoiding ‘nutrient tie-up’ caused by late incorporation of nutrient poor residues. Thus, later inputs could potentially be reduced if costs were of concern.
Table 3. Dr Clive Kirkby’s stubble nutrient humification calculator to estimate the amount of fertiliser (N and S only) as sulphate of ammonia (kg/ha) that would need to be applied to a 10 t/ha cereal stubble with a target humification rate of 20% to assist in rapid breakdown of the residual stubble.
In an experiment at Harden, NSW between 2008 and 2011, Dr Kirkby incorporated between 8.7 and 10.6 t/ha of cereal or canola stubble without nutrients or with nutrients at a humification rate of 30%. In May 2009, following the incorporation of 8.7 t/ha wheat stubble in February 2009, they measured the quantity of wheat stubble that had broken down and found that only 24% of the stubble remained where nutrients had been added whereas 88% remained where the stubble had been incorporated only (Kirkby et al. 2016).
Table 4. Dr Clive Kirkby’s stubble nutrient humification calculator to estimate of the amount of fertiliser (N:P:S) as urea and single superphosphate (kg/ha) that would need to be applied to a 10 t/ha cereal stubble with a humification rate of 30% to assist in more rapid breakdown of the residual stubble.
New CSIRO led GRDC investment in sequestering more soil carbon from non-legume stubbles
A new GRDC funded five-year $3.5 million farming system project is underway at eight sites across Australia to examine how growers can increase their soil organic matter concentrations through effective nutrient management using a whole-of-farm systems approach to increase soil microbes (More information at https://groundcover.grdc.com.au/grdc-groundcover-supplement?supp=stubble-innovation-may-june-2023)
This CSIRO-led project by Dr John Kirkegaard working with Delta Agribusiness and Kaylx Australia, will identify the most effective ways to increase soil organic matter from crop residues in dryland cropping systems and detail the cost-benefit analysis of a range of nutrient and residue management strategies for grain growers. The research will test the cost and yield benefits of ten different nutrient supply strategies with factors to be examined including nutrient type, timing, rate and positioning. A special blend of fertilisers ‘Stubble Blend’ (mix of Gran Am, Urea and MAP) has been formulated by Delta Agribusiness and applied to various treatments in March–April 2023. The aim is to examine methods to increase soil organic matter while providing quantitative measures of the carbon benefits and the costs of achieving changes in soil carbon. It is examining a holistic approach that aims to ‘fertilise the system, not just the crop’ (CSP2302-011RTX).
Option 2: Baling
In many areas across southern Australia, a significant area of stubble was baled in 2016/17 and 2020/21 season. Baling allows the farmer to harvest high and efficiently (use stripper front if possible) and reduce the stubble load in the paddock to minimise problems at sowing. One of the negatives of baling stubble is the loss of nutrients from the paddock, however, we should continue to think of cereal stubble as a source of C, rather than N.
Option 3: Grazing
For mixed farmers, the option to graze the stubble soon after harvest can be quite profitable. In a long-term no-till controlled traffic grazing experiment at Temora from 2010 to 2017 with a crop rotation of canola-wheat-wheat, four treatments were compared. These included 1. Full stubble retained system (Nil graze - Stubble retain), 2. A post-harvest grazing of the stubble (Stubble graze - Stubble retain), with each treatment split to accommodate a late burn pre-sowing 3. Nil graze- Stubble burn, and 4. Stubble graze - Stubble burn (Table 5). In the stubble retain treatment, stubble was left standing through summer, and fallow weeds were strictly controlled. All plots were inter-row sown with deep knife points and machinery operations conducted using controlled traffic. Stubble grazed plots were grazed within 2–3 weeks of harvest at approx. 300 DSE/ha for five days ensuring >3 t/ha stubble remained for soil protection and water retention. All plots were sown, fertilised and kept weed free such that weeds, disease and nutrients did not limit yield. There were two phases to the experiment, with Phase 1 starting in 2009, and Phase 2 commencing in 2010.
Averaged across both phases for the seven years of the experiment, grazing and then retaining the stubble generated the highest gross income with a $55/ha/year increase in gross income where sheep were used to graze the stubble compared to nil grazing. This increase was related to higher yield and grain quality in subsequent crops driven by greater N availability in the grazed stubble. If the grazing was valued assuming one dry sheep equivalent (DSE) consumed 7.6 MJ of energy per day at an agistment rate of $0.4/DSE/week, the grazing value of the stubble was $117/ha/year, combined with the increase $55/ha/year due to yield and N availability resulting in a total increase of $172/ha/year.
Table 5. Gross income per year averaged across two phases where stubble was either grazed post-harvest or not, and either burnt just before sowing or retained, 2010–2017 at Temora, NSW.
Graze treatment | Stubble treatment | Gross income ($/ha/year) | |
|---|---|---|---|
|
| Assuming grazed | Assuming grazed stubble has value as per methods |
Nil graze | Retain | $1,231 | $1,231 |
Burn | $1,269 | $1,269 | |
Stubble graze | Retain | $1,286 | $1,403 |
Burn | $1,277 | $1,397 | |
At the Temora experiment, grazing stubbles never reduced the yield of any crop at the site, but increased the yield of the second wheat crop by 1.2 t/ha in 2013 (Phase 1) and by 1.0 t/ha in 2015 (Phase 2) (Table 6). This was unrelated to pre-sowing soil N in 2013 (both had ~85 kg N/ha at sowing) where we suspect increased frost effects in the un-grazed stubble – while in 2015, the yield benefit was related to pre-sowing soil N with an extra 61 kg N/ha at sowing in the grazed plots. Overall, grazing increased the pre-sowing N by 13 kg/ha in the first wheat crop and by 33 kg/ha in the second wheat crop (Table 6).
Table 6. Effect of grazing stubble on grain yield at Temora in Phase 1 and 2. Crops in italics are canola (shaded squares), and bold are the second wheat crops. * shows where significantly different (P<0.05)
Phase | Treatment | 2009 | 2010 | 2011 | 2012 | 2013 | 2014 | 2015 | 2016 | 2017 |
|---|---|---|---|---|---|---|---|---|---|---|
Phase 1 | No graze | 1.7 | 4.2 | 4.6 | 4.4 | 0.7 | 3.8 | 4.1 | 3.2 | 3.7 |
Graze | 1.7 | 4.3 | 4.5 | 4.8 | 0.9 | 3.7 | 5.3* | 3.3 | 3.3 | |
Phase 2 | No graze | - | 6.3 | 3.4 | 4.5 | 2.0 | 2.0 | 5.5 | 5.2 | 2.2 |
Graze | - | 6.2 | 3.3 | 4.8 | 3.0* | 2.2 | 5.6 | 5.6* | 2.3 |
Option 4: Strategic late burn
Burning is an effective, inexpensive method of removing stubble, assisting in reducing disease carryover, reducing certain seedling pests and weed populations and if using a flexible managament approach should be considered in strategic situations. With careful planning and diverse management, burning can be kept for those occassions where the system needs to be reset, which can result in farmers retaining stubble for another series of years. A late burn, conducted wisely just prior to sowing to minimise the time the soil is exposed, is one option farmers may need to consider. Some negatives to burning include loss of nutrients (amount depends on temperature), increased regulation and potential losses of soil from erosion.
At the Temora experiment in un-grazed treatments, retaining stubble, rather than burning had no impact on the yield of canola or the first wheat crop over the nine years, but consistently reduced the yield of the second wheat crop by an average on 0.5 t/ha (Table 7). This yield penalty was associated with an overall significant reduction in pre-sowing soil mineral-N of 13 kg/ha, while there was no significant difference in pre-sowing N for the first wheat crop (Table 8).
Table 7. Effect of stubble burning on grain yield at Temora in Phase 1 and 2. Crops in italics are canola (shaded squares), and bold are the second wheat crops. * shows where significantly different (P<0.05)
Phase | Treatment | 2009 | 2010 | 2011 | 2012 | 2013 | 2014 | 2015 | 2016 | 2017 |
|---|---|---|---|---|---|---|---|---|---|---|
Phase 1 | Retain | 1.7 | 4.2 | 4.6 | 4.4 | 0.7 | 3.8 | 4.1 | 3.2 | 3.7 |
Burn | 1.7 | 4.0 | 4.6 | 5.0* | 1.0 | 3.8 | 4.6* | 3.2 | 3.2 | |
Phase 2 | Retain | - | 6.3 | 3.4 | 4.5 | 2.0 | 2.0 | 5.5 | 5.2 | 2.1 |
Burn | - | 6.2 | 3.5 | 4.8 | 3.4* | 2.0 | 5.3 | 5.7* | 2.4 |
Table 8. Effect of stubble burning or grazing on soil mineral N (kg N/ha) to 1.6 m depth prior to sowing either first or second wheat crops, meaned across years and phases at Temora.LSD for interaction of treatment and rotational position where P<0.05.
Rotation position | Stubble treatment | Grazing treatment | ||
|---|---|---|---|---|
Retain | Burn | No graze | Graze | |
First wheat | 117 | 110 | 107 | 120 |
Second wheat | 102 | 115 | 92 | 125 |
LSD (P<0.05) | 13 | 13 | ||
How much stubble do we need for erosion control?
Two of the big advantages of retaining stubble are to protect the soil from erosion and maximising the capture of water for the following crop. It is well recognised that at least 2–3 t/ha of stubble is required to protect the soil (Figure 3) and maximise infiltration (Hunt et al. 2016b). As an example, in a grazing experiment at Condobolin Research Station (AAR of 450 mm) managed by NSW DPI, the 70% cover treatment maximised infiltration over summer and there was no effect or a positive effect of ensuring >3.5 t/ha of stubble was retained in a dry year (data not shown).
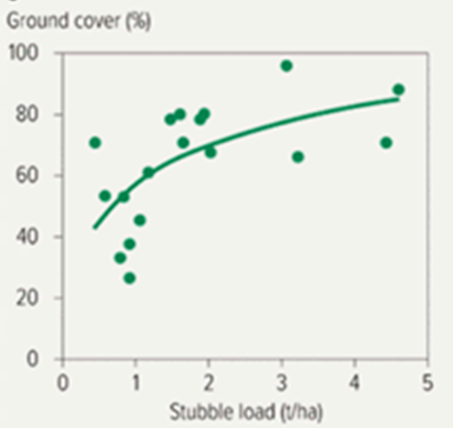 Figure 3. Relationship between cereal stubble load and ground cover (%).
Source: Michael Moodie, Mallee Sustainable Farming in Groundcover Supplement Issue, 135 July-Aug 2018
Stubble delays but does not stop evaporation from soil?
Research in the 1970s found that cereal stubble delayed the loss of water from the soil due to evaporation (Figure 4). If there is no follow up rainfall the effect on evaporation is transient. In the laboratory experiment of Figure 5 that used moist soil columns exposed to a relatively high evaporation potential of 7 mm/day, about 30 days were required for the cumulative evaporation under a stubble load of 2.2 t/ha to ‘catch up’ to that of bare soil and about 50 days where 4.5 t/ha of stubble was retained. Thus in a long dry summer, stubble covered soils can end up with the same moisture as bare soils, but in dry autumns a moisture benefit under stubble is retained for a long period to facilitate earlier sowing.
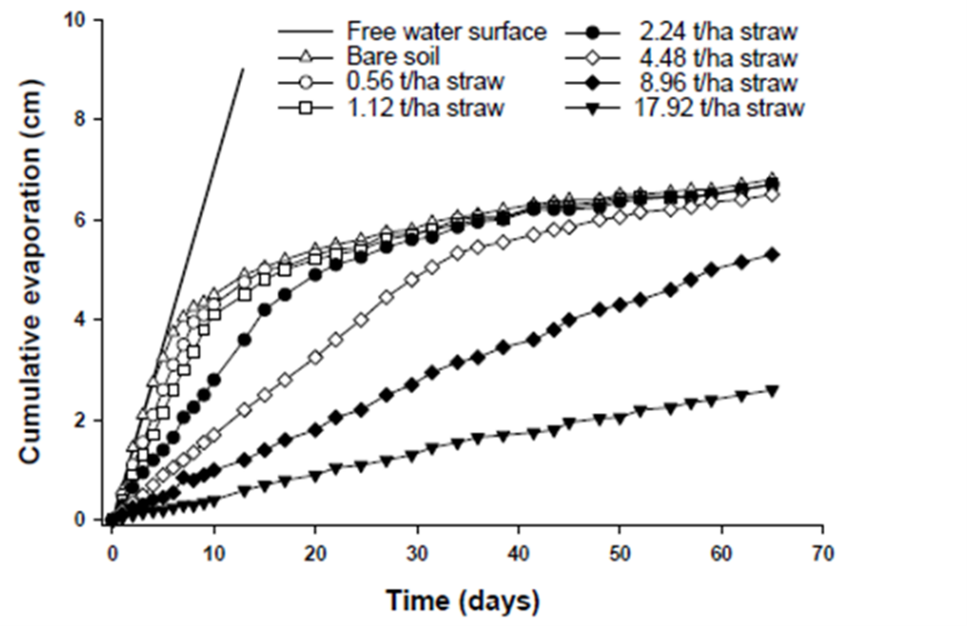
Figure 4. The effect of rate of applied wheaten straw on the cumulative evaporation from moist soil columns at an evaporative potential of 7 mm/day over 65 days.
Sources: Bond and Willis (1970) & B Scott (2013)
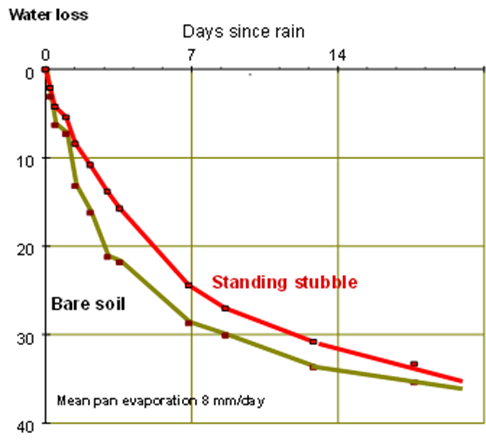
Figure 5. Cumulative evaporation under 4 t/ha stubble in weighing lysimeters.
Source: Dalgliesh (2014)
The typical conditions experienced during summer of high evaporative demand and low frequency of rainfall events mean that the effects of stubble on evaporation are often only transient. This explains why retaining stubble often has little or no effect on soil water storage over summer (Verburg et al 2012; Verburg and Whish 2016) unless there is a significant rainfall event that moves the soil water deeper into the profile. Lysimeter observations and modelling by Verburg et al (2012) indicated, however, that stubble cover did reduce cumulative evaporation losses under conditions of low evaporative demand post-sowing in early winter (average of ~ 1 mm/day). During the months of late March to April where the evaporation potential is intermediate (3–4 mm/day), 2 to 4 t/ha of stubble can, therefore, result in ensuring the soil moisture is maintained at a level suitable for germinating seedlings at sowing.
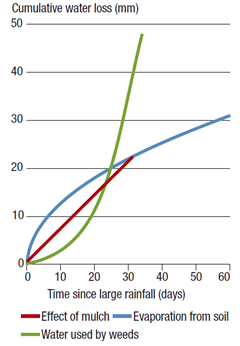
Figure 6. Delaying effect of mulch. GRDC Water Use efficiency Fact Sheet 2009 Southern and Western region. (https://grdc.com.au/resources-and-publications/all-publications/factsheets/2010/02/grdc-fs-wateruseefficiencysouthwest)
Compared to the smaller effect of stubble on water loss from evaporation, the effect of weeds on summer water accumulation is often significantly higher (Figure 6). Hunt et al (2013) found that the presence of 2.4 to 5.8 t/ha of stubble in a three-year experiment at Hopetoun, Victoria had no effect on soil water accumulated over the summer fallow on both sand and clay soils, but there was a slight increase in grain yield on the clay. However, controlling summer weeds, primarily heliotrope and volunteer crop species, increased soil water accumulation by an average of 45 mm and soil mineral nitrogen by 45 kg N/ha.
Managing nitrogen with full stubble retention
Option 1: Can additional nitrogen at sowing improve crop yield and uptake?
In 2017, two different experiments were implemented in sub-plots at Harden, NSW to investigate the potential role of nitrogen tie-up in the growth and yield penalties associated with stubble. A crop of wheat (cv. Scepter) was sown on 5 May following a sequence of lupin-canola-wheat in the previous years. In both the stubble-retained and stubble-burnt treatments we compared 50 or 100 kg N/ha broadcast as urea at sowing in one experiment, and compared 100 kg N/ha surface applied with 100 kg/N deep-banded below the seed. The pre-sowing N to 1.6 m was 166 kg N/ha in retained and 191 kg N/ha in burnt but was not significantly different. Plant population, growth and N content at GS30 did not differ between treatments (data not shown) but by anthesis, the biomass and tiller density were significantly increased by the additional 50 kg/ha of surface-applied N in the stubble-retained treatment, while there was no response in the stubble burnt treatment. At harvest, both stubble retention and increased applied N improved grain yield, but the increase due to N was higher under stubble retention (0.6 t/ha) than stubble burnt, presumably due to improved water availability. The increase in yield with higher applied N, and the low grain protein overall (and with low N) suggests N may have been limiting at the site, but the water-saving benefits of the stubble may have outweighed the earlier effects of immobilisation.
Table 9. Effect of additional surface applied and deep-placed N on wheat response in stubble burnt and retained treatments at Harden in 2017. (Kirkegaard et al 2018)
Treatment | Anthesis | Harvest (@12.5% moisture) | |||
|---|---|---|---|---|---|
Stubble | N | Biomass (t/ha) | Tillers (number/m2) | Yield | Protein |
Retain | 50 | 7.1 | 324 | 4.3 | 8.8 |
100 | 8.4 | 401 | 4.9 | 9.6 | |
Burn | 50 | 8.8 | 352 | 4.2 | 9.3 |
100 | 8.7 | 372 | 4.5 | 10.5 | |
LSD (P<0.05) | Stubble | 0.9 | ns | 0.2 | ns |
N | 0.5 | 33 | 0.1 | 0.2 | |
Stubble x N | 0.8 | 38 | 0.2 | ns | |
Option 2: Can deep-banding nitrogen at sowing improve crop yield and uptake?
Deep-banding the N fertiliser had no impact on crop biomass or tissue N content at GS30, but increased both the biomass and N content of the tissue at anthesis, more in the retained-stubble than in burnt stubble (Table 10). Retaining stubble decreased biomass overall but not tissue N. N uptake at anthesis was significantly increased by deep-banding in both stubble treatments, however the increase was substantially higher in the stubble-retain treatment than in the burn treatment (38 kg N/ha cf 15 kg N/ha). The overall impact of deep banding on yield persisted at harvest, but there was no effect, nor interaction with stubble retention, presumably due to other interactions with water availability. However, the fact that deep-banding N has had a bigger impact in the stubble retained treatment provides evidence of an N-related growth limitation related to retained stubble. It’s appearance at anthesis, and not earlier, presumably reflects the high starting soil N levels which were adequate to support early growth but the cold dry winter generated N deficiencies as the crop entered the rapid stem elongation phase. The increased grain protein content related to both burning and deep-banding and its independence from yield, suggest on-going N deficiencies generated by those treatments.
Table 10. Effect of surface-applied and deep-banded N on wheat in stubble-burnt and stubble-retained treatments at Harden in 2017. (Kirkegaard et al 2018)
Treatment | Anthesis | Harvest (@12.5% moisture) | ||||
|---|---|---|---|---|---|---|
Stubble | 100 N | Biomass | Tissue | N Uptake | Yield | Protein |
Retain | Surface | 8.1 | 1.1 | 91 | 4.5 | 9.3 |
Deep | 9.1 | 1.4 | 129 | 5.1 | 10.2 | |
Burn | Surface | 8.9 | 1.2 | 104 | 4.5 | 10.3 |
Deep | 9.5 | 1.3 | 119 | 5.0 | 10.8 | |
LSD (P<0.05) | Stubble | 0.6 | ns | ns | ns | 0.8 |
N | 0.2 | 0.1 | 8 | 0.2 | 0.4 | |
Stubble x N | 0.6 | 0.2 | 12 | ns | ns | |
The evidence emerging from these studies suggests that even where cereal crop residues are retained on the soil surface (either standing or partially standing) and not incorporated, significant N immobilisation can be detected pre-sowing in some seasons. The extent to which differences emerge are related to seasonal conditions (wet/dry, warm/cool conditions), and to the time period between stubble treatment (burning or grazing) and soil sampling to allow differences to develop. However, even where soil N levels at sowing are similar between retained and burnt treatments (which may result from the fact that burning is done quite late) ongoing N immobilisation POST-SOWING by the microbes growing in-crop is likely to reduce the N available to crops in retained stubble as compared to those in burnt stubble.
What else can farmers do to retain stubble and improve crop yields?
In this paper we utilise the findings from two recent systems experiments undertaken in southern and central NSW that compare diverse cropping sequences such as pulse legume-canola-cereal with more traditional cropping sequences, such as canola-cereal-cereal. The differences in the cropping sequences from the 4- and 5-year fully phased experiments in terms of economics, benefits of the legume, and for weed and overall systems management will be discussed.
Diverse cropping sequence
A diverse cropping sequence provides many benefits for farmers wanting to retain all their stubble annually. Diversity allows each crop to be sown into a less antagonistic stubble by reducing physical, disease, pest and weed constraints. For example, canola sown into a pulse legume stubble emerges in a more suitable environment that following several years of cereal stubble, while a vigorous barley plant can emerge from a wheat stubble, and likewise, a large-seeded pulse from barley stubble. Diverse crop rotations that include double breaks, premium herbicides and some crop competition from crops, such as barley, have proved to be very profitable with lower risk and are very effective at keeping herbicide resistant weed populations low.
The CSIRO–GRDC Crop Sequencing experiment at Temora, 2014 to 2018
A fully phased systems experiment was established in 2014 at FarmLink’s Temora Agricultural Innovation Centre, with high levels of Group B resistant ARG, to examine if a diverse crop rotation (vetch hay-TT canola-wheat-barley) could improve the profitability of stubble retained no-till (Flexi-Coil tine seeder with Stiletto knife points and deep banding & splitting boots) and zero-till (Excel single-disc seeder with Aricks Wheel) systems. Three cropping strategies (Aggressive, Conservative and Diverse) were compared with the rotations for each as Aggressive (RR canola-wheat-wheat), Conservative (TT canola-wheat-wheat) and Diverse (as above). In the cereal crops in the Aggressive and Diverse strategies, new-generation pre-emergent herbicides (Sakura® - pyroxasulfone and Boxer Gold® - prosulfocarb + s-metolachlor) were used for grass weed control in cereals and propyzamide in the canola. In the Conservative strategy, trifluralin and diuron were used for grass weed control in the tine system, and diuron alone in the disc system.
1. Diversity and profitability in the Crop Sequencing experiment 2014–18
The Diverse management strategy is extremely profitable achieving a net margin ($476/ha/year) which is higher than the Aggressive strategy ($454/ha/year) and at lower cost ($489 compared with $539/ha/year) and thus higher profit:cost ratio ($0.98 compared with $0.83) (Table 11). The reduced costs in the Diverse strategy are driven by lower fertiliser N inputs from the inclusion of vetch hay which require no fertiliser N and provides residual N for subsequent crops. The average cost for nitrogen fertiliser in the Aggressive strategy was $111/ha/year compared to $72/ha/year in the Diverse strategy, a saving of $41/ha/year. There were no significant differences in crop yield between the disc and tine seeders where weeds were successfully managed in the Diverse and Aggressive strategies. The costs to manage weeds were higher in the aggressive strategy compared to the diverse strategy. However, the herbicide costs were lower in the conservative strategy, this resulted in lower yields and net margins.
Where a wheat-faba bean-wheat rotation was against a wheat-wheat-wheat (+/- burning), there was no significant difference in wheat yield following wheat stubble that was retained or burnt (average 3.42 t/ha), but there was a 2 t/ha increase in wheat yield following faba bean (Riverine Plains).
Table 11. Effect of crop strategy on average net margins (EBIT) at Temora, NSW, 2014–17 averaged across opener types (disc and tine seeders).
Management strategies | Crop type | Average 4 years (2014–17) | ARG seedbank | ||
|---|---|---|---|---|---|
Total cost | Net margin | Profit:Cost ratio | |||
Aggressive | Canola-Wheat-Wheat | 539 | 454 | 0.83 | 250c |
Conservative | Canola-Wheat-Wheat | 461 | 328 | 0.69 | 898b |
Diverse | PulseCanola-Wheat-Barley | 489 | 476 | 0.98 | 7406a |
Note: The weed seedbank data was analysed by tog e and back transformed. Letters indicate significant differences at P<0.001 | |||||
2. Diversity and weed management in the Crop Sequencing experiment 2014–18
Implementing a Diverse management strategy that includes a double break was not only profitable and less risky (lower profit:cost ratio) but was the most effective system at reducing annual ryegrass (ARG) weed populations. The ARG seedbank was reduced by 70 % in three years in the Diverse strategy compared with the Aggressive strategy (Table 11). Where low-cost herbicides were used in the Conservative sequence, the ARG numbers in the wheat-wheat-canola sequence increased by 800%. In the wet year of 2016, the pre-emergent herbicides had become in-effective by August, and the competitive barley was extremely effective at continuing to reduce any late emerging ARG weeds.
There was a significant effect of opener type on ryegrass control with higher ARG populations found when sown with a disc opener compared to a tine opener where low-cost herbicides were used, (data not shown) but this was no surprise as there are limited low-cost herbicides on label for a disc opener. It is recommended that where high ARG populations are suspected, more effective herbicide options, include a pulse crop to the rotation, increase crop competition from narrower row spacing and competitive crop types should be used where a disc opener is preferred. It should also be acknowledged that irrespective of opener type, all AHRI’s ‘Big 6’ strategies (https://weedsmart.org.au/the-big-6/) should be implemented to keep the weed seedbank low.
The CSIRO-NSWDPI-GRDC Farming Systems experiments 2018–22
1. Experiment outline
Four contrasting locations were selected in 2017 to represent a range of soil types and environments, which encompassed a diverse range of grower and consultant groups. The main core experiment site is located at the Wagga Wagga Agricultural Institute with three regional node sites located at Condobolin Research and Advisory Station, Greenethorpe and Urana. There were six treatment sequences common to all sites, with the Wagga Wagga site encompassing all treatments. In this paper, we will only be presenting information on the Greenethorpe experiment. The systems and crop sequences within each system are outlined in Table 12. The Greenethorpe experiment was sown to wheat in 2017 with the crop sequences starting in 2018.
Table 12. Greenethorpe Farming systems experiment details: treatment name, sowing timing, N management and winter grazing strategies applied to different crop sequences.
Systems | Crop sequences | Grazing/ | Time of sowing | Nitrogen strategy |
|---|---|---|---|---|
Baseline | Canola-wheat-wheat | Non-grazed | Timely | Low & High |
Intense baseline-NG | Canola-wheat | Non-grazed | Timely | Low & High |
Diverse low value | Faba bean-canola-wheat | Non-grazed | Timely | Low |
Diverse mixed | *Legume-canola-wheat | Non-grazed | Timely | Low |
Diverse high value 2 | Chickpea-wheat | Non-grazed | Timely | Low |
Intercropping | Faba bean/canola-wheat or chickpea/linseed wheat | Non-grazed | Timely | Low |
Continuous wheat | Wheat-wheat-wheat-wheat | Non-grazed | Timely | Low |
Flexible 1 (consultant NG) | Canola-barley-faba bean-wheat- canola-wheat | Non-grazed | Flexible | Flexible |
Diverse high value 1 | Lentil or chickpea-canola-wheat | Non-grazed | Timely-pulse Early C & W | Low |
Intense baseline-Gr | Canola-wheat | Grazed | Early | Low & High |
Diverse mixed-Gr | *Legume-canola-wheat | Grazed | Early | Low |
Flexible 2 (consultant Gr) | Wheat-wheat-canola-wheat-canola-wheat | Grazed | Flexible | Flexible |
* Legume = either Vetch as a monoculture, or Vetch/Arrowleaf/Balansa mix
E = Sown early from early-March to mid-April period
T = Timely sown crops from 3rd week April to mid-May
G = Grazing (always winter grazed and sometimes a 2nd grazing or stubble graze)
Nitrogen = Low (top-dressed nitrogen in June-July for a decile 2-year grain yield, High (top-dressed nitrogen in June-July for a decile 7-year grain yield)
Although this farming systems experiment is not a stubble management experiment, in this high rainfall region, the CSIRO–NSWDPI farming system team are required to manage high stubble loads in their endeavour to achieve high yields and manage farming systems similar to those of the regional growers. As such, we will be examining the results and management issues from this farming system trial against those from a productive, progressive Cowra family farming enterprise.
Prior to sowing the cereal crop in 2017, soil samples were taken and analysed for chemical characteristics. It was determined that at the Greenethorpe site, lime would need to be applied to ameliorate the soil and increase the soil pH (CaCl2) to >5.5 in the surface 0–10 cm and >5.2 between 10–20 cm. A rate of 3.5 t/ha of lime was applied and incorporated to a depth of around 10 cm. The aim was to incorporate the lime deeper (> 15cm) at the Greenethorpe site, however due to the dry conditions, the offset discs were not able to penetrate deeper. To ensure that the early March sown treatments were able to be sown on time with sufficient surface soil moisture to ensure germination and plant emergence at the start of 2018, the Greenethorpe site was not cultivated following a rainfall event in January 2018. We envisaged that the alkalinity from the lime would move lower in the profile to 10–15 cm over the next few years with sufficient rainfall, however, due to 2018 and 2019 being decile 1 years, the subsoil (between 10–20 cm) remained acid. Following the wet (decile 9) year in 2020, in January 2021, a further 3.3 t/ha of lime was applied and incorporated to a depth of 26 cm using a Horsch-Tiger. It was the perfect time to incorporate lime given that the stubble loads in many of the systems was greater than 10t/ha. It was an effective method of managing the higher stubble loads while minimising loss of soil by erosion, and also incorporating lime to ameliorate acid subsoils.
2. Managing stubble in the Greenethorpe Farming Systems experiment
The team philosophy for managing stubble in our farming system experiment is to maintain the stubble if possible, so long as it doesn’t impact on the timeliness of sowing or crop emergence. The management of stubble starts at harvest with header setup. The aim is to ensure the stubble is cut at a height of 20cm, the chaff is smashed and spread evenly across the plot making it suitable for a tine air seeder. In the non-graze sections of the experiment, if stubble is still too thick, we mulched it not long after harvest to spread it over the plot evenly.
Our tined parallelogram air seeder with a coulter has been setup to handle large stubble loads, but different cropping systems require different strategies. As mentioned earlier, the aim of the Diverse systems is to sow a crop variety into a less antagonistic environment (i.e., fababean, chickpea or vetch into high cereal stubble load, canola into fababean stubble and then wheat into the canola stubble. The systems with large-seeded crops have had no problem emerging from the thick stubble, and there is less effect from slugs and invertebrate pests in the stubble. There is also some evidence that keeping standing stubble reduces the transmission of some diseases, such as Ascotyhta blight in chickpeas. Following the pulse crop, the quantity of cereal stubble has reduced significantly, and the canola crop is easily sown.
The high stubble loads have created the biggest problems in our Intense Baseline system with the canola-wheat rotation, especially sowing canola into a thick, Illabo stubble from crops that yielded 8–9 t/ha. The coulter in front of the parallelogram tine seeder worked well on all dry stubble but was less efficient when the brown manure vetch stubble was wet, or when the cereal stubble had rotted off at the base and the cereal stubble was wet, and especially where the tines were not able to stay in the inter-row. In these situations, mulching the stubble ensured timeliness of sowing. In our grazed systems, we can graze the stubble to reduce the stubble load or mulch if required. To date, we haven’t been required to burn stubble, but a late cool strategic burn would be implemented.
It must be acknowledged that in January 2021 after Phase 1, stubble across the entire experimental site was mulched and incorporated into the soil using a Horsch-Tiger mulcher, following the application of 3.3t/ha of lime. This was necessary to incorporate the lime to a depth of 10–20 cm. With large crop yields in 2020 and consequently high stubble loads (> 10 t/ha from 2020 grain crops only), it provided a good opportunity to both incorporate the lime and manage the high stubble loads from that season. We do not plan to incorporate the stubble using such a coarse method again, but it was essential to incorporate lime and remove a subsoil acid problem, and it should be considered by growers when trying to handle high stubble loads in a sustainable way while correcting soil chemical problems.
3. Key outcomes to date
The context – dry conditions in 2018 and 2019, wet conditions in 2020 to 2022. The amount of rainfall at the Greenethorpe site across the five seasons and the long-term mean are shown in Table 13.
Table 13. Rainfall at the experiment sites between 2018 and 2022 and the long-term median rainfall.
Site | 2018 | 2019 | 2020 | 2021 | 2022 | LTM |
|---|---|---|---|---|---|---|
Greenethorpe | 286 | 320 | 727 | 943 | 875 | 579 |
Annual profits – gross margins (GM)
Over the past five years, the average annual gross margins for different crop options in the grazed strategies varied between $1824 and $2327/ha/year and between $954 and $1610/ha/year in the non-grazed strategies (Figure 8). To determine the annual gross margins for the grazed and non-grazed treatments, all costs relating to sowing, harvesting and managing the crops have been included. However, there have been no livestock costs associated with determining the grazing income used in these gross margin calculations. The grazing income has been derived by estimating production per hectare in kilograms carcase weight (based on consumption) and multiplying this by a market price expressed in dollars per kilogram carcase weight. No livestock enterprise costs have been deducted.
To assist the reader to better understand what possible costs need to be removed from these gross margin values, the simplest way would be to envisage this grazing enterprise as a lamb trading one, i.e. where a grower buys and fattens lambs on the dual purpose crops over a 3-month period. Therefore, any costs associated with running the livestock trading venture such as selling costs, transport to and from market, livestock husbandry requirements, shearing costs, mortality and additional fencing and farm management would need to be deducted from income. Income in this analysis assumes livestock are purchased and sold at the same market value ($/kg cwt). Where lambs are purchased at a higher value than sale value per kilogram carcase weight, income will be lower than projected and where lambs are purchased at a lower value than the sale value per kilogram carcase weight income will be higher than projected in this analysis. The analysis is conducted at an operating level so financing costs are not included. For more information, on determining trading costs of valuing livestock or having lambs from your breeding livestock enterprise please read the paper by John Francis, Agrista, ‘Practicalities and economics of integrating dual purpose crops into the whole of farming operation in the medium rainfall zone’, GRDC Cowra Update, July 2023.
The overall high profits across all systems were underpinned by good fallow management to preserve the summer rain that fell (strict weed control and stubble retention), and the timely and successful establishment of good plant populations across the sites.
Diversity and profitability at Greenethorpe Farming Systems experiment 2018–22
In the non-grazed systems, the Intense Baseline high nitrogen was the most profitable treatment over the 5-year sequence to date (Figures 7 and 8). There was no significant difference between the average annual 5-year gross margin of the Diverse Low Value sequence of fababean-canola-wheat/ low nitrogen (2) and the two Intense Baseline strategies of wheat-canola with either low (2) or high nitrogen (7), but they were all significantly more profitable than the baseline system of canola-wheat-wheat sequence (Figures 7 and 9). The high canola price and high canola yields over the past three years has been a considerable driver in ensuring the canola-wheat sequence is very profitable, with 50% of the income being derived from canola. The profitability of the Diverse Low Value system is due to reduced nitrogen costs in the system, high fababean yields in all years except 2022 (where chocolate spot significantly reduced the grain yield) and high canola yields in the crop following the pulse. This reduction in overall gross margin in 2022 in the Diverse Low Value system is illustrated in Figure 8. Comparatively, the Intense Baseline non-grazed and even the Baseline high N systems were more profitable in 2022 due to high canola yields and/or the increase due to higher nitrogen (Figure 8).
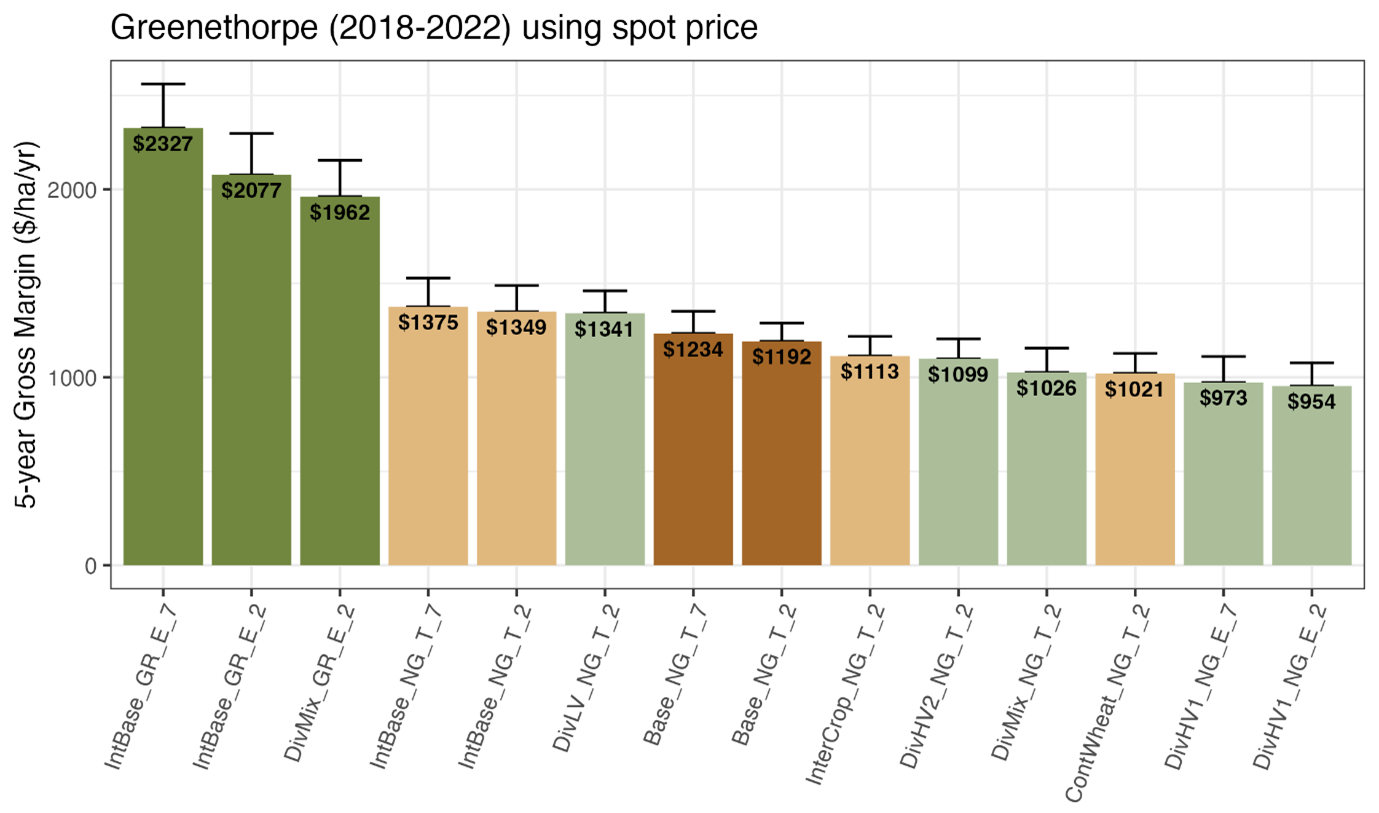
Figure 7. The 5-year average annual gross margin for all systems at the Greenethorpe Farming Systems trial between 2018 and 2022, using spot grain prices at harvest, with standard error for each sequence.
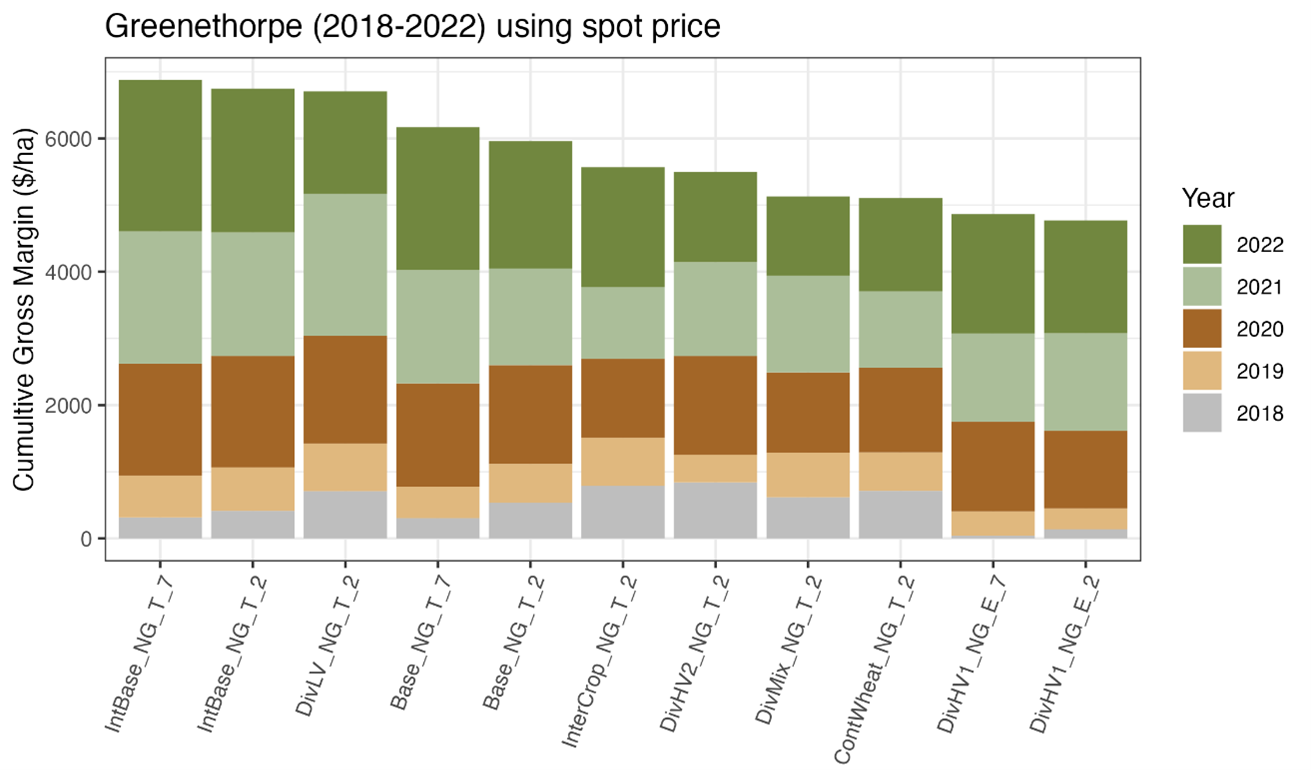
Figure 8. The 5-year cumulative gross margin with individual annual average shown in different colours for non-grazed systems only at the Greenethorpe Farming Systems trial between 2018 and 2022, using spot grain prices at harvest.
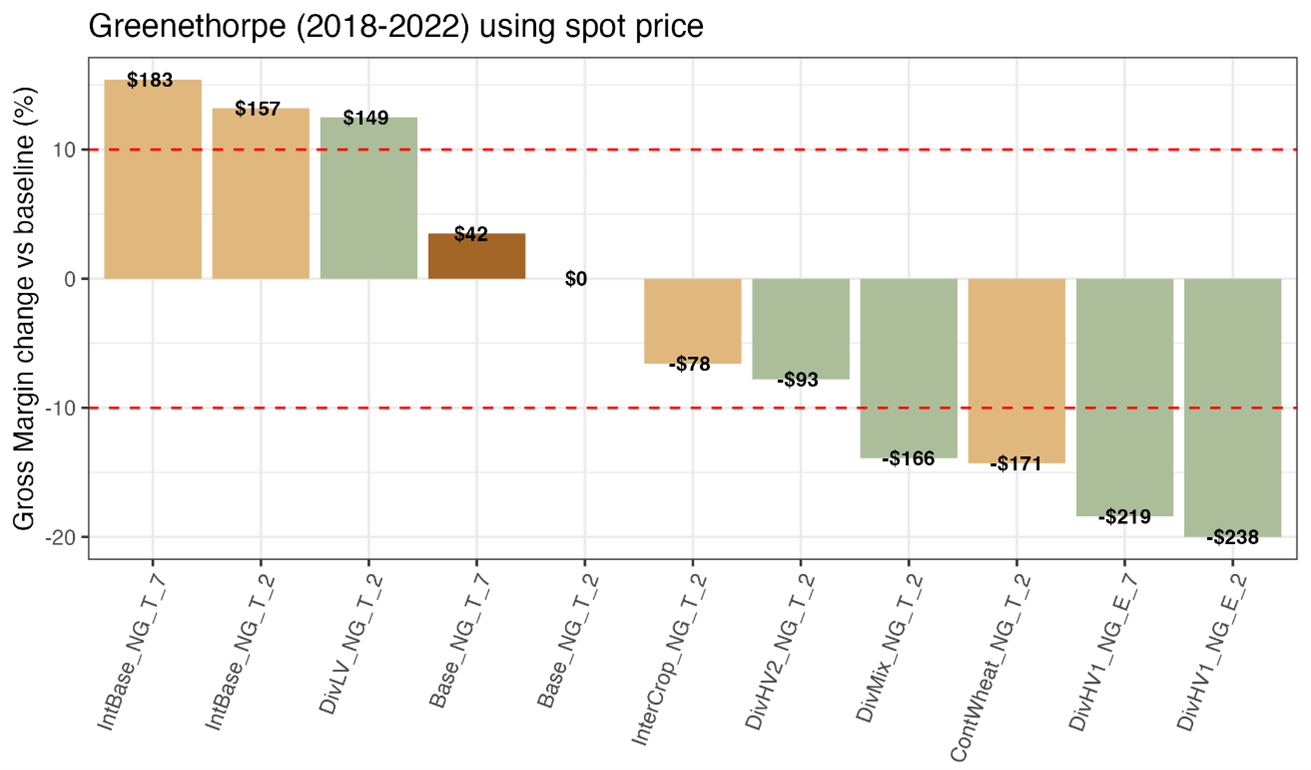
Figure 9. The difference in the 5-year average annual gross margin between the baseline treatment and all other non-grazed systems at the Greenethorpe Farming Systems trial between 2018 and 2022, using spot grain prices at harvest.
Comparison of the gross margins from the Greenethorpe Farming Systems experiment and a prominent Cowra farming family enterprise
Across the first five years of the Greenethorpe farming systems experiment, there is a slight increase in 5-year annual gross margin of $42 and $26/ha/year with the high nitrogen strategy in the Baseline and Intense Baseline systems, respectively. However, there was an associated increased risk resulting in a lower profit: cost ratios of 1.9 cf 1.75 (Table 14). Although the Diverse Low Value system didn’t have the highest total income, it had lower total costs compared to the Intense Baseline farming systems and a higher profit:cost ratio, meaning it is a less risky system (Table 14).
At the Greenethorpe Farming Systems experiment, the average 5-year total income in both the Diversified and the Intense Baseline systems was similar to that in the Cowra farming enterprise, with income close to or just over the $2000/ha/year (Tables 14 and 15). The Diverse farming systems in the experiment and the grower enterprise had similar gross margins ($1341/ha/year cf $1148/ha/year), but the gross margin in the Intense Baseline system in the Cowra farmer enterprise was significantly lower than the experimental results ($894/ha cf average $1362 in trial) (Tables 14 and 15). In both the Greenethorpe Farming System experiment and the Cowra farming enterprise, the Diverse system was profitable but also had the highest profit:cost ratio, meaning it was less risky.
To improve the comparison between the results in the Diverse Mixed systems of the Greenethorpe experiment and the Cowra farming enterprise, we need to examine the two bottom rows in Table 14 and compare against Table 15. All grazing income from the three crops (vetch, wheat and canola) in the 3-year rotation over the past 5 years has been removed (second bottom row, Table 14), and on the bottom row of Table 14 all results only relate to the last 3 years (2020–2022) in the Greenethorpe Farming Systems experiment. When all grazing income was removed from the Greenethorpe experiment, the average total income, total costs, gross margins and profit:cost ratio over the past 3 years in the experiment were similar to that of the Cowra Farming Enterprise (Tables 14 and 15).
Table 14. The average 5-year Total Income, Total Costs, Gross margins and Profit:Cost ratio between four farming systems strategies/treatments at the Greenethorpe Farming system Trial (2018-22).
Treatment | Graze strategy | Time of sowing | Nitrogen Strategy | Annual average (5-year 2018–22) | |||
|---|---|---|---|---|---|---|---|
Total income ($/ha) | Total costs ($/ha) | Gross margin ($/ha) | Profit:cost ratio | ||||
Baseline | No graze | Timely | Low | 1816 | 624 | 1192 | 1.9 |
Intense baseline | No graze | Timely | Low | 2057 | 708 | 1349 | 1.9 |
Diverse mix | Graze | Early | Low | 2552 | 590 | 1962 | 3.4 |
Diverse mix (grazing income removed) | Graze | Early | Low | 1077 | 590 | 487 | 0.7 |
Diverse mix 2020-22 | Graze | Early | Low | 1360* | 665* | 695* | 0.8* |
* Note: Diverse mix 2020-22 (grazing income removed) = 3-year average data from 2020-2022
Table 15. The average 3-year gross margin for three different crop sequences from a Cowra farming enterprise (systems re-named to compare with the Greenethorpe Farming Systems experiment.
Average over three years | Diversified system | Intense baseline | Diversified mixed |
|---|---|---|---|
Costs | |||
Total costs ($/ha) | 2670 | 3267 | 2436 |
Average costs ($/ha/yr) | 890 | 1089 | 812 |
Income | |||
Total income ($/ha) | 6115 | 5950 | 4235 |
Average income ($/ha/yr) | 2038 | 1983 | 1411 |
Gross margin ($/ha) | 1148 | 894 | 599 (+ grazing value) |
Profit:Cost ratio | 1.3 | 0.82 | 0.74 (plus grazing value) |
Concluding summary on diversity
The economic results from the Greenethorpe Farming Systems experiment are similar to that of the Cowra farming enterprise, particularly for the Diverse rotation and in the Diverse Mix rotation once the grazing income was removed from the Greenethorpe experimental results. However, the costs associated with growing and managing a crop sequence can often be different between growers and locations due to the influence of enterprise structures and various farm-scale constraints. All costs associated with our research sites are available for comparison in our database. It is often hard to compare cropping systems where grazing of dual-purpose crops is involved because growers may graze with ewes or cows rather than to fatten lambs or weaners for market, and the cost structures in mixed enterprises are difficult to allocate to crop and livestock components. In comparing grazing systems, it may be more realistic to remove all grazing profits from the calculations, and simply indicate the gross margins plus the grazing DSE/ha/days if possible.
In the farming systems experiment managed at Temora from 2014–18 where we compared disc and tine farming systems, the data from the experiment was then scaled-up to a whole farm analysis by John Francis (Agrista). The results from the whole farm analysis at a 3000 ha and 5000 ha cropping scale found that one of the main drivers of profitability in the whole farm related to the efficiency of the business i.e., it was paramount that the farm enterprise was matched to the labour/plant/equipment for maximum efficiency. Once a business is managed at a high level of efficiency, changing management strategies to a diverse strategy was an effective and profitable strategy for growers. The yields attained from the trial were then very representative of the scaled-up whole-farm level.
A diverse cropping system (canola-wheat-pulse) was not only profitable but reduced the volatility compared to an Intense Baseline system at the whole farm level. As part of planned activities CSIRO and NSWDPI will work to scale up the results from our research experiments to the whole farm level.
Conclusion
This paper has presented the results from numerous farming systems experiments to outline several ways to flexibly manage stubble in different farming systems to ensure profitability and sustainability. It is extremely important for farmers to NOT compromise managing weeds, disease, pests or sowing time due to excessive stubble loads. Pro-active management of stubble commenced before harvest and continued until sowing the following year will ensure suitability for the seeding system. By diversifying a crop rotation (increasing the number of pulse crops and barley), deep banding nitrogen or adding 5 kg N/t cereal stubble at sowing, managing stubble by mulching, baling, incorporating + nutrients or grazing, it is easier to manage stubble without the need to burn. However, if the stubble load remains too large or the potential weed/disease/pest burden remains too high, then a one-off strategic late burn can be used to ‘re-set’ the system. Farmers should think about stubble as a source of C for the microbes, not N for crops, and if possible, find ways of converting that energy source into humus.
Useful resources
Maintaining profitable farming systems with retained stubble
References
Bond J and Willis W (1970) Soil Water Evaporation: First Stage Drying as Influenced by Surface Residue and Evaporation Potential, Soil Science Society of America Journal, vol.34, issue.6, pp.924-928, 1970.
Dalgliesh N (2014) presentation based on data from: Freebairn DM, Hancock NH and Lott SC (1987) Soil evaporation studies using shallow weighing lysimeters, techniques and preliminary results. Transactions of Mechanical Engineering. Vol. ME12. pp 67–72.
Francis, John (Agrista). Practicalities and economics of integrating dual purpose crops into the whole of farming operation in the medium rainfall zone. GRDC Update Cowra, July 2023.
Hart PBS, Powlson DS, Poulton PR, Johnston AE and Jenkinson DS (1993) The availability of the nitrogen in the crop residues of winter wheat to subsequent crops. The Journal of Agricultural Science 121 (3) pp. 355–362.
Hunt J, Browne C, McBeath T, Verburg K, Craig S and Whitbread A (2013). Summer fallow weed control and residue management impacts on winter crop yield through soil water and N accumulation in a winter-dominant, low rainfall region of southern Australia. Crop & Pasture Science, 64, 922–934
Hunt JR, Swan AD, Breust PD, Peoples MB and Kirkegaard AJ (2016a) Sheep grazing on crop residues increase soil mineral N and grain N uptake in subsequent wheat crops.
Hunt JR, Swan AD, Fettell NA, Breust PD, Menz ID, Peoples M and Kirkegaard JA (2016b) Sheep grazing on crop residues do not reduce crop yields in no-till, controlled traffic farming systems in an equi-seasonal rainfall environment. Field Crops Research 196, 22-32.
Kirkby CA, Richardson AE, Wade LJ, Conyers M and Kirkegaard JA (2016) Inorganic Nutrients Increase Humification Efficiency and C-Sequestration in an Annually Cropped Soil. https://doi.org/10.1371/journal.pone.0153698
Kirkegaard JA (1995) A review of trends in wheat yield responses to conservation cropping in Australia. Australian Journal of Experimental Agriculture 35, 835-848.
Kirkegaard J, Hunt J, Peoples M, Llewellyn R, Angus J, Swan T, Kirkby C, Pratt T and Jones K (2017) Opportunities and challenges for continuous cropping systems. GRDC Updates in Adelaide, Wagga and Bendigo.
Kirkegaard J, Swan T, Hunt J, Vadakattu G and Jones K (2018) The effects of stubble on nitrogen tie-up and supply. GRDC Updates Wagga, Dubbo, Campelltown, Walpeup & West Wyalong.
Scott BJ, Eberbach PL, Evans J and Wade LJ (2010) Stubble retention in cropping systems in southern Australia: Benefits and challenges, EH Graham Centre Monograph No 1
Scott BJ, Podmore CM, Burns HM, Bowden PI and McMaster CL (2013) Developments in stubble retention in cropping systems in southern Australia. Report to GRDC on Project DAN 00170. (Ed. C Nicholls and EC (Ted) Wolfe). Department of Primary Industries, Orange NSW pp 103. Available at:
Swan T, Breust P, Brown, C, Cook A, Gontar B, Hunt J, Jones K, Kirkby C, McMillan H, Nash M, Noack S, Potter T, Rheinheimer B, Scheef C, Scholz N, Turner F and Kirkegaard J (2017a) Maintaining profitable farming systems with retained stubble across various rainfall environments in SA, Victoria and central and southern NSW. GRDC Updates in Adelaide, Wagga and Bendigo.
Swan AD, Hunt JR, Breust PD, Pratt T, Rheinheimer B, Jones K and Kirkegaard JA (2017)b. The effect of grazing and burning stubbles on wheat yield and soil mineral nitrogen in a canola-wheat-wheat crop sequence in SNSW.
Swan T, Kirkegaard J, Rheinheimer B, Jones K, Fritsch C and Hunt J (2017b) A flexible approach to managing stubble profitably in the Riverina and Southwest Slopes of NSW. GRDC Update Grenfell.
https://grdc.com.au/resources-and-publications/grdc-update-papers/tab-content/grdc-update-papers/2017/08/a-flexible-approach-to-managing-stubble-profitably-in-the-riverina-and-southwest-slopes-of-nsw
Verburg K, Bond WJ and Hunt JR (2012) Fallow management in dryland agriculture: Explaining soil water accumulation using a pulse paradigm. Field Crops Research 130, 68–79.
Verburg K and Whish J (2016) Drivers of fallow efficiency: Effect of soil properties and rainfall patterns on evaporation and the effectiveness of stubble cover. GRDC Update paper
Acknowledgements
The research undertaken as part of this project is made possible by the significant contributions of growers through both trial cooperation and the support of the GRDC — the authors would like to thank them for their continued support.
I would also like to acknowledge all the collaborating scientists, technicians, staff, farmers and consultants from all of the organisations and groups who have contributed significantly in terms of their time and research capability to each farming systems group to ensure the project in their region is producing the highest quality of research.
Contact details
Tony Swan
CSIRO Agriculture and Food, Clunies Ross St Acton, Canberra ACT 2601
Mobile: 0428 145 085
Email: tony.swan@csiro.au
Twitter: tony_swan64
Date published: July 2023
Varieties displaying this symbol beside them are protected under the Plant Breeders Rights Act 1994
® Registered trademark
GRDC Project Code: CSP1306-003RTX, CSP00178, CSP1703-007RTX, CSP2110-004RMX, CSP2302-011RTX, SFS1507-003RTX, RPI1306-001RTX, MFM1306-001RTX,
Was this page helpful?
YOUR FEEDBACK

