Seasonal forecasts and the implications for growers
Seasonal forecasts and the implications for growers
Author: Dane Thomas, Peter Hayman and Bronya Cooper (SARDI Climate Applications) | Date: 26 Jul 2023
Take home messages
- Seasonal climate forecasts have become increasingly sophisticated in recent years
- Forecasts are available for the coming weeks, fortnightly periods, months and 3 monthly periods
- Past accuracy of seasonal forecasts shows that autumn and spring forecasts of rainfall on Eyre Peninsula are more reliable than summer and winter rainfall
- Seasonal forecasts can assist growers to make better climate risky decisions
Introduction
Every year, grain growers make climate risky decisions. A climate risky decision is one where best choice is only known after the season has unfolded. Seasonal forecasts are one tool that can help. Recently the Bureau of Meteorology is providing these seasonal forecasts for more time periods (weeks, fortnights, months and seasons) and more information such as the chance of the being wetter/drier or cooler/warmer than the top or bottom two deciles rather than just above or below median (Bureau of Meteorology Climate Outlooks http://www.bom.gov.au/climate/outlooks/#/overview/summary). These climate outlooks, seasonal or long-range forecasts reflect known impacts from several significant climate drivers.
The most recent outlook at the time of writing (issued 13 July 2023) and using the most recent information on climate drivers (issued 4 July 2023) stated the El Niño–Southern Oscillation (ENSO) outlook is at El Niño Alert. The Bureau's climate model suggests El Niño development during winter, which increases the chance of below average rainfall for the eastern half of Australia and above average daytime temperatures for the southern two-thirds of Australia. While the Indian Ocean Dipole (IOD) is currently neutral, the Bureau's climate model suggests positive IOD development during winter which typically supresses rainfall over much of Australia, and if it coincides with El Niño, can exacerbate El Niño's drying effect.
The outlooks also consider the Southern Annular Mode (SAM) index which is expected to remain negative for the next two weeks before returning to neutral conditions. A negative SAM typically increases rainfall across parts of south-west and south-east Australia, while a neutral SAM has little influence on Australian climate.
The outlooks also consider longer term trends such as the observation that southern Australia has seen a reduction, by 10 to 20%, in cool season (April to October) rainfall in recent decades. The most detailed climate outlooks (issued 13 July 2023) suggest for the August to October period, below average rainfall is likely (greater than 60 to 80% chance) for most of Australia increasing to very likely (greater than 80% chance) for large parts of Victoria and south-east SA; and that above median maximum and minimum temperatures are likely (more than 60% chance).
Despite the developments and information provided in seasonal forecasts, the probabilistic seasonal climate forecasts are not always used, or are used with a degree of scepticism. Figure 1 explores why seasonal climate forecasts may not be fully utilised. Some of the possible reasons for forecasts not being widely used fall into broad categories (Figure 1, upper level). First, while it is unlikely that growers and agronomists are unaware of forecasts, in many cases they are not aware of some of the recent developments of more time periods (weeks, fortnights, months and seasons) and the new developments in the chance of being wetter/drier or cooler/warmer than the top or bottom two deciles.
Second, growers may be aware, but are not convinced of the usefulness. Some growers and agronomists are concerned that forecasts don’t offer value, usually because the skill of the forecast is judged as too low. This may come from experience of applying the forecast and having unfavourable seasonal conditions that year. Another factor is that growers may have a view that ENSO climate drivers (El Niño, La Niña) or Indian Ocean Dipole (IOD) don’t have an impact on the Eyre Peninsula (EP).
The second level is an attempt to further investigate why growers might be aware but not convinced of the value. Growers and advisers are busy and there are many factors that compete for their attention. There may be a long list of other areas of the farmer’s professional and personal life with better return on effort and attention than using seasonal forecasts to manage climate risk. The related factors of difficulties in understanding and using probabilities in decision making is clearly a barrier. Finally, it may be that the forecasts are simply judged as not offering a large enough shift in the odds. This raises the question of how good are these seasonal forecasts?

Figure 1. Simple root cause analysis for actual use of probabilistic seasonal forecasts being lower than the potential
Maps of past accuracy (Figure 2) indicate that autumn and spring forecasts on the EP are more reliable than summer and winter. Measuring skill with a simple statistical forecast such as the southern oscillation index (SOI) is relatively simple compared to measuring skill with a dynamic forecast such as ACCESS-S2. It is very expensive in terms of computing time to run the dynamic model and hence the hindcasts are a much smaller sample than the operational forecast. Furthermore, the observing systems in the oceans and atmosphere are improving all the time. Hence, a model that uses the deep ocean will not be able to be initialised for the El Niño events in the 1980s.
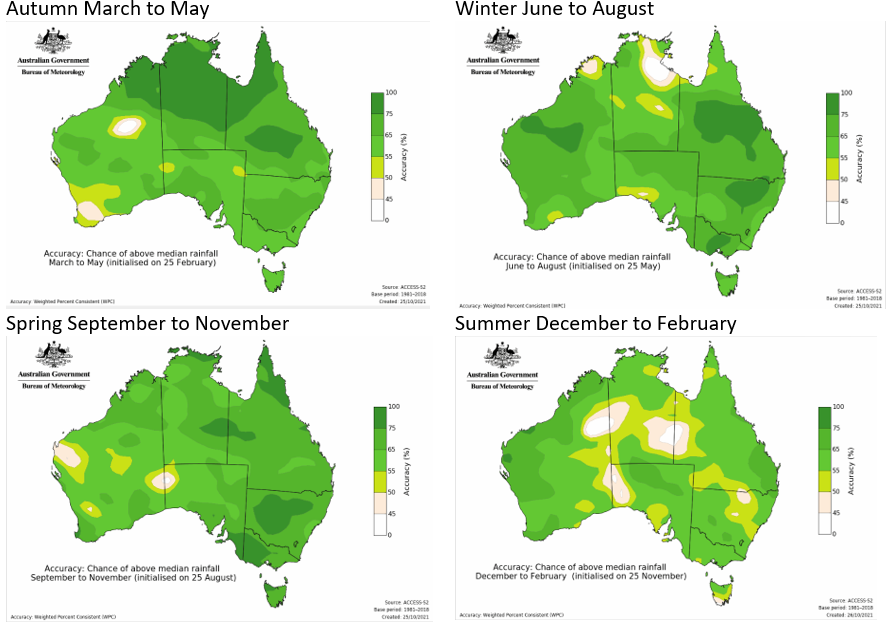
Figure 2. Past accuracy for above median rainfall according to the ACCESS-S2 model for autumn (March to May), winter (July to August), spring (September to November) and summer (December to February). Sourced (29 June 2023) from Bureau of Meteorology.
Maps in Figure 3 show the forecast and map of actual deciles for winter (June to August) and spring (September to November) in the past 10 years. Comparing these maps of the forecast and maps of actual deciles enables a comparison as hits (forecast for increase chance of dry and region was dry) and misses. It also shows cases where rainfall across the region was patchy.
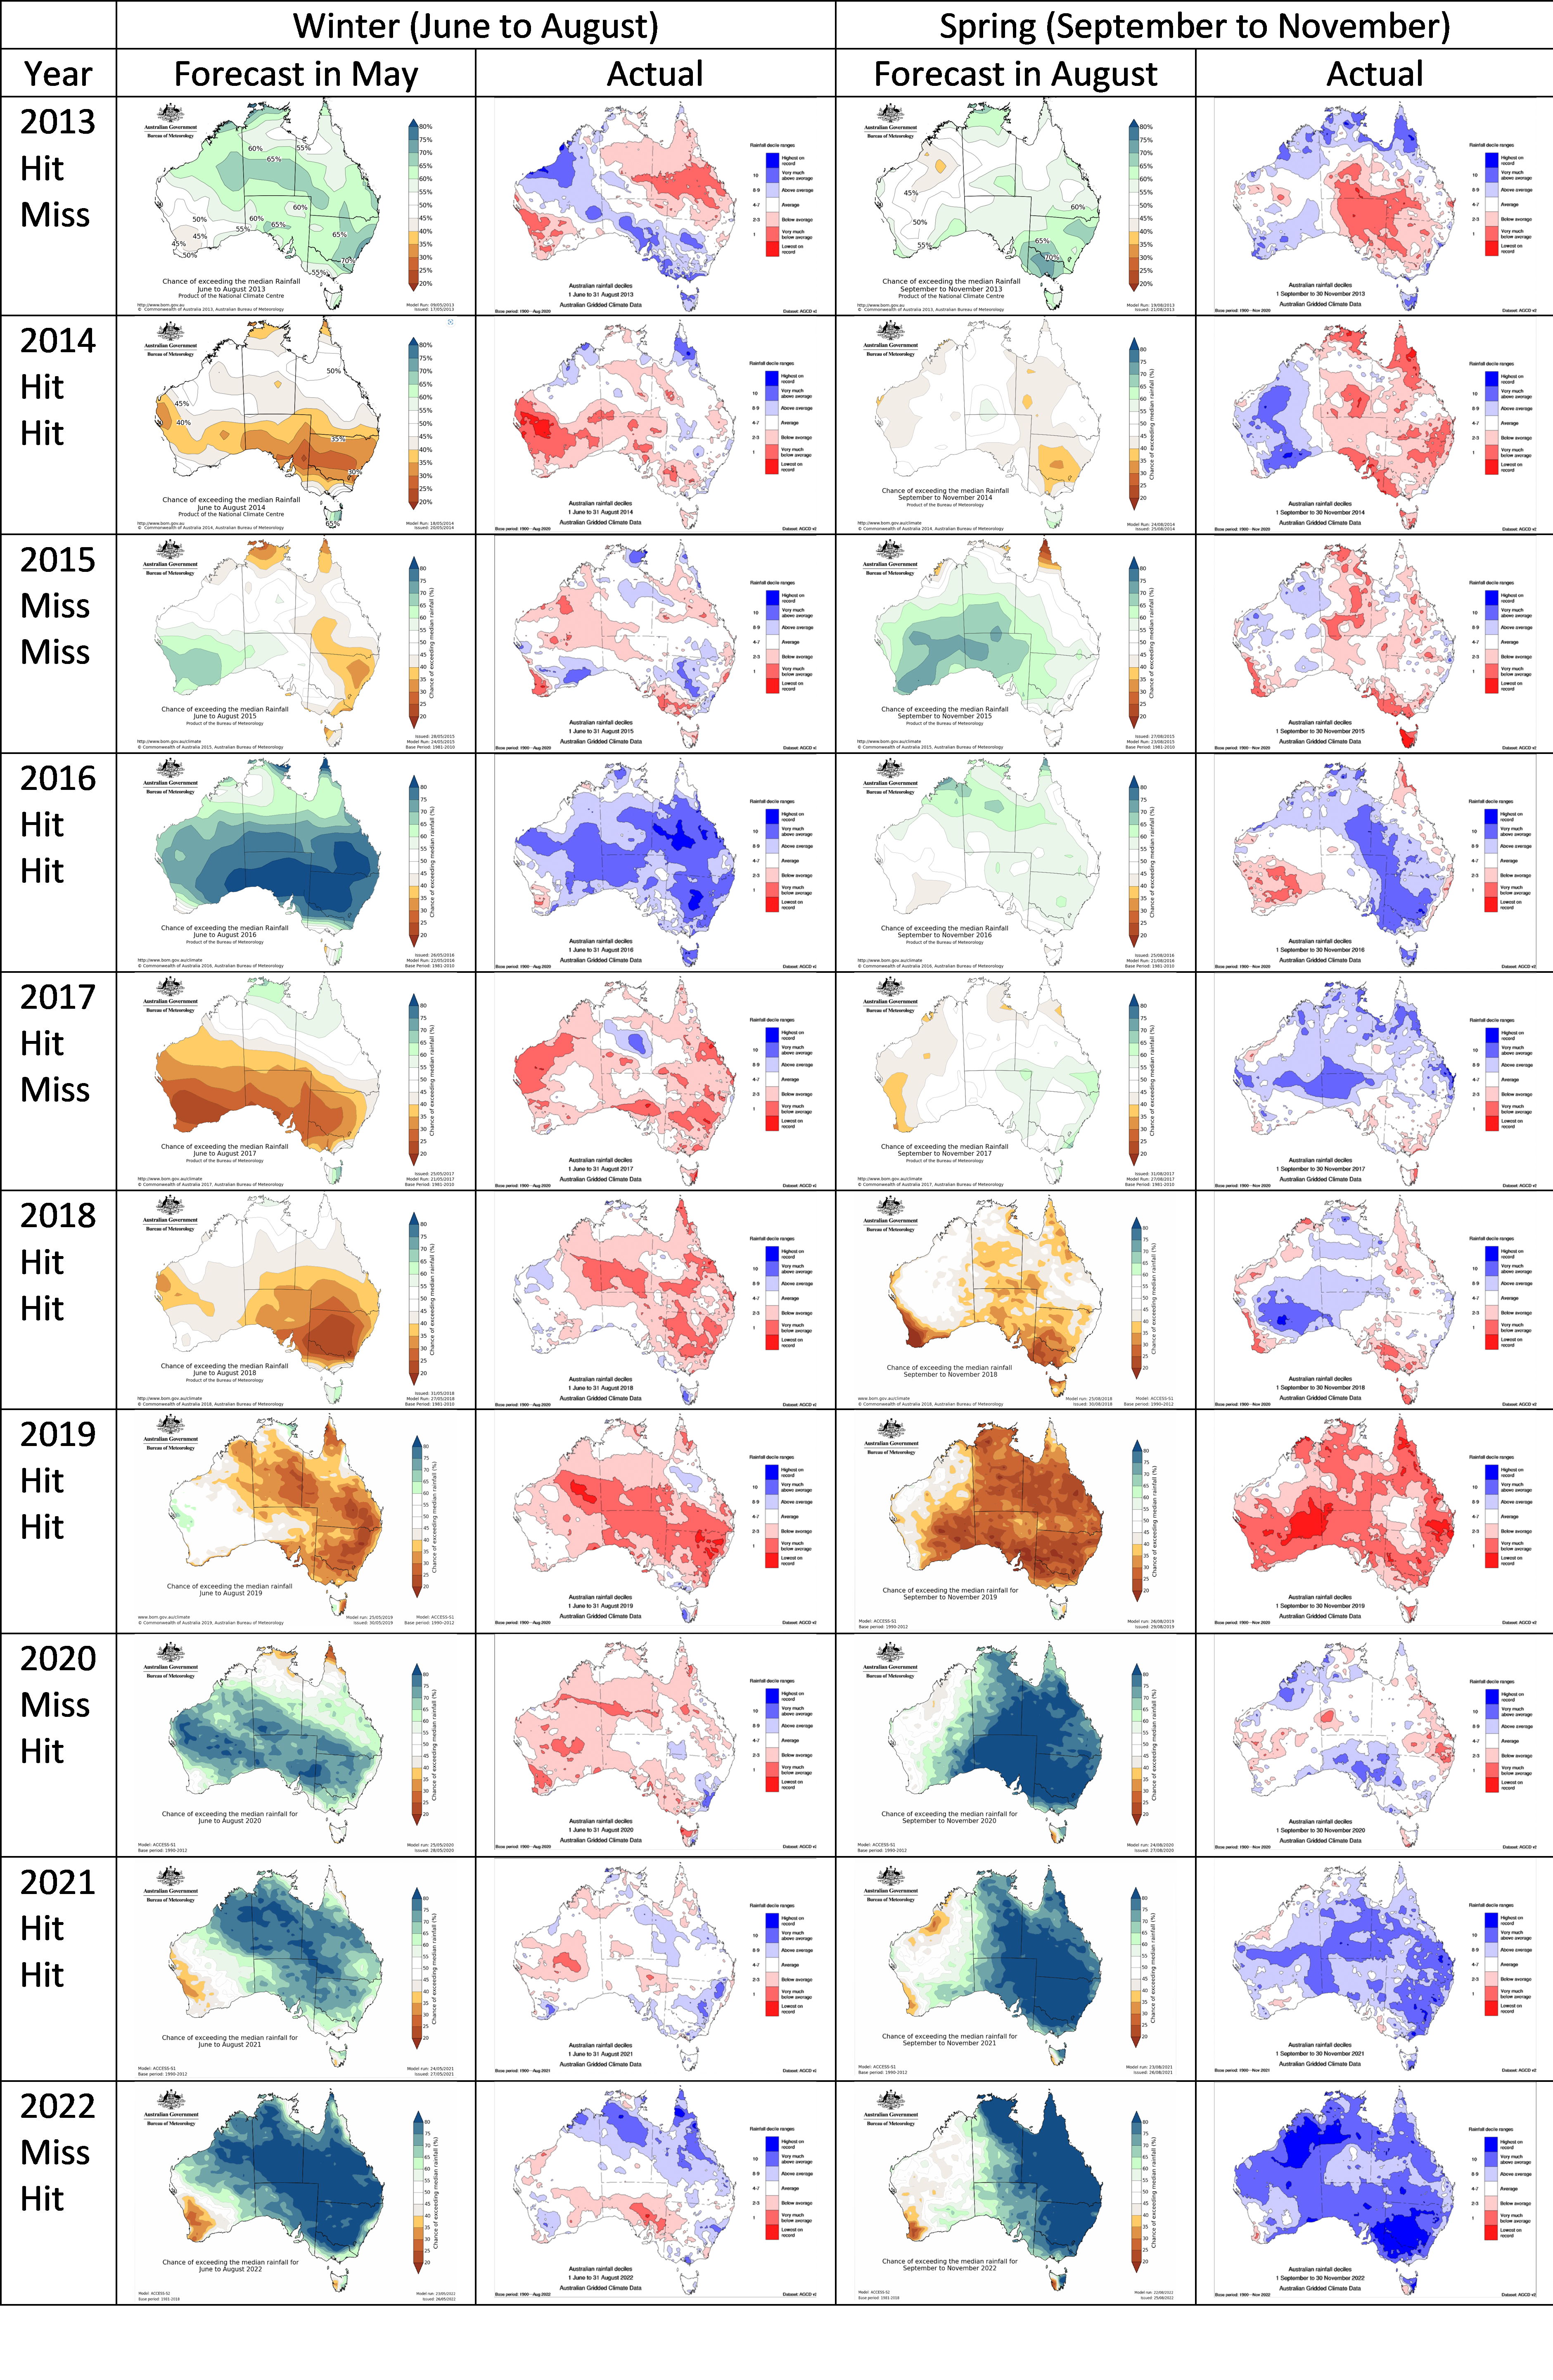
Figure 3. Maps of forecast outlooks and actual deciles of rain for winter (June to August) and spring (September to November). Outlooks sourced (29 June) bom.gov.au/jsp/sco/archive/ Actual rainfall sourced (29 June 2023) bom.gov.au/climate/maps/rainfall/ Before August 2018 the outlooks used the Bureau’s POAMA model, then Access-S1, then Access-S2 from 2022.
For SE Australia, of the 10 years there were two clear misses in spring (2013, 2015) and one in winter (2020), and three partial misses (winter 2015, spring 2017) where neutral conditions were forecast but drier conditions eventuated, and winter 2022 where wetter conditions was forecast and neutral conditions eventuated.
There were 14 clear hits comprising of hits in winter (2013, 2014, 2016, 2017, 2018, 2019, 2021) and spring (2014, 2016, 2018, 2019, 2020, 2021, 2022). For the EP, the clear misses in winter and spring also occurred while the two partial misses in SE Australia were hits on the EP. However, there were two partial misses on the Eyre Peninsula (winter 2014, winter 2018) when dry conditions were forecast but neutral conditions eventuated. Overall, the seasonal forecasts of winter and spring rainfall have been useful guidance to SE Australia and the EP.
For the SE region and the EP, several outlooks could be considered a failure to warn, meaning that the forecast outlook was for wet conditions, but the seasonal rainfall was low. This could be considered worse than a ‘false alarm’ (a dry condition is forecast but the season is wet such as spring 2016 in SE Australia), especially if the wider region is dry and the local area was average.
There has been increasing media discussion and GRDC funded communication on the impact of climate drivers such as ENSO and the Indian Ocean Dipole on winter growing season rainfall in Southern Australia. Sites such as forecasts4profit (https://forecasts4profit.com.au/) show that these climate drivers swing the odds and are best represented as probabilistic forecasts. For example, a La Niña is best understood as increasing the likelihood of wetter deciles and decreasing the likelihood of dry deciles rather than the easier to follow statement that it will be wet. There is a strong tendency for media to simplify the message to a negative IOD will lead to wet conditions. This simple causal thinking is easier to understand and more natural for most of us.
In contrast, probabilistic thinking is harder work. An El Niño in 2015, the subtropical ridge and SAM in 2017 and 2018 and the negative IOD in 2019 supported causal thinking. The media coverage of 2020 was framed around a bounce back to a good year after the widespread drought and bushfires that ended 2019.
What does this mean for communicators and users of climate forecasts?
1. Remember that the skill of the forecast increases from a low base through the winter growing season.
The skill of seasonal climate forecasts comes from the main climate drivers of ENSO and IOD which haven’t settled into a neutral, positive or negative phase until later in the growing season. Graeme Anderson (Ag Vic) has the useful analogy of following a football team where there is a lot of pre-season speculation which starts to firm up as the season progresses. Sometimes the consistency of models in April and May suggest increased odds of a wetter than average growing season tend to over-shadow the point that all models have low skill at this time of the year and that models can be consistently wrong.
2. Because dynamic seasonal forecasts are influenced by new developments in the ocean and atmosphere during the season, we need to check the latest update.
The reason why the skill of the forecast is low in autumn is because patterns in the ocean and atmosphere evolve over the season. These processes move at different time scales. As mentioned earlier, the Bureau of Meteorology is issuing more forecasts (weeks, fortnights, months and seasons) which are updated more often. It is obviously an advantage for forecasts to be updated with the latest information, but this can be a challenge for busy users to keep up. GRDC has funded the monthly Fast Break newsletter from Ag Victoria to comment on South Australian conditions (https://grdc.com.au/news-and-media/newsletters/fast-break/south-australia). This is useful for updates as it provides clear explanations with a summary of models.
3. Appreciating that even 80% chance of above median rainfall includes 20% chance of the opposite happening.
Seasonal climate forecasts from the Bureau of Meteorology are rarely more emphatic than 80% chance of exceeding the median rainfall. Although a high number, 80% has a 1 in 5 chance of drier than median rainfall. This chance of the minority outcome is nowhere near the level used in most agricultural experiments (95%) which is 1 in 20 chance of the result being due to chance. Most AgVet chemicals set a much higher level (99% or 1 in 100) of the treatment working and in human health we are used to chances of 1 in 1000 and in aviation safety 1 in 10 million.
The 80% chance is more like a professional golfer missing a five-foot putt (compared to 99.4% for three feet, 91.4% for four feet and 60% for six feet). This is also about the chance of a penalty shoot-out in professional soccer (83%). Watching a professional golfer or penalty shoot-out is interesting because it is uncertain. Even if we know the statistics it remains uncertain and interesting. We don’t say “because there is more than 80% chance the result is guaranteed and I won’t bother watching” rather, if we care about the results, we think about the two possible outcomes even though one is much more likely than the other.
Useful resources
Bureau of Meteorology. Climate driver update.
Bureau of Meteorology. Climate Outlooks.
GRDC Break newsletter on South Australian conditions.
Contact details
Dane Thomas
GPO Box 397 Adelaide SA 5001
08 8429 0670
dane.thomas@sa.gov.au
GRDC Project Code: CSP2303-015BGX,