Distribution of nitrates and its effect on plant uptake efficiency in Central Queensland farming systems
Author: Douglas Sands (DAF Qld), David Lester (DAF Qld), Darren Aisthorpe (DAF Qld) | Date: 29 Nov 2023
Take home messages
- Crops such as wheat, chickpea and mungbean can utilise up to 85% of the nitrates contained in the 10 – 60cm of the soil profile under Central Queensland cropping conditions.
- Rates of nitrogen fertiliser applied, and intensity of rainfall (number of events x amount x timing) are the key criteria in the distribution of nitrates in the soil profile.
- Fallow length is not as critical to distribution of fertiliser nitrogen as application rate and rainfall but does increase mineralisation and distribution of nitrates derived from organic matter.
Introduction
Over the last decade, it has become clear that there are several factors influencing the efficient uptake of nitrogen (N) by dryland crops grown on high clay-content, vertosol soils. These factors have been consolidated into four major categories: rate, timing, source and placement. Across all these factors, uptake efficiency by plants is intrinsically tied to the soil water capacity of the soil. Furthermore, the distribution and concentration of nitrates in the soil profile is dependent on the accumulation of soil water in the profile.
This paper will examine the relationship between water uptake and nitrate uptake in the crop and give practical examples of what has been observed in typical Central Queensland (CQ) cropping scenarios.
Background
The data presented in this paper has been taken from two GRDC funded field trial projects, the Companion Cropping project (DAQ2104-006RTX)and the Mungbean Agronomy project (DAQ2104-006RTX).
There were two experiments conducted in the companion cropping project and the results of the first experiment which ran from May of 2021 to October of 2022 have been used in this paper.
This experiment was designed to test the production outcomes of planting two crops (wheat and chickpeas) together at the same time either in alternate rows or mixed together in the same row. Other outcomes tested included what the fallow efficiency of the companion treatments were and whether there were any impacts on the uptake or cycling of soil nitrates. There were 12 treatments in this experiment including a wheat monocrop and a chickpea monocrop to act as benchmark controls for the other 10 companion crop treatments. It is the soil water and soil nitrate data from these two monocrop treatments that will be presented in this paper.
Sampling included taking soil cores in:
- May/June 2020 (planting)
- November 2020 (after harvest and start of fallow)
- June 2021 (planting and end of fallow)
- November 2021 (after harvest).
The main companion cropping experiment was planted and harvest in 2020 but a cover crop of wheat was planted in the following year across all the original plots. This was done to assess the yield impacts of the preceding companion cropping treatments and the efficiency of the intermediate fallow period on both stored water and soil nitrates. The mean data (five reps) from the wheat monocrop and chickpea monocrop treatments only, is presented in this paper.
The mungbean agronomy project had two experiments designed around testing mungbean yield response to nitrogen fertiliser application (mungbean N response). These experiments were conducted in the 2019-20 and 2020-2021 summer seasons. In these experiments there was a common range of applied nitrogen treatments which started at 30 kg N/ha up to 150 kg N/ha. These treatments were applied directly as a banded application after wheat harvest in late October of the previous year and were left fallow until mungbean planting in February of the following year.
The second experiment in 2020-2021 had two additional treatments that explored the impact of a much longer fallow on the soil nitrate profile. These long fallow treatments had no wheat planted in the previous winter which ensured an eight-month fallow as opposed to a three-month fallow for all the other treatments. Soil cores were taken at the start and end of each of these fallow periods to assess both soil water and soil nitrate accumulation.
While these experiments were primarily designed around testing for nitrogen fixation levels in the crop when planted on increasing levels of soil nitrate, some interesting data has been extracted from these trials showing the change in soil nitrate levels down the profile over different fallow periods and N application rates.
The data from both projects shows some contrast in the level of extracted nitrates from the profile between a shallow rooted crop (mungbeans) and deeper more robust root systems such as chickpea and wheat.
Key criteria for soil nitrate uptake in crop
There are many examples of the relationship between soil water and soil nitrates in the literature and this is underpinned by the concept that the mechanism of nitrate uptake in the plant is through mass flow. Nitrate is a mobile compound that dissolves in water and consequently is moved by water. As the plant root absorbs water it also absorbs nitrate in whatever concentration that nitrate happens to be in the soil water at the time. As the plant root depletes the water immediately around itself then more water moves into that zone from the surrounding bulk soil. In clay soils there is a particularly strong concentration gradient that underpins the capillary action so the plant can effectively draw water from a relatively large soil area and with this comes dissolved nitrates.
This means that the efficiency of water uptake by the plant is intrinsically linked to the efficiency of nitrate uptake. There are modifying factors to this concept in relation to root mass and root depth as well as whether the plant is a legume and can derive some of its N from the atmosphere through rhizobial N fixation.
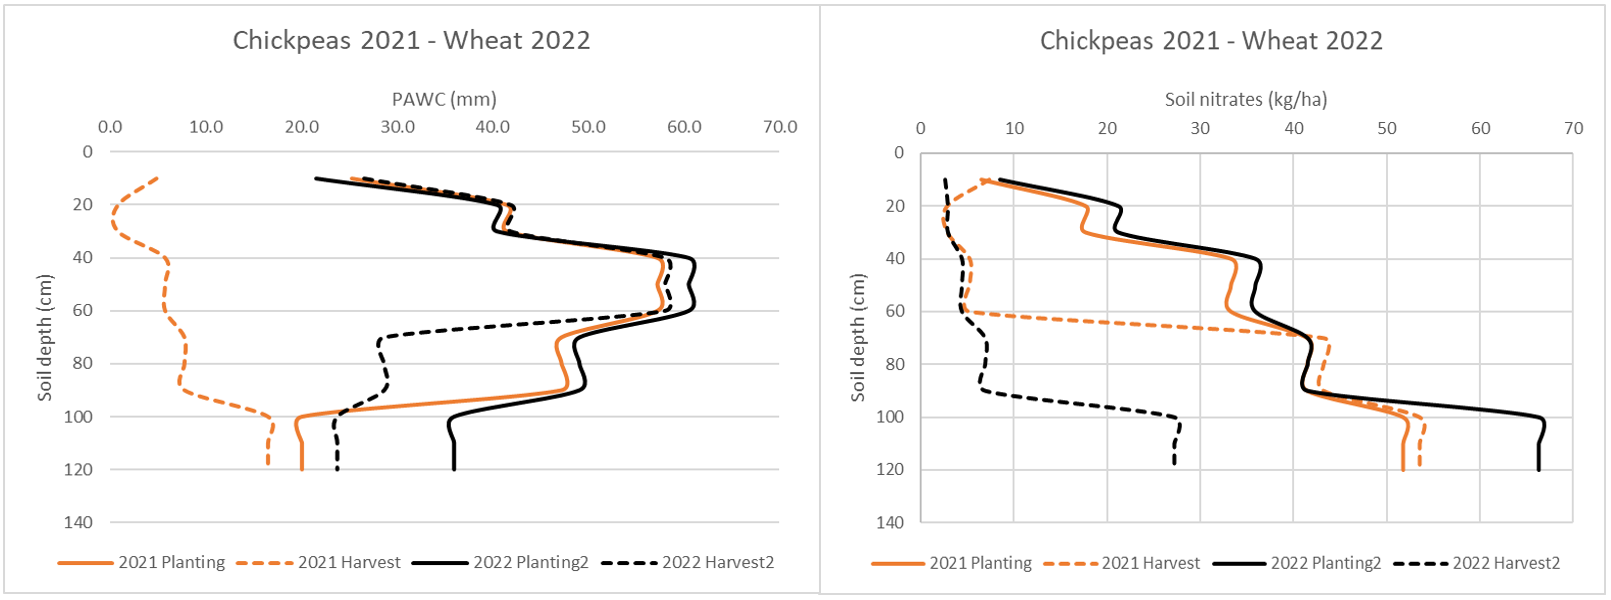
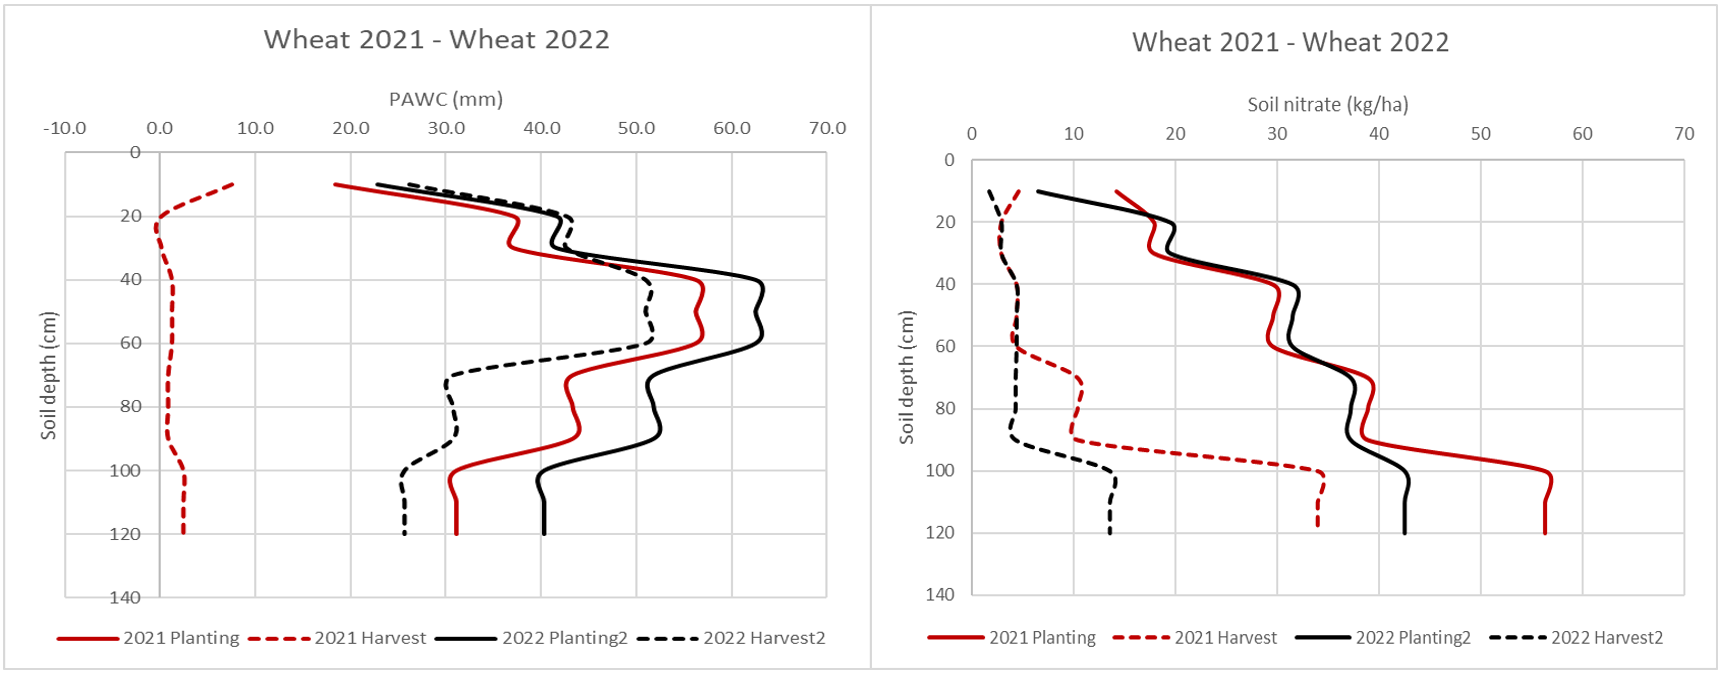
The first companion cropping experiment conducted at the Central Queensland Smart Cropping Centre (CQSCC) in 2021 and 2022 illustrates this point well when examining the soil profiles in the wheat and chickpea. Analysis of soil cores taken at planting and harvest show the levels of plant available water (PAW) and nitrate down the profile during the 2021 and 2022 winter seasons (Figure 1 and 2). These profiles were tested in increments of 0-10cm, 10-30cm, 30-60cm, 60-90cm and 90-120cm. There are several points that can be highlighted from this data.
Firstly, both crops extracted water down to 60cm very efficiently with less than 8mm of plant available water capacity (PAWC) left in those layers after harvest (Figure 1 and 2). Extraction from the 60-90cm layer was also significant for both crops but in the bottom layer (90-120cm) wheat had a much higher extraction rate (Figure 1 and 2).
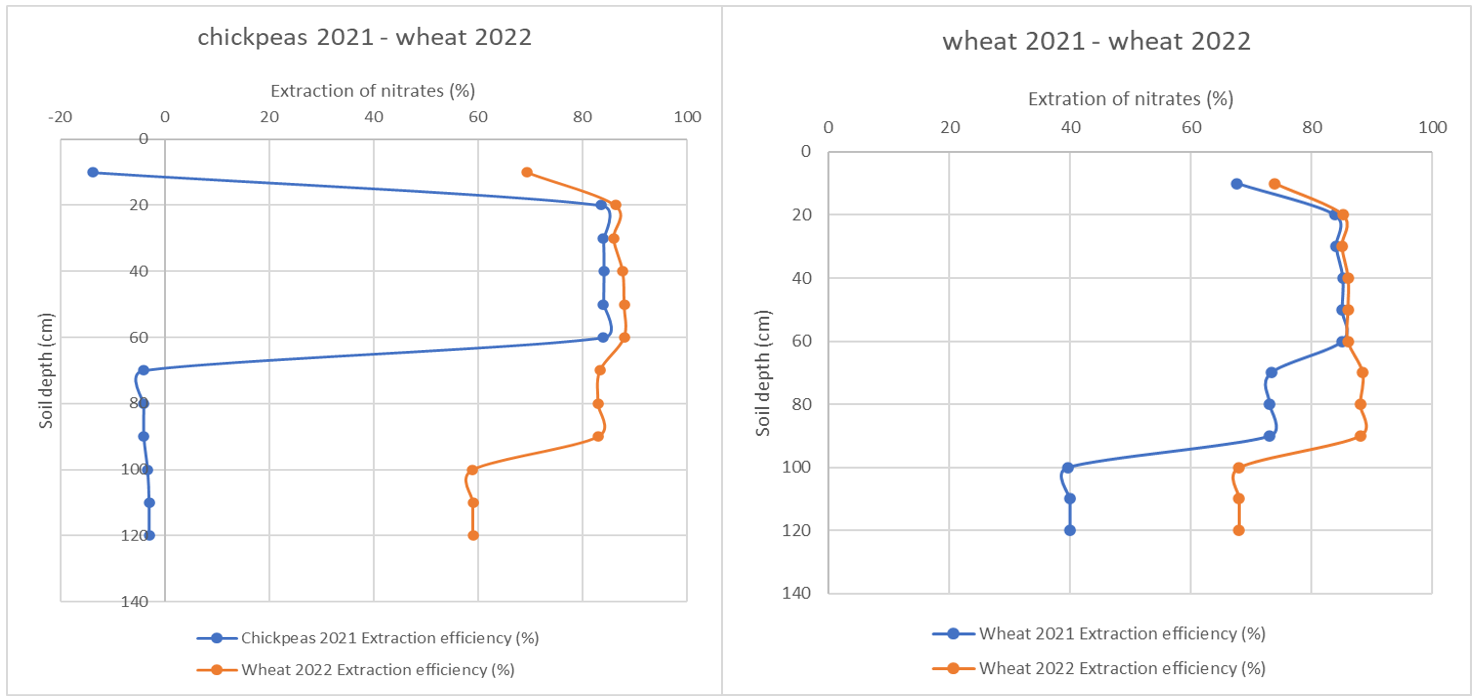
Similarly, the nitrate extraction rate follows a similar pattern with less than 5 kg N/ha remaining in the top 60cm of the soil profile for both crops. The extraction of soil nitrates by layer can be converted into a percentage of the total nitrates that existed at planting (Figure 3). This calculated data can be used as an indicator of the efficiency of soil extraction for each profile layer. It is clear from the data (Figure 3) that the extraction rate from the top 60cm of the profile is consistently 80-85% regardless of crop type.
Figure 1. Mean soil water (left) and soil nitrate (right) of the 2021 chickpea and the following wheat crop in 2022 at planting and harvest. This data was extracted from the first companion cropping trial in 2021-2022.
Figure 2. Mean soil water (left) and soil nitrate (right) of the 2021 wheat plots and the following wheat cover crop in 2022 for planting and harvest. This data was extracted from the first companion cropping trial in 2021-2022.
Figure 3. Soil nitrate extraction efficiency from soil profile presented as a % of the total soil nitrates present at planting for both the chickpea (left) and wheat (right) in 2021 and the following wheat cover crop in 2022.
Data calculated from the first companion cropping trial (2021-2022).
The top 10cm layer can have a variable extraction rate; from a negative extraction level (nitrates increased) up to 65%. This is not surprising given the many environmental variables that can impact the surface soil (evaporation and rainfall). Nitrate extraction from the deeper layers (60-90 cm and 90-120cm) is also quite variable, depending on crop type, with efficiency ranging from negative single digits (chickpeas) to over 80% (wheat – Figure 3).
It is clear from the nitrate extraction data (Figure 3) across four separate crops that the 10 – 60 cm zone is the most efficient supplier of nitrates to the plant with over 80% of the nitrates contained in this layer being extracted by the crop. This conclusion is supported by data extracted from the mungbean N response trials located on the CQSCC in summer of 2020-21.
In this experiment soil cores were taken in June 2020 (in fallow) and then remeasured at the planting of a mungbean crop in February 2021. This data subset compares three treatments:
- LF0N – long fallow with no N applied.
- LF60N – long fallow with 60 kg N/ha applied.
- SF0N – short fallow with no N applied.
They were assessed in the first week of November 2020 (after a cover crop of wheat was harvested) and then again at planting of the mungbean crop in February 2021.
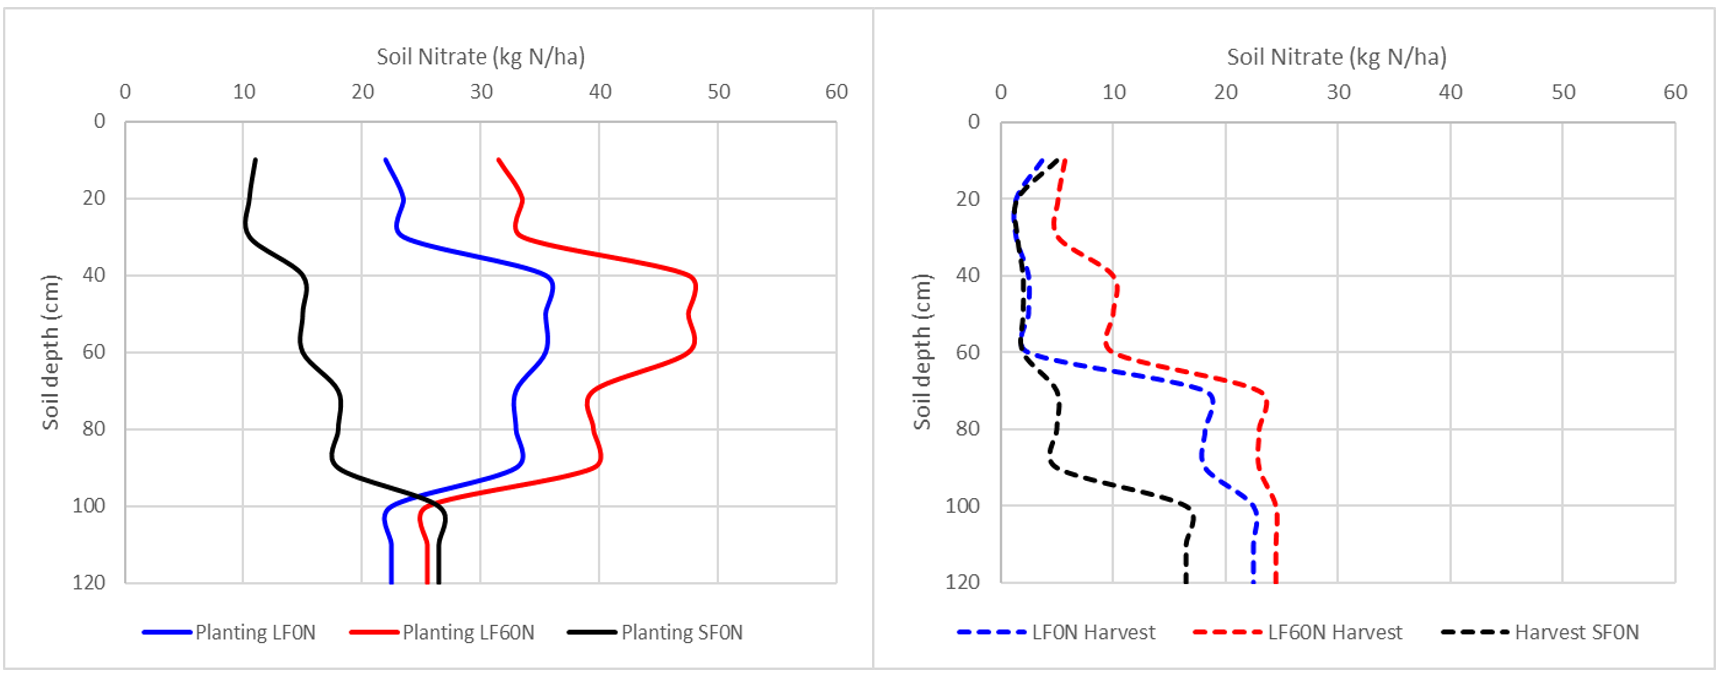
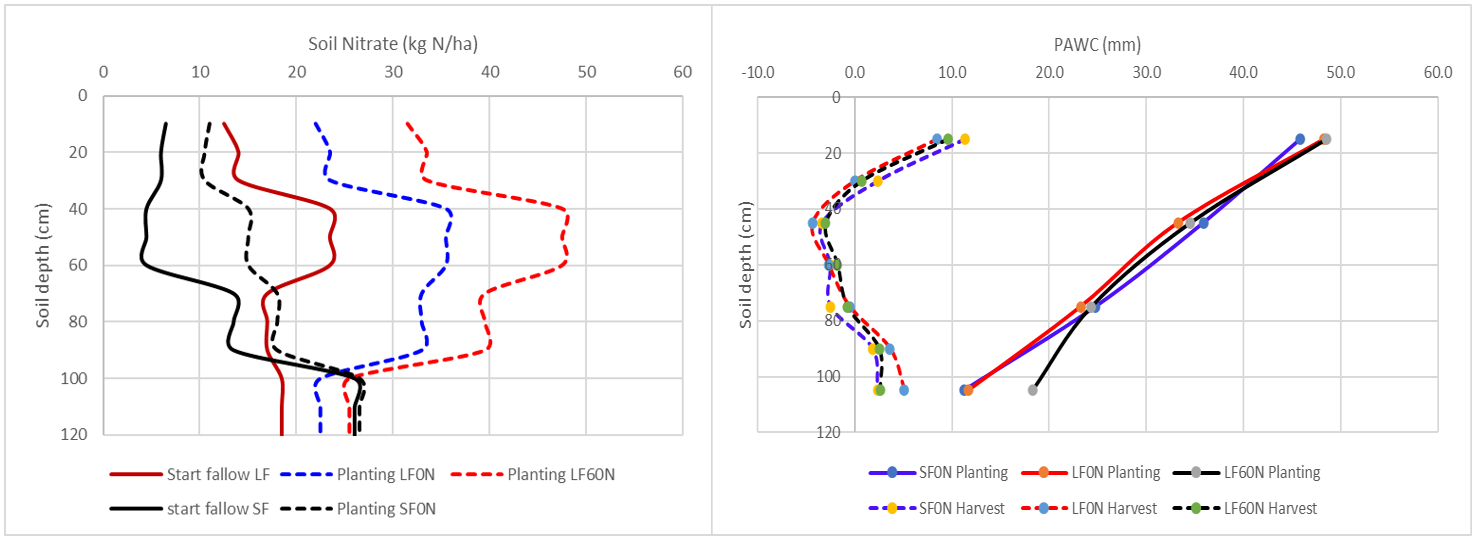
The soil nitrate data extracted from the mungbean N response trial (Figure 4) shows three distinct levels of nitrate supply. Both long fallow treatments (LF0N, LF60N) have accumulated their highest N level in the 30-60cm zone after 8 months of fallow and 381mm of rainfall. The short fallow treatment has a different pattern of N distribution which incrementally increases with depth, much like a descending staircase, with the largest amount of nitrate being accumulated at the deepest layer.
For comparison, at the time of planting (Figure 4), the top 60cm of the profile contains; 37 kg N/ha in the SF0N treatment, 81 kg N/ha in the LF0N treatment and 113 kg N/ha in the LF60N treatment.
Figure 4. Nitrate levels measured at planting (left) and after harvest (right) of mungbeans grown in 2020-2021. This is a comparison between short and long fallows without N applied and a long fallow treatment with N applied.
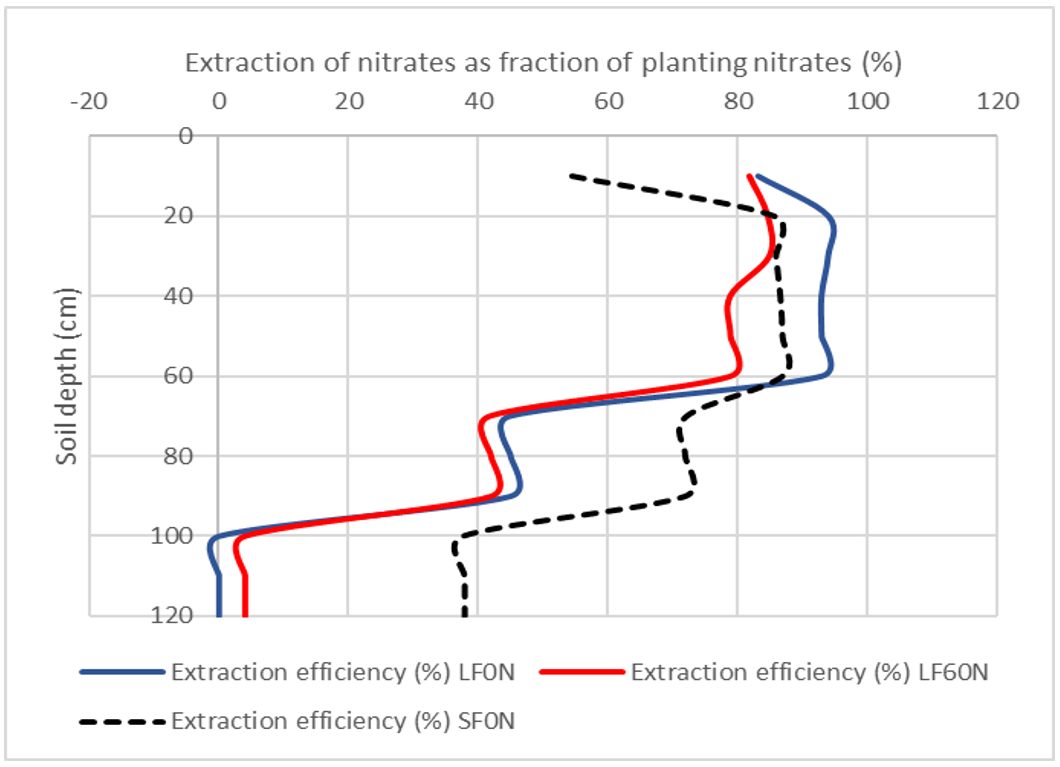
Figure 5. Comparison of the nitrate extraction efficiency of mungbean planted into short and long fallow treatments in the 2020-2021 mungbean N response trial by soil layer.
Overall, the long fallow treatments have accumulated far more nitrate in the profile than the short fallow treatments as would be expected from a longer period of mineralisation. The addition of 60 kg N/ha at the start of one of the long fallow treatments has made the biggest difference in the amount of nitrate accumulated in the 30-60cm layer although most layers down to 90cm benefited from the applied fertiliser compared to the long fallow treatment without any fertiliser applied (LF0N).
The soil core measurements taken at harvest in this mungbean N response trial shows the top 60cm of the profile is again the key area of draw down for soil nitrates by the crop in all three treatments (Figure 4). The calculations of extraction efficiency by soil layer (Figure 5) reinforces this with the 10-60cm zone showing 80-90% reduction in soil nitrates compared to planting levels.
At the deeper soil layers the long fallow treatments have a similar pattern of extraction by layer with ~45% in the 60-90cm zone and almost nothing from the 90-120cm layer (Figure 5). Comparatively, the short fallow treatment shows ~70% extraction from the 60-90cm layer and ~40% extraction from the 90-120cm layer (Figure 5). All these treatments were part of the same trial and had similar grain yields (± 10%, data not shown). It is unclear why the short fallow treatment had more nitrate extraction from the deeper layers than the long fallow treatments, as it was expected that the plant would fix its own N if soil extraction became too difficult.
It is useful to compare the amount of soil nitrate in the plant biomass and the amount of soil nitrate that was extracted from the top 60cm of the profile (Table 1). The change (∆) in soil nitrate levels in the top 60cm from planting to harvest shows a big difference between the long fallow distribution and the short fallow distribution (Table 1) and consequently there is a big difference in the amount of soil nitrate that has ended up in plant biomass.
Table 1. Summary data of key nitrate measurements for the short and long fallow treatments including N in the total biomass of the crop. This data is extracted from the mungbean N response trial in 2020-2021.
Treatment | Fallow length | Fallow mineralised N | Δ soil profile N | Total N in biomass* | Δ soil nitrates in top 60cm | Contribution of top 60cm of profile N |
|---|---|---|---|---|---|---|
Short fallow + 0N | 94 | 25 | -51 | 52 | - 28 | 54 |
Long fallow + 0N | 259 | 51 | - 88 | 91 | - 73 | 80 |
Long fallow + 60N | 259 | 92 | - 109 | 99 | - 92 | 93 |
*The total N in biomass figures do not include the Ndfa that was measured in this biomass from natural abundance assessment of 15N.
The crop grown on the long fallow treatment had almost double the crop biomass N compared to the short fallow, which equates to 80-90% of the nitrate that was extracted from the top 60cm of the soil profile. This would suggest that the key to getting more N into the crop is to have more nitrate in the top 60cm of the soil profile. These numbers have been generated from a mungbean crop that has a shallow root system, however chickpeas and wheat have also shown the same efficiency levels for nitrates existing in the 10-60cm layer of the profile (Figure 3).
The N fixation levels for these treatments (Ndfa%) measured by the natural abundance method were as follows; SF0N – 45%, LF0N – 10%, LF60N – 4% (not shown). Clearly the short fallow treatment fixed the most N from atmosphere and this maybe a result of not having as easy access to nitrates in the top half of the profile as the long fallow treatments did.
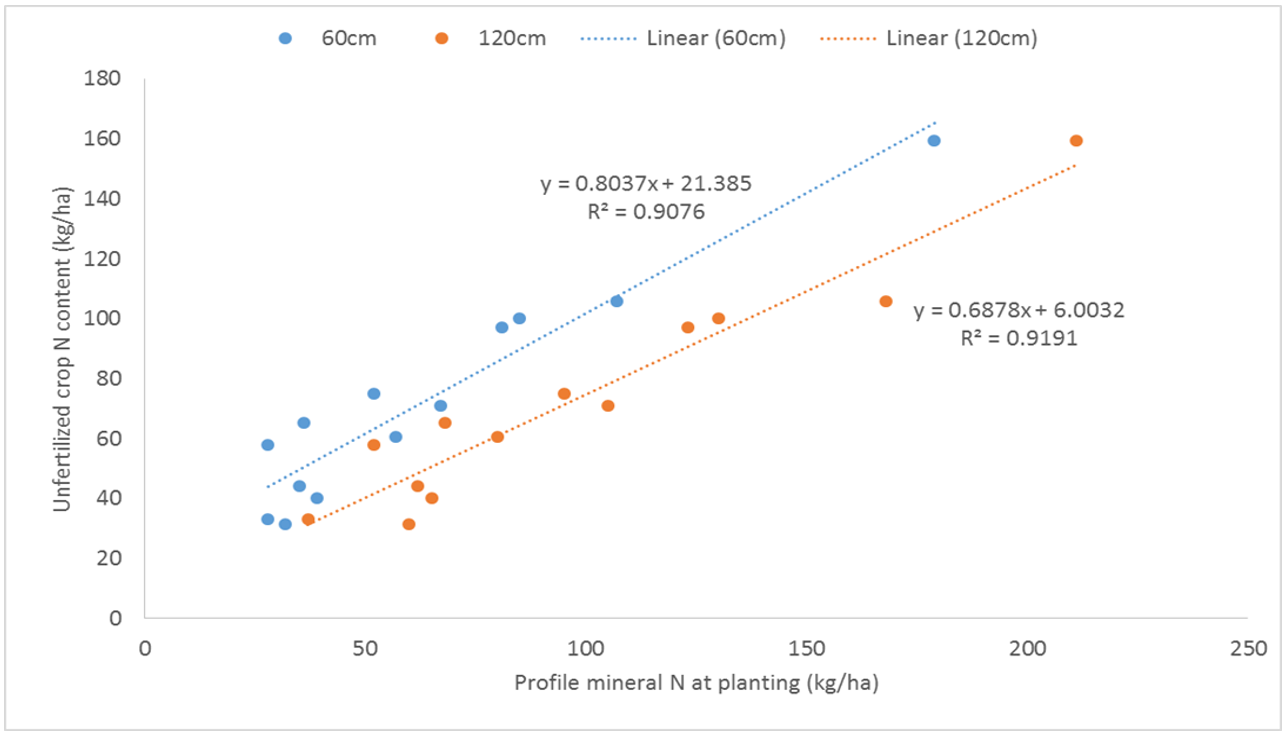
The mungbean, wheat and chickpea data complements previous sorghum research in QLD and NNSW which suggest that 70-80% of total nitrate uptake is through soil nitrate pools existing in the top 60cm (Figure 6) in unfertilised crops (Bell et al., 2016).
It makes sense that a long-term management program around N nutrition would be built around trying to maintain an adequate level of nitrate in the 10-60cm zone as there is good evidence that most crops can access nitrates in this part of the profile with a high degree of efficiency. The next step then is to understand how the application rate, timing and placement of N based fertilisers relates to maintaining this ‘N bank’ in the 10-60cm soil profile.
Figure 6. Mean data from a range of Queensland sorghum x nitrogen experiments where the points represent the amount of profile mineral N at planting in the unfertilized control treatments and their relationship to total N in biomass. Blue dots represent the top 60cm profile and the orange dots represent the 120cm profile.
Source: Bell M et al, (2016) Summer grains conference.
Delivery of N into key zones
Most of the N applied in our current farming system is applied either on the surface of the soil or banded in the top 10cm. The movement of this N is reliant on water movement once it is in the nitrate form (plant available form) and this movement can be enhanced by a strong soil moisture gradient between wet soil and dry soil (otherwise known as a wetting front). There is strong evidence that the first significant rainfall event after harvest promotes the deepest wetted front although this is dependent on the amount of rainfall. The capillary action apparent in most cracking clay soils will continually move water into dry soil until an equilibrium is met between wet soil and dry soil. When rain falls on already wet soil this pressure gradient is not as strong and so the movement of water through the profile is slower and does not move as far.
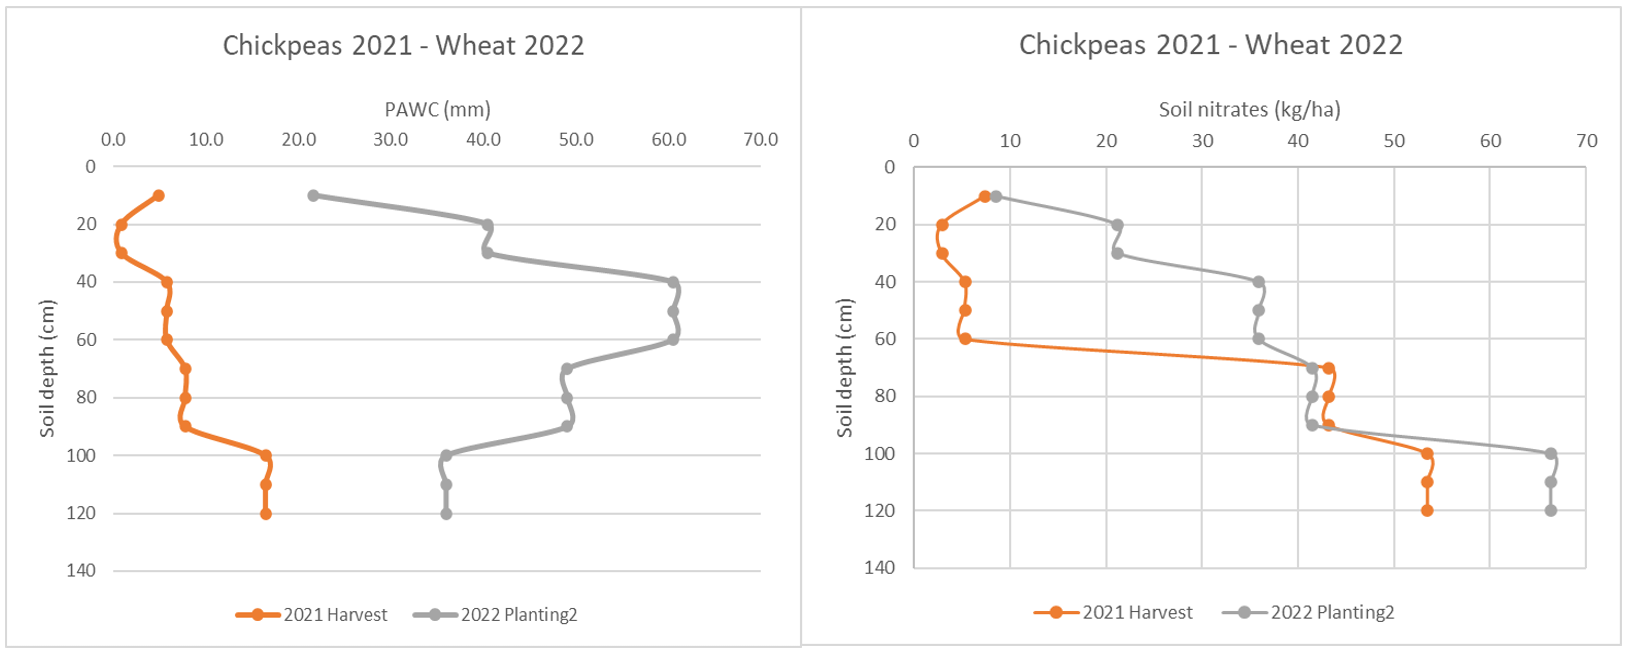
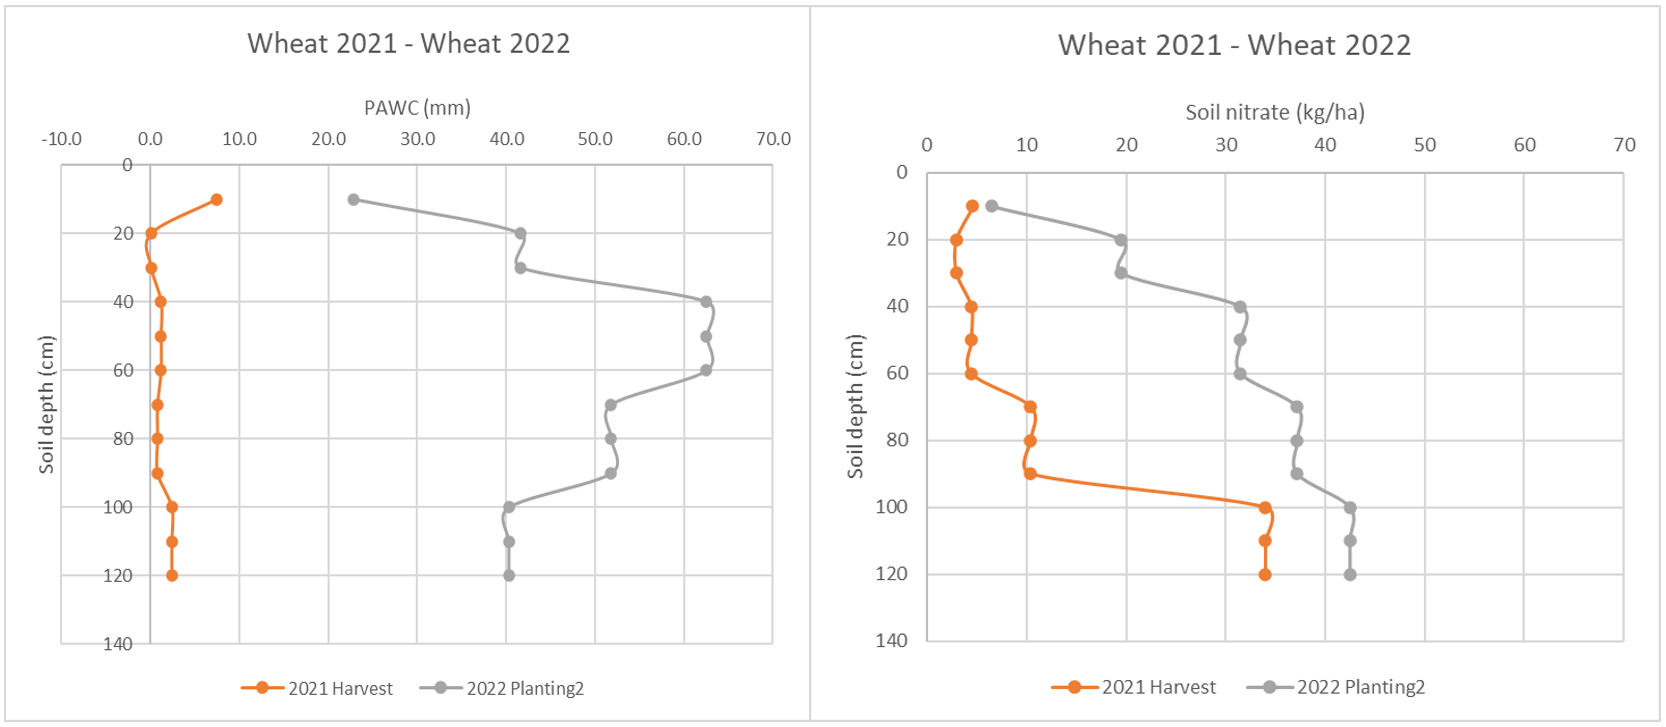
Decisions around applying N fertiliser need to consider how long it is going to take for the nitrate to move through the profile and redistribute in those key zones of root uptake (10-60cm). The data extracted from the chickpea and wheat treatments in the 2021 companion trials (Figure 7 and 8) show the level of replenishment that occurred down the profile over the eight-month fallow, between harvest in 2021 and planting of the wheat cover crop in 2022. This fallow period had 625 mm of rainfall over the summer period and no additional N was applied.
The chickpeas increased PAWC by 171 mm (total PAWC 207mm) and the wheat by 207mm (total PAWC 218mm). Based on the total PAWC numbers, both treatments had a full profile at planting of the 2022 wheat cover crop. Over the same fallow period nitrate levels increased by 61 kg N/ha in the chickpeas and 81 kg N/ha in the wheat. It is assumed that this has come from the mineralisation of organic matter since no fertiliser was added to these plots. The distribution of nitrates down the profile (Figures 7 and 8) shows that the amounts held within each measured layer does not necessarily reflect the same pattern as the PAWC pattern.
The PAWC data (Figure 7 and 8) predictably shows peak water holding capacity in the 30-60cm zone in both the wheat and chickpea plots (28% and 26% of the total profile respectively). The nitrate distribution shows nitrates accumulating down the profile with 90-120cm having the highest levels of nitrate (Table 2).
Figure 7. Mean PAWC and soil nitrates at chickpea harvest 2021 and wheat planting in 2022. Profile measurements are taken at 0-10, 10-30, 30-60, 60-90 and 90-120cm increments.
Figure 8. Mean PAWC and soil nitrates at wheat harvest 2021 and wheat planting in 2022. Profile measurements are taken at 0-10, 10-30, 30-60, 60-90 and 90-120cm increments.
From this data there is no way of knowing the proportion of nitrate that has been moved with a wetted front (redistributed) down the profile versus nitrate that has been mineralised in-situ in the different layers (Table 2). It is assumed that most of the mineralisation occurs in the surface soil (0-10cm) where crop residues are being broken down and in the 10-30cm zone where the largest root mass will also be broken down.
The distribution of N in the profile shows that the 0-10cm and 10-30cm zone contains the lowest amount of nitrates (Table 2) therefore, it is assumed that much of this mineralised N has been moved down the profile by successive rainfall events. What is not clear is why the nitrates are accumulating in the 90-120cm zone and not in the 30-60cm zone where the highest water holding capacity is (Figure 7 and 8).
Table 2. Proportional distribution of nitrates down the soil profile after eight month fallow following wheat and chickpea crops. These nitrate levels are derived from the mineralisation of organic matter with no N fertiliser applied.
Depth layer (cm) | Soil nitrate expressed as a % of total profile nitrates | |
|---|---|---|
Wheat, end of fallow | Chickpea, end of fallow | |
0-10 | 5 | 5 |
10-30 | 14 | 12 |
30-60 | 23 | 21 |
60-90 | 27 | 24 |
90-120 | 31 | 38 |
Further data on the redistribution of soil nitrates in the profile can be extracted from the N response trials in mungbeans carried out in 2019-20 and 2020-21 at CQSCC. The 2020-21 trial data (Figure 9) shows the comparison between long fallow and short fallow distribution of nitrates at the start of each respective fallow period and at planting. It also shows the comparison between long fallow with and without additional N fertiliser.
The pattern of distribution of nitrates through the profile at the start of the fallow period and when the crop was planted shows the long fallow treatments (8 months) have accumulated more nitrate in the 30-60cm zone than the short fallow treatment (3 months) (Figure 9). The distribution of nitrates at the start of the long fallow period is very similar to the pattern of distribution at planting.
The short fallow treatment has accumulated more N in the 30-60cm layer than the other layers but not to the same concentration as the long fallow treatments. It is notable that the nitrates in the 90-120cm layer have hardly moved in both short and long fallow treatments. This is not surprising given PAWC data (Figure 9) for these treatments shows almost no wetting of the 90-120cm layer which means there are few opportunities for the nitrate to be moved by water into this zone.
Figure 9. Mean nitrate distribution (left) between the start of fallow and planting for the short and long fallow treatments in the 2020-2021 mungbean N response trial. PAWC distribution (right) at planting and harvest for the short and long fallow treatments in the 2020-2021 mungbean N response trial.
The surprising factor in this data (Figure 9) is that the long fallow treatments had 381 mm of rainfall in the fallow period leading up to planting while the short fallow treatment had 240mm of rainfall. Both fallows also received 100mm of irrigation in the summer period leading up to planting. The differing rainfall totals made little difference in the starting water profile (116mm cf. 125mm) of the two fallow periods. All three treatments had similar PAWC at planting (Figure 9) and those profiles were only ~65% full which explains why the lower layers had not wet up properly.
Despite there being little difference in the PAWC between the long fallow and short fallow treatments the distribution of nitrates in the profile benefited from a longer period of fallow with more rainfall events (8 events SF, 14 events LF) and this contributed to the movement of nitrates down the profile. The addition of 60kg N/ha in the long fallow treatment has increased the concentration of nitrates down the profile under these fallow conditions.
A useful comparison to this data from 2020-21 is the N response in mungbean experiment conducted in the previous summer 2019-20 at the CQSCC. In this experiment all treatments were applied after a wheat harvest at the end of October 2019 with several rates of N applied to the surface soil on the 25 November 2019 before being left fallow through to planting on 14 February 2020 (81 days). This site received no rainfall to mid-December, so a 100mm irrigation was applied on the 16 December 2019. After Christmas there was 303 mm of rainfall in 7 events prior to planting.
Soil cores samples were taken after wheat harvest but before N application and then again at planting. The soil nitrate and PAWC data extracted from this trial show three treatments (Table 3):
- 0N control (no N applied)
- 60N (60 kg N/ha applied)
- 150N (150 kg N/ha applied).
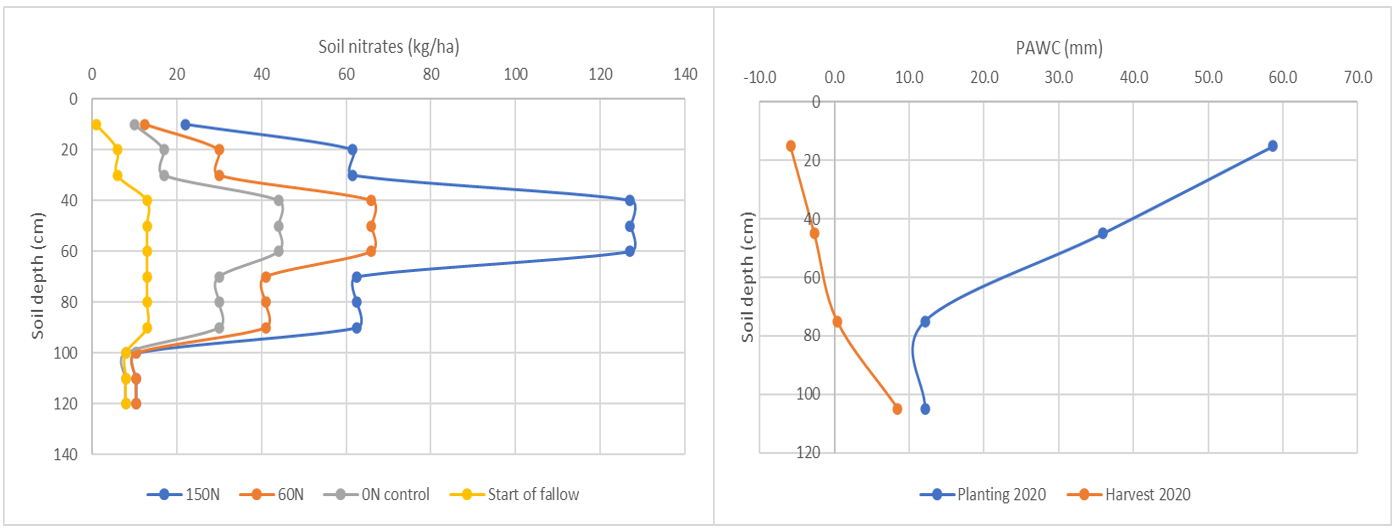
Under these short fallow conditions over summer, the profile mineralised 68 kg N/ha with no fertiliser added (Table 3), which is relatively high in comparison to published data (Cox H, 2009). In comparison to this mineralisation rate, the fertiliser treatments added 51 kg N/ha (60N) and 175 kg N/ha (150N) which aligns well with the application rates (Table 3).
The distribution of these nitrates down the profile (Figure 10) shows a very similar pattern for each treatment with the 30-60cm layer accumulating the largest amount of nitrate and the 90-120cm layer not changing at all (Figure 10). The PAWC data (Figure 10) shows that very little soil water accumulated in the 90-120cm layer by planting time, which would explain why the nitrate levels did not change.
Table 3. Summary of key nitrate measurements for selected treatments in 2019-2020 mungbean N response trial.
Treatment | Start of fallow N | Applied N | Planting N | ∆ soil N over fallow | Difference to 0N control |
|---|---|---|---|---|---|
0N control | 41 | 0 | 109 | 68 | 0 |
60N | 41 | 60 | 160 | 119 | 51 |
150N | 41 | 150 | 284 | 243 | 175 |
Figure 10. Mean distribution of soil nitrates (left) by soil layer under three N application treatments during an 81-day fallow over the summer period (2019-2020). PAWC distribution (right) by soil layer at planting and harvest in 2019 – 2020 summer mungbean crop.
The PAWC data (Figure 10) also suggests that the soil profile was not full at planting time with PAWC values averaging 119mm (not shown) which is about 65% of a full profile for this soil type.
The nitrate distribution in the profile (Figure 10) indicates rainfall has the key impact on depth of N and the rate of applied N has the biggest impact on concentration in each soil layer. Where there was no N applied, the soil nitrate level is more dependent on the mineralisation from organic matter which is a slow-release process and can only happen when there is adequate soil moisture. Hence when rainfall occurs there are only small amounts of nitrate being released at any one time and is available to move with a wetted front.
When N is applied to the surface soil there is a high concentration of nitrate formed in the surface layer and each successive rainfall event can move a larger concentration of nitrate down the profile. This will ensure that there is adequate nitrate available in this key zone for plant uptake that has been proven to have a high level of efficiency for plant access.
Length of fallow may not be as critical to maintaining nitrate fertility in the most accessible zones of the soil profile as the rate of application and the intensity of rainfall events. The two N response mungbean experiments conducted over a two-year period showed that adequate levels of nitrate were distributed through the profile under a short fallow scenario when adequate rainfall or irrigation occurred after application.
In the 2019-20 experiment the 60N treatment accumulated an additional 38 kg N/ha in the top 60cm above the natural mineralisation rate during a fallow period of 81 days. In the 2020-21 trial the 60N treatment in a long fallow situation accumulated an additional 32 kg N/ha in the top 60cm above the natural mineralisation rate during a fallow period of 259 days. While these data sets are treated as being mutually exclusive because of the differing seasons it does give an indication that the length of fallow is not critical to getting soil nitrates distributed into the key uptake zones.
Key outcomes for growers
The two concepts that should underpin any nitrogen fertiliser program is that maximum efficiency of plant uptake of nitrates occurs in the 10-60cm zone of the soil profile and that movement of nitrates down the profile is governed by both rainfall and application rate. In farming systems where in-crop rainfall is limited or sporadic at best, then nitrates that are stored in the 10-60cm zone are going to deliver the most consistent nitrate supply.
Data presented in this paper has shown that regardless of crop type (cereal or legume) the nitrates in the top 60cm are always drawn down to low levels (<5 kg N/ha). This means that there needs to be a consistency of supply of fertiliser N at the surface layer to ensure the best chance of being distributed with the rainfall during the fallow period. These fallow rainfall events will eventually ensure enough PAWC for the next crop. Applying N fertiliser before the fallow rainfall will ensure that the N fertiliser is not stranded in the surface profile (0-10cm) for a long period of time and has the greatest chance to be redistributed before the next crop.
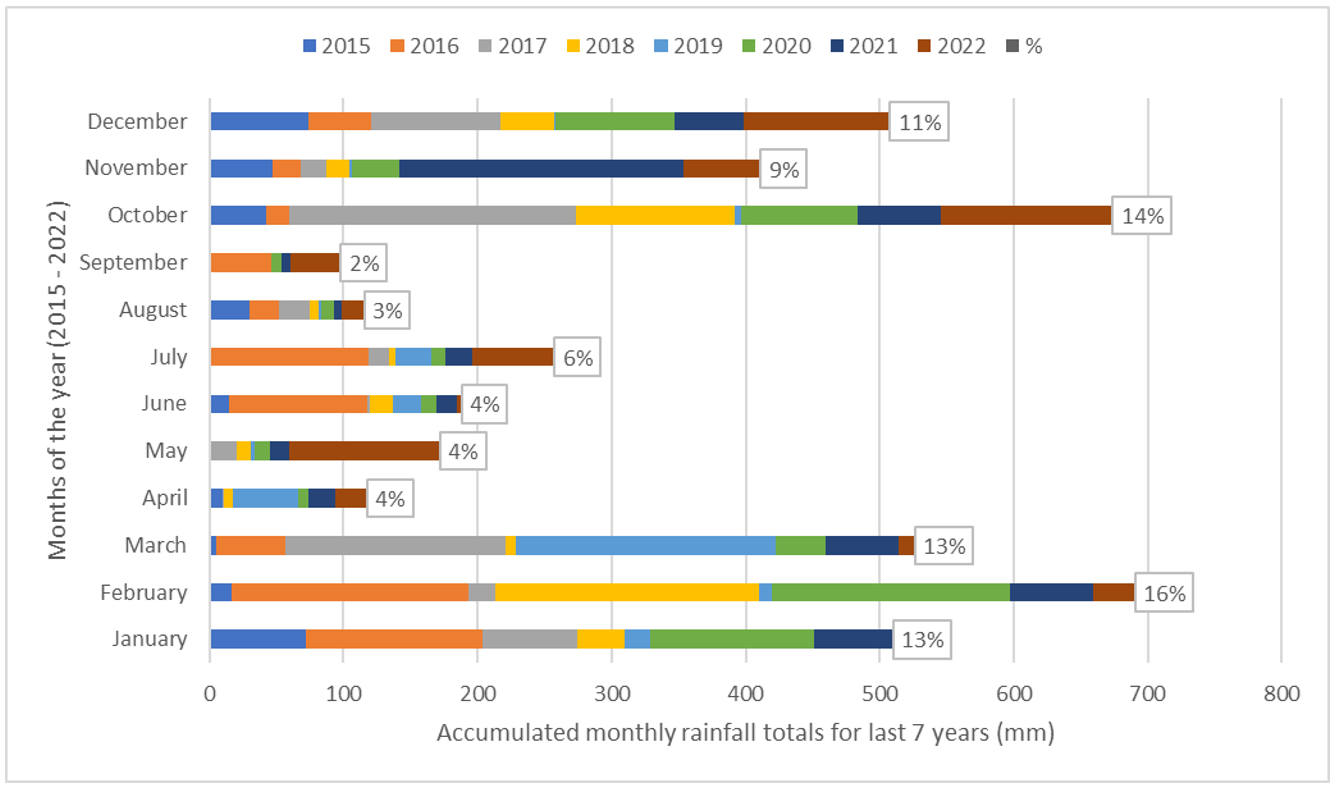
In a CQ dryland crop system the most reliable rainfall period is summer and more particularly the months of January, February and March (Figure 11). To continually maintain a ‘bank’ of nitrate in the most accessible part of the profile (10-60cm), then this rainfall period needs to be utilised as much as possible.
Data that has been presented in this paper suggests that a short fallow over the summer period is all the time that is required to redistribute the surface applied N throughout the top 60cm of the profile provided that enough rainfall is received during the summer months. In this paper there are examples where the redistribution of soil nitrate was adequate in the 10-60cm zone with only enough rainfall to fill the profile to two thirds full, while the deepest layer (90-120cm) remained dry.
There are limitations to the scope of this data and one of these is that in nearly all the examples given, the N fertiliser was applied to very dry soil profiles where PAWC was below crop lower limits. It is expected that this provides the best rate of nitrate distribution compared to situations where N fertiliser is applied after significant rainfall events have changed fallow conditions.
For CQ growers the most effective N management strategy is to apply their N fertiliser prior to the wettest three months of the year, and this should be done every year, regardless of crop type (legume, cereal or oilseed). This will maintain a continual supply into the 10-60cm soil zone which in turn promotes the highest efficiency of uptake for the following crop.
Figure 11. Monthly rainfall totals accumulated over the last seven years (2015 – 2022) at the CQSCC weather station. These accumulated monthly totals are presented as a proportion of the total rainfall that has occurred in this seven-year period (%).
References
Bell MJ, Lester DW, Sands DN, Graham R, Rowlings D and Grace P (2016). Recovery of soil and fertilizer N in sorghum. 3rd Australian Summer Grains Conference. Gold Coast, Australia.
Cox H (2009) The Nitrogen Book – Principles of soil nitrogen fertility management in Central Queensland farming systems. Dept. of Employment, Economic Development and Innovation. Queensland Government publishing, Brisbane.
Acknowledgements
The research undertaken as part of this project is made possible by the significant contributions of growers through both trial cooperation and the support of the GRDC, the author would like to thank them for their continued support.
The author thanks the technical officers Peter Agius, Gail Spargo, Penny Borger who worked diligently on these projects.
Contact details
Douglas Sands
Department of Agriculture and Fisheries, Queensland.
99 Hospital Road, Emerald. QLD 4720
Ph: 0457 546993
Email: [email protected]
Date published
November 2023
GRDC Project Code: DAQ1806-003RTX, DAQ2104-006RTX,
Was this page helpful?
YOUR FEEDBACK

