Too little or too much; conservative and high nitrogen fertiliser tactics in northern farming systems
Author: Jon Baird (NSW DPI), Lindsay Bell (CSIRO), Chris Dowling (Back Paddock Company) | Date: 06 Mar 2024
Take home message
- Yield responses to high N & P fertiliser rates was variable across sites. At the Trangie red soil site, system yield was improved by 1.6 t/ha, while other sites showed little response ranging between 0.4 and 0.8 t/ha. Trangie Grey reduced system yield by 1.8 t/ha
- Dry matter production did improve in the Higher nutrient system by 1.7 t/ha, as did grain N export and cumulative cropping system N use was 80 k N/ha higher than the Baseline system
- Residual N improved in the Higher nutrient system compared to conservative fertiliser budgets (up to 60 kg N/ha), but losses due to weather events were larger and sometimes deleted the greater amounts of residual fallow N.
Background
Seasonal variability within Australia’s northern grain growing regions is increasing – from low rainfall seasons struggling to produce grain through to primed soil moisture levels producing high quality and high yielding crops. The challenge for growers is to ensure when these favourable seasons occur, the recovery efficiency of fertiliser is high and inherent conditions allow for optimum yield production.
Optimising nitrogen (N) fertiliser management in our cropping systems is critical to achieve acceptable yields and quality. Optimised rates are when the input of fertiliser is economically viable to achieve the highest possible gross margins. The challenge for growers is matching fertiliser usage with crop expectations in an environment that is highly variable. In addition, often fertiliser programs are focused on one crop and its requirements, rather than considering the legacy of previous crops and the requirement of future crops in the sequence.
Optimising application rates of N fertiliser will improve nitrogen use efficiency (NUE), especially when budgets include local contributions from other N pools/sources such as soil organic matter which have greater uptake efficiency than applied synthetic sources (Dowling, 2023).
The Northern Farming Systems project funded by GRDC, has explored differing fertiliser strategies since 2015, investigating the legacy implications on grain yield, economic sustainability and disease risk. The strategies include applying N and phosphorus (P) fertiliser rates aimed at achieving a 50th percentile modelled yield (Baseline) and high input strategy that provides the nutrition for a 90th percentile yield (Higher nutrient). We monitored the long-term N dynamics and the cropping system impact on NUE, crop N use and residual mineral N (nitrate-N and ammonium-N).
Experimental setup
Seven experimental sites were established in 2015 including Trangie (Grey and Red soil), Spring Ridge, Narrabri, Mungindi, Pampas, Billa Billa and Emerald. All sites contained a growers practice (Baseline) system, and a Higher nutrient system. APSIM modelling was performed to establish crop nutrient requirements specific to the location, crop choice, crop planting date and soil water content.
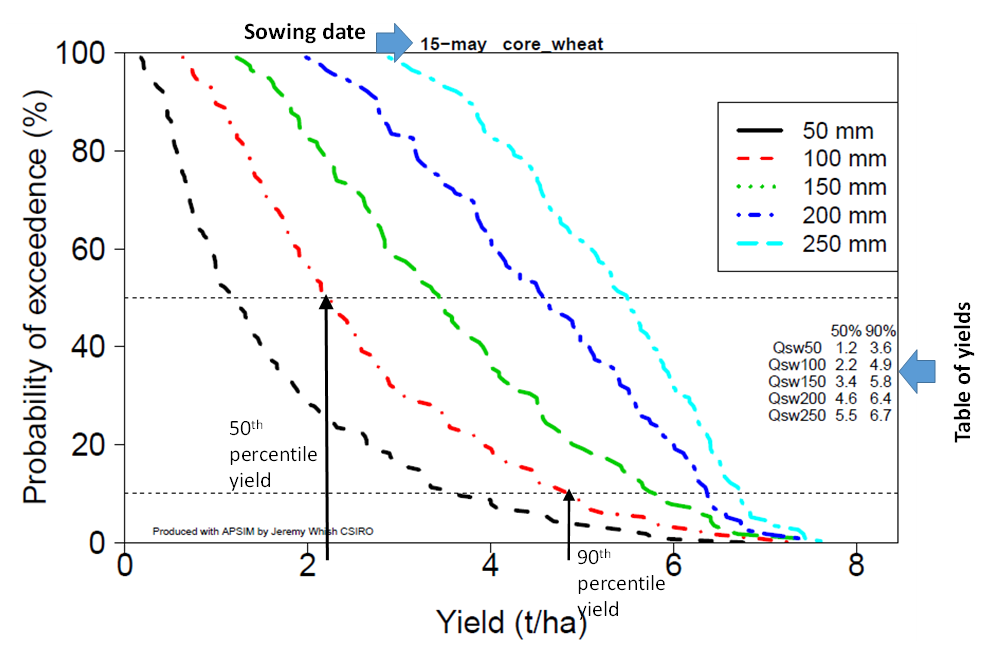
In the Baseline system, crops were fertilised to a nutrient budget targeting a predicted yield (APSIM) in the 50th percentile of seasons. That is, adequate N is applied for the crop to reach its yield potential in half of seasons (or an average yield outcome), while in seasons with higher yield potentials it is possible that the crop may not have sufficient N supply to meet its yield potential. In the Higher nutrient systems, crops were fertilised to a nutrient budget targeting a predicted yield in the 90th percentile of seasons. That is, the crops are fertilised so that they should never be limited by nutrient availability in any season, but this means that the crops are ‘over-fertilised’ in all but the best seasons. The crop N budgets are determined prior to sowing every non-legume crop. The rates applied are based on water limited predicted yield using well established N requirement calculations. An example for wheat is below (Equation 1). So, for the example crop situation in Figure 1, this would equate to a crop N fertiliser budget of 83 kg N/ha in the Baseline system and 185 kg N/ha in the Higher nutrient system.
Prior to each crop, the amount of fertiliser N to be applied was determined by deducting the amount of soil mineral N available in the top 90 cm (Equation 2) of the soil profile from the total crop budget (Equation 3). Hence, if there was sufficient mineral N available in the soil to meet the crop demand, then no synthetic N fertiliser was applied (other than starter to provide other nutrients). This method also did not assume or account for additional in-crop N mineralisation or adjust this based on crop history (e.g., following legumes). In the experimental locations in Queensland, all the fertiliser N was applied at sowing, while in NSW locations, a portion (up to 50%) was applied in-crop at the start of stem elongation.
Equation 1: Wheat N budget = Predicted yield x 12% protein x 1.75 x 1.8
Equation 2: Soil Mineral N = (ammonium-N (-3 mg.kg) + nitrate-N) x bulk density x layer depth; summed to 90 cm depth
Equation 3: N to be applied = Crop N budget – Soil mineral N
Figure 1. APSIM predictions of wheat yield probabilities with different starting soil water levels (50, 100, 150, 200 and 250 mm plant-available water). For 100 mm PAW at sowing (indicated by 2nd slotted line), the yield predictions for a 50th percentile season (1st vertical arrow) and a 90th percentile season (2nd vertical arrow) are shown; these are used to calculate the N budgets for the crop.
System performance
A key objective when producers use a high input fertiliser strategy is to maximise productivity – particularly in favourable seasons. A yield gap analysis (https://yieldgapaustralia.com.au/) for wheat in the Coonamble district found that in the driest 20% of years the water limited yield gap is around 46%, whereas in wetter years this rises to 60%. Much of the gap in wetter years has been attributed to a lack of N, either low native soil N supply and or conservative fertiliser N rates. For our study, most sites had a number of below or average growing seasons in the last eight years. As expected during these low rainfall seasons there was minimal yield difference between the two farming systems. Seasonal growing conditions have improved since 2020 and higher grain yields were achieved for several individual crops when higher rates of fertiliser were applied, but the legacy did not result in a system difference. In saying that, we did achieve greater plant growth (dry matter production) at several sites. This shows that early plant growth may have been improved with the additional fertiliser N and P producing more plant biomass before late season moisture became limited and decreased yield potential. Considering the limited yield response to higher application rates of fertiliser N and P, growers should ensure the economic costs are sustainable, for this question we have applied dollar values to our results.
Table 1. Baseline and Higher nutrient productivity over multiple crops between 2015 and 2023
System yield (t/ha) | System biomass (t/ha) | System income ($/ha) | ||||||
|---|---|---|---|---|---|---|---|---|
Region | Baseline | Higher nutrient | diff | Baseline | Higher nutrient | diff | Baseline | Higher nutrient |
Billa Billa | 27.4 | 28.2 | 0.8 | 67.1 | 70.0 | 2.8 | 8617 | 8596 |
Emerald | 26.7 | 27.4 | 0.7 | 61.4 | 61.8 | 0.4 | 8423 | 8847 |
Mungindi | 10.3 | 11.1 | 0.8 | 27.2 | 29.4 | 2.2 | 3219 | 3675 |
Narrabri | 21.6 | 22.0 | 0.4 | 54.7 | 51.5 | -3.3 | 7970 | 7860 |
Spring Ridge | 36.8 | 37.5 | 0.7 | 79.6 | 81.8 | 2.2 | 12430 | 12539 |
Pampas | 36.8 | 37.4 | 0.6 | 75.9 | 81.9 | 6.0 | 10738 | 10846 |
Trangie Grey | 20.1 | 18.3 | -1.8 | 41.5 | 43.5 | 2.0 | 6291 | 5650 |
Trangie Red | 19.2 | 20.8 | 1.6 | 35.1 | 36.1 | 1.0 | 6679 | 7172 |
exp mean | 22.6 | 23.1 | 52.8 | 54.5 | 7070 | 7156 | ||
Is it economically viable to apply higher rates of fertiliser in northern grains regions?
When implementing a nutrient strategy containing higher rates of fertiliser for optimum productivity, growers should account for the higher costs and economic risks with the strategy. Extra fertiliser costs will vary according to starting soil fertility, mineralisation during fallow periods and seasonal conditions. Within the farming systems project, the extra costs ranged from $403/ha at Narrabri down to $18/ha at Emerald (Table 2, N fertiliser was costed at $1.30 per kg of N, which is lower than the current N fertiliser price). Please note, the rates of fertiliser were calculated to meet the projected yield modelled by APSIM dependant on sowing soil water, meaning budgets were built prior to planting and early crop development.
Applying greater fertiliser rates did improve levels of soil mineral N (nitrate-N + ammonium-N) by 20 kg N/ha on average across all the sites. When we place a value against the additional mineral N, the higher nutrient system is $25/ha in front of the Baseline at the completion of the last harvested crop. In addition to extra mineral N, the value of exported grain N has allowed the higher nutrient system to generate greater N value of $54/ha per site.
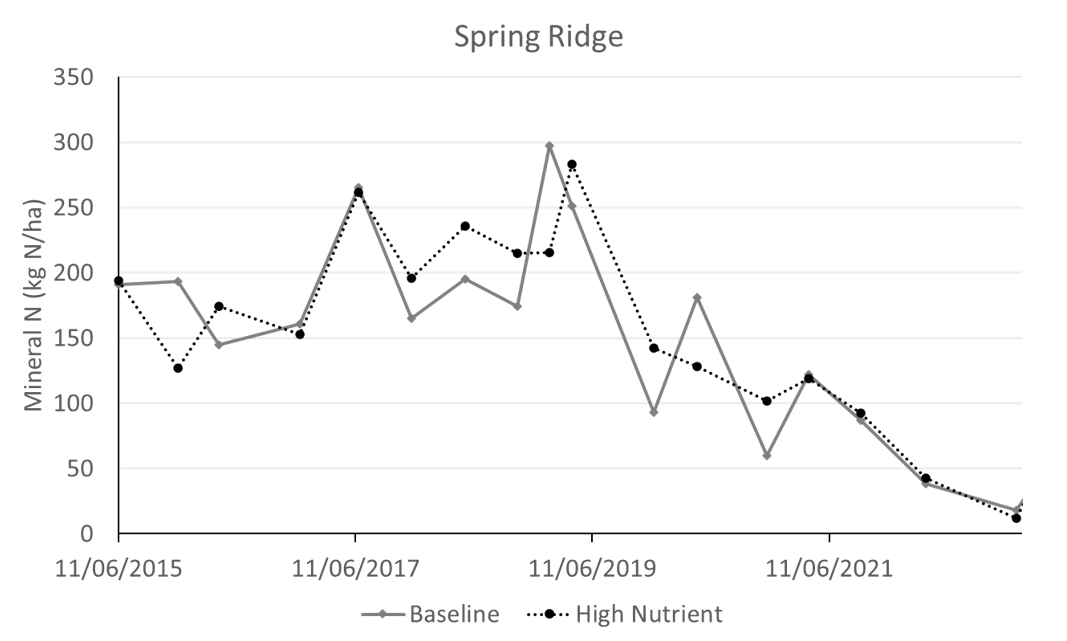
The risk for growers is obviously the cost of the fertiliser, and the return on investment. If there is minimal difference in plant N use between systems, applying higher rates of fertiliser will leave greater levels of residual mineral N after the harvested crop. Mineral N when in the form of nitrate-N can be unstable in our farming soils and can be lost through various pathways. N losses did occur during the project, one instance at Spring Ridge saw a loss of >150 kg N/ha due to a severe summer storm in 2019 (Figure 2). A detailed paper by Graeme Schwenke (2022) highlights N loss pathways in grain cropping and options to reduce these losses. The study found N losses or un-accounted for fertiliser N was valued at $135/ha or $22/ha per planted crop, respectively. There is a possibility some of the un-accounted N is in organic form, and analysis planned at project closure will detail any changes in soil organic N.
Table 2. Economic viability of applying higher nutrients compared to the baseline system in the northern grains region (2015-2022)
| Mineral N difference at final harvest | Additional N fertiliser cost | Additional min N value | System export N + soil N value | Value of additional N minus cost |
|---|---|---|---|---|---|
| Region | kg N/ha | $/ha | $/ha | kg N/ha | $/ha |
Billa Billa | 34 | 76 | 44 | 124 | 48 |
Emerald | -5 | 18 | -6.5 | 17 | -1 |
Mungindi | 44 | 101 | 57 | 132 | 32 |
Narrabri | 15 | 403 | 20 | 40 | -363 |
Spring Ridge | 5 | 279 | 6.5 | 46 | -233 |
Pampas | 19 | 250 | 24 | 44 | -206 |
Trangie Gray | 5 | 130 | 6.5 | -71 | -201 |
Trangie Red | 39 | 257 | 51 | 99 | -158 |
Long term system legacy of higher application rates of fertiliser
On average across the eight years of study, the Higher nutrient system has applied 137 kg N/ha more than the typical growers practice system (Baseline) (Table 3). The additional application of fertiliser N may not have increased yield but there has been a slight improvement in exported N from the Higher nutrient system (+27 kg N/ha). When we add the legacy residual N, the overall system N use of the Higher nutrient system is 80 kg N/ha higher than the Baseline system. A basic system recovery calculation shows that of the additional N fertiliser, we have seen a recovery of 58% by the Higher nutrient system. This recovery rate is comparable to other agricultural industry values (Chen et al, 2008) and highlights the need for producers to understand their fertiliser use for the whole farming system and not a per crop or a single soil N pool basis.
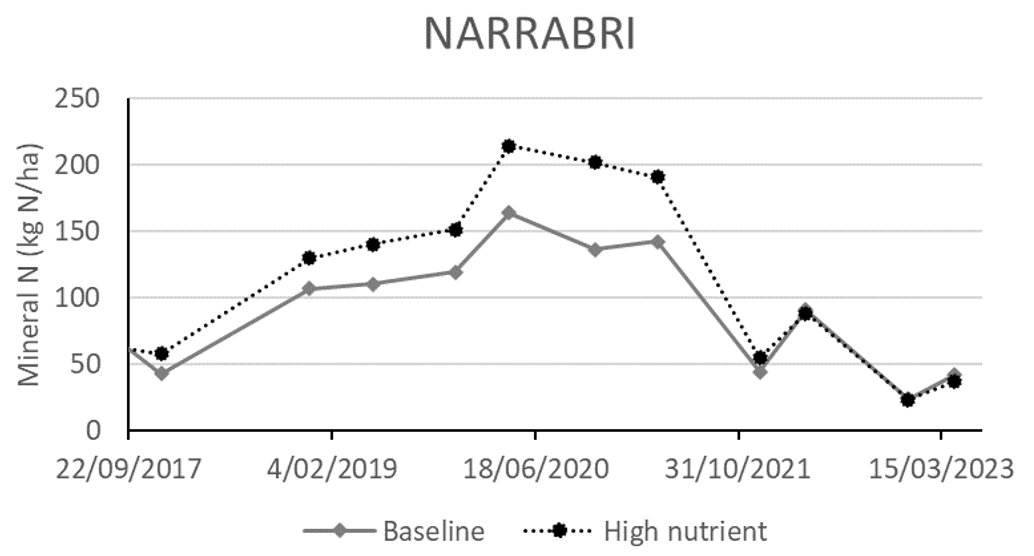
The legacy of applying additional fertiliser N also led to greater residual mineral N across seasons. At Narrabri we found a difference between the Baseline and Higher nutrient system from 2017 through to 2021 (Figure 3). The difference ranged between 15 and 61 kg N/ha. The legacy lasted for a number of seasons, and was only diminished when grain yields exceeded 6 t/ha (2021).
Table 3. System fertiliser use and export rates in Baseline and High nutrient systems from 2015 - 2022.
Cumulative applied N fertiliser | Cumulative exported N | Cumulative system N use | System NUE | Average summer | ||||||
|---|---|---|---|---|---|---|---|---|---|---|
| kg N/ha | kg N/ha | kg N/ha | kg/kg N | kg N/ha | |||||
System | Baseline | High nutrient | Baseline | High nutrient | Baseline | High nutrient | Baseline | High nutrient | Baseline | High nutrient |
Billa Billa | 17 | 76 | 547 | 608 | 592 | 737 | 0.92 | 0.82 | 58 | 45 |
Emerald | 96 | 120 | 568 | 586 | 549 | 516 | 1.03 | 1.14 | 70 | 60 |
Mungindi | 83 | 161 | 213 | 271 | 297 | 310 | 0.72 | 0.87 | 37 | 6 |
Narrabri | 257 | 567 | 502 | 517 | 346 | 665 | 1.45 | 0.78 | 20 | 23 |
Spring Ridge | 384 | 599 | 738 | 768 | 326 | 481 | 2.26 | 1.6 | 26 | 51 |
Pampas | 263 | 456 | 721 | 737 | 748 | 903 | 0.96 | 0.82 | 61 | 63 |
Trangie Gray | 161 | 261 | 427 | 367 | 327 | 251 | 1.68 | 1.31 | 24 | 26 |
Trangie Red | 186 | 384 | 295 | 332 | 288 | 150 | 1.02 | 2.21 | 15 | 10 |
exp mean | 165 | 302 | 475 | 502 | 409 | 489 | 1.26 | 1.19 | 39 | 36 |
Figure 2. Long-term dynamic soil mineral nitrogen of a Higher nutrient and Baseline cropping system at Spring Ridge (2015–2022)
Figure 3. Long-term dynamic soil mineral nitrogen of a Higher nutrient and Baseline cropping system at Narrabri (2017–2023)
Conclusion
The importance of achieving a balance between input rates of fertiliser and fertiliser recovery is crucial for farming systems. There can be benefits to applying higher rates of fertiliser, but growers should always monitor their cropping soils and export levels to ensure non-productive losses are minimal. Evaluating fertiliser use across your cropping systems rather than on a per crop basis will further improve the understanding of the system sustainability. The cycling of N from past crop residue and organic sources is highly efficient and can be a significant source of nutrients for future crops. Practices that encourage build-up of N in organic matter should be a consideration when assessing soil fertility management options.
References
Chen et al (2008). Prospects of improving efficiency of fertiliser nitrogen in Australian agriculture: a review of enhanced efficiency fertilisers. Journal of Soil Research, Vol. 46.
Dowling C (2023). Is it time to challenge current nitrogen strategies tactics and rules of thumb?
Schwenke G (2022). Nitrogen loss pathways – how much do we lose and in what form under different situations.
Acknowledgements
The research undertaken as part of this project is made possible by the significant contributions of growers through both trial cooperation and the support of the GRDC, the author would like to thank them for their continued support.
Contact details
Jon Baird
NSW DPI
21888 Kamilaroi Hwy, Narrabri
Ph: 0429 136581
Email: jon.baird@dpi.nsw.gov.au
Date published
February 2024
GRDC Project Code: CSP1406-007RTX, DAQ1406-003RTX,
Was this page helpful?
YOUR FEEDBACK


