Farming system performance over the short and long term impacts on profitability and sustainability indicators on the eastern Darling Downs Qld
Farming system performance over the short and long term impacts on profitability and sustainability indicators on the eastern Darling Downs Qld
Author: Lindsay Bell (CSIRO) , Jeremy Whish (CSIRO), Heidi Horan(CSIRO) | Date: 01 Aug 2024
Take home message
- Farming system decisions, particularly the soil water required for sowing, can have a large influence on system profitability over the short and long-term; differences of >$100/ha/yr occur regularly
- Systems using a wider diversity of crops can not only help manage biotic threats (e.g. diseases and weeds) but also be profitable compared with conventional systems
- While the last 6 years have presented a diverse range of seasons, this period in general has not favoured alternative farming systems compared to the Baseline
- Simulated predictions of relative profitability of the systems generally correspond well with those calculated from experimental data over the same period.
Introduction
The northern farming systems project has been examining how different farming system strategies impact on various aspects of the farming system since 2015. Across a diverse range of production environments, we have tested the impacts of changing:
- The mix of crops grown by increasing the frequency of legumes or diversifying crop choices to provide disease breaks, or
- The intensity of the cropping system by either increasing it by reducing the soil water threshold to sow more crops or by reducing it and only growing higher profit crops once the soil profile is full; and
- The supply of nutrients provided to crops to target either average yields or to maximise yield potential in any season.
Despite now collecting 9 years of data on each of these different farming strategies, the full range of climatic conditions that are experienced across the region have not been captured. In particular, most sites have experienced periods of extremely dry seasons and some extremely wet seasons over the past 9 years, which is likely to bias or favour some particular farming systems. In addition to looking at the relative performance of these systems over our experimental period, simulation modelling can be useful to help explore how the different farming strategies might perform over the longer-term and under a wider range of climatic conditions. In this paper we compare APSIM predictions of system profitability and sustainability indicators over the long term along with predictions and observed data for the period 2015–2022. This paper reports specifically on results from the core farming systems site at Pampas on the Eastern Darling Downs, but similar analysis has been completed for other sites across the region.
System simulations and estimates of profitability
The different farming systems were simulated from 1957 to 2023 using APSIM. Soils used in simulations were those characterised at each location, and long-term climate data was sourced from the closest meteorological station. For each farming system at each location, the simulation was provided a list of crops (prioritised), their sowing window, and minimum soil water required to allow them to be sown. The rules dictating crop choices, their sowing dates and soil water thresholds at the Pampas site are outlined in Table 1; other sites vary in the crop choices and agronomic management employed.
Table 1. Rules associated with crop priority, crop choice, crop frequency and plant-available water threshold required to be sown applied in the Baseline and 4 modified farming systems at Pampas long-term farming systems experiment and in long-term simulation analyses.
System | Crop choice rules | Crop choices | Crop priority (1 – lowest; 3 - highest) | Soil PAW required to trigger sowing | Crop freq. limits (crops in years) |
|---|---|---|---|---|---|
Baseline | No more than 3 winter cereals or sorghum consecutively ≥2 yrs between chickpea | Wheat Chickpea Barley Sorghum Mungbean | 2 3 1 2 1 | 150 150 150 150 100 | 2 in 3 1 in 3 1 in 3 3 in 4 1 in 3 |
High legume frequency | As above + Legume every second crop | As above + Faba bean Field pea Soybean | 2 1 3 | 150 150 200 | 1 in 3 1 in 3 1 in 3 |
Higher crop diversity | As in Baseline + ≥1 yr break after any crop ≥50% crops nematode resistant | As above + Canola Sunflower Millet Maize Cotton | 3 1 1 3 3 | 200 150 120 200 200 | 1 in 3 1 in 3 1 in 4 1 in 3 1 in 2 |
Higher crop intensity | As in baseline | Wheat Chickpea Barley Sorghum Mungbean | 2 3 1 2 1 | 100 100 100 100 70 | 2 in 3 1 in 3 1 in 3 3 in 4 1 in 3 |
Lower crop intensity | As in baseline | Wheat Chickpea Sorghum Mungbean Cotton | 2 3 1 3 3 | 200 200 200 150 200 | 2 in 3 1 in 3 3 in 4 1 in 3 1 in 2 |
Revenue, costs and gross margin for each crop were calculated using predicted grain yields and estimates of crop protection, non-N fertilisers and operational costs for each crop (see Table 2). Fertiliser inputs were simulated dynamically based on a crop budget targeting a median yield (N fertiliser was costed at $1.30/kg N), and fallow herbicide applications ($15/ha/spray) were also predicted using the model based on the number of germination events that occurred.
Given the dynamic nature and range of different crops across these simulations, only a single crop sequence was generated over the simulated period. To allow analysis of the climate-induced variability, the system gross margins were aggregated over a sequential 6-year period; for example, from 1957–1962, 1958–1963 and so on. Hence, a comparison could be made between what the simulations predicted would occur during the experimental period of 2015–2021 at Pampas compared to more than 50 other 6-year periods. There were differences in how costs were calculated, with simulations assuming a set crop input cost while experimental data used actual costs incurred. This meant there was always a difference in the actual gross margins estimated from the model compared to the actual costs attributed in the experiments, hence we compare the magnitude of the change compared to the Baseline system in both cases to show their relative performance.
Table 2. Assumed prices (10-year average, farm gate after grading/bagging/drying) and variable costs for inputs and operations (e.g. seed, pesticides, starter fertilisers, sowing, spraying) and harvest costs (for viable yields only) for each crop simulated.
Crop | Price | Variable crop Costs ($/ha) | Harvest costs ($/ha) |
|---|---|---|---|
Wheat | 269 | 175 | 40 |
Durum | 335 | 175 | 40 |
Barley | 218 | 175 | 40 |
Chickpea | 504 | 284 | 45 |
Sorghum | 221 | 221 | 55 |
Mungbean | 667 | 276 | 55 |
Faba bean | 382 | 341 | 40 |
Field pea | 382 | 341 | 40 |
Canola | 503 | 351 | 70 |
Soybean | 607 | 305 | 55 |
Sunflower | 1052 | 365 | 55 |
Maize | 250 | 218 | 55 |
Millet | 564 | 350 | 70 |
Cotton | 1800A | 774 | 280 |
A Calculated on total harvest assuming 45% cotton lint turnout and 55% seed.
Experimental differences in system performance
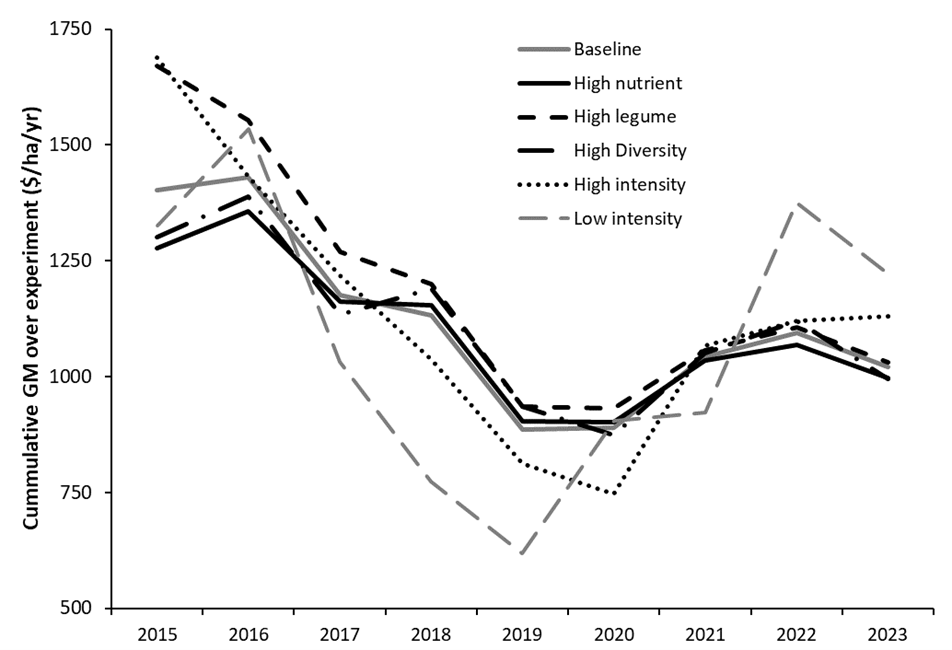
After over 9 years of implementing the farming systems experiments at Pampas, the largest impacts on system profitability have been associated with changes in crop intensity – with these systems being both positive and negative compared to the Baseline over the life of the project depending on the season (Table 3). As of March 2024, the highest return has been produced by the Low intensity system – however, over one third of the crop income from this system came from a high yielding (8 bale/ha) dryland cotton crop in 2022/23. At the same point in time the High intensity system has produced a higher gross margin than Baseline by about $100/ha/yr. However, these systems have varied significantly in their relative profitability over the past 9 years (Figure 1). The Low intensity system has been the lowest accumulated gross margin for over half the time, only recovering to exceed the others in summer 2022. Similarly, during the dry seasons of 2018–2019, the relative profitability of the Higher crop intensity system declined, but this has recovered again during the wetter period of 2021–2022.
Systems that have changed the mix of crops by either increased frequency of legumes or diversified crop choices, or where nutrient supply has been increased have changed the net gross margin little, with differences after 9 years of less than $40/ha/yr. After the initial years, these small differences have also been relatively stable and small (since 2017, Figure 1). During the first 3 years, the High legume system had the highest GM but in later years this earlier advantage has been diminished. Higher crop diversity system has also achieved similar levels of gross margin over this period, but in the summer of 2023 (data not shown) a highly profitable sunflower crop has elevated its relative profitability at this point in time.
Table 3. Total income, input costs and gross margin achieved over 9 years and the contributing individual GM of each crop amongst different farming system strategies at Pampas between April 2015 and January 2023. Costs incurred during fallows are attributed at the end of the fallow prior to sowing the next crop. Crops: Wt – Wheat, Sg – Sorghum, Cp – Chickpea, Mg – Mungbean, Fb – Fababean, Cn – Canola, Ct – Cotton, Dr – Durum, By – Barley.
System treatment | Baseline | High nutrient | High legume | High diversity | High intensity | Low intensity | ||||||
|---|---|---|---|---|---|---|---|---|---|---|---|---|
Total crop income ($/ha) | 11340 | 11500 | 11320 | 11080 | 12830 | 12780 | ||||||
Total input costs ($/ha) | 2160 | 2520 | 2040 | 2120 | 2650 | 1780 | ||||||
Total gross margin ($/ha) | 9180 | 8980 | 9280 | 8960 | 10180 | 11000 | ||||||
Annualised GM ($/ha/yr) | 1020 | 1000 | 1030 | 1000 | 1130 | 1220 | ||||||
Season | Crop by Crop GM ($/ha) | |||||||||||
Win 15 | Wt | 1539 | Wt | 1305 | Fb | 1806 | Cn | 1427 | Wt | 1636 | Wt | 1458 |
Sum 15 | X | X | X | X | Mg | 52 | X | |||||
Win 16 | X | -138 | X | -138 | X | -136 | X | -143 | X | -78 | X | -132 |
Sum 16 | Sg | 1459 | Sg | 1436 | Sg | 1437 | Sg | 1393 | Sg | 1256 | Ct | 1743 |
Win 17 | Cp | 725 | Cp | 827 | Cp | 757 | Cp | 722 | Cp | 748 | Wt | 164 |
Sum 17 | X | X | X | X | Sg | 36 | X | |||||
Win 18 | X | -57 | X | -57 | X | -57 | X | -57 | X | X | ||
Sum 18 | Sg | 999 | Sg | 1129 | Sg | 989 | Ct | 1293 | Sg | 495 | X | |
Win 19 | X | X | X | X | X | -20 | X | |||||
Sum 19 | X | X | X | X | Mg | -67 | X | |||||
Win 20 | X | -99 | X | -99 | X | -114 | X | -80 | X | -48 | X | -136 |
Sum 20 | Sg | 910 | Sg | 895 | Mg | 910 | Sg | 640 | Sg | 467 | Ct | 2334 |
Win 21 | Cp | 1074 | Cp | 875 | Wt | 1116 | Cp | 1019 | Cp | 1988 | X | -18 |
Sum 21 | Sg | 892 | Sg | 955 | Mg | 690 | Sg | 879 | Sg | 997 | Sg | 1050 |
Win 22 | Wt | 1460 | Wt | 1318 | Cp | 1449 | Dr | 1680 | Wt | 1498 | X | -85 |
Sum 22 | X | X | X | X | X | Ct | 4629 | |||||
Win 23 | Wt | 427 | Wt | 426 | Wt | 437 | X | By | 1220 | X | ||

Figure 1. Cumulative gross margin (i.e. from Apr 2015 to April of each ensuing year) over 9 experimental seasons between different farming systems at Pampas.
Crop sequences & frequencies amongst long-term simulated systems
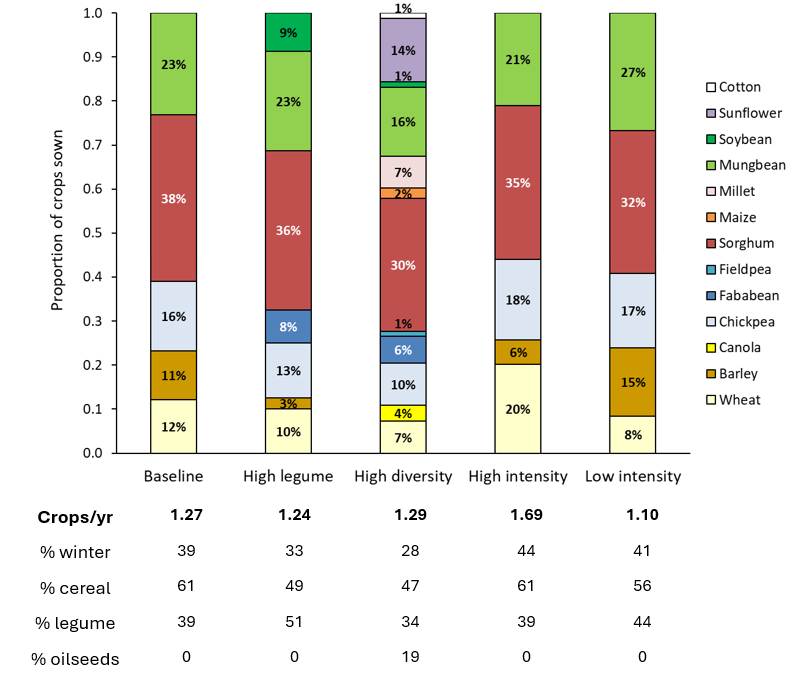
Long-term simulations of each of the experimental systems using the crop choices and rules described above resulted in quite distinct changes in the mix and intensity of crops grown over the long-term (Figure 2). At the Pampas site, applying our Baseline farming system rules predicted a long-term crop intensity of around 1.25 crops per year, or 5 crops in 4 years. About 40% of these crops were sorghum and 25% were mungbean; 20% were winter cereals and 15% were chickpea crops. By altering the system to apply our Higher legume frequency strategy resulted in a similar crop intensity but some additional soybean crops and faba bean replacing barley in the crop sequence (Figure 2). The Higher crop diversity system saw a drop in both legume and cereal frequency and less winter crops grown. Oilseeds increased to 20% of the crops grown – canola replacing barley and sunflowers replacing sorghum. Millet was also often substituted for mungbean as a summer double-crop and maize occasionally replaced sorghum. The Higher intensity strategy (i.e. lower soil water thresholds to sow crops) saw an increase in crop frequency by about 0.4 crops/yr (i.e. an additional 24 crops over the 60-year simulation), but the mix of crops was fairly similar to the Baseline. The Lower intensity system (i.e. a higher soil water threshold to sow crops) saw the crop frequency drop by 0.2 crops/yr – less than might be expected; the proportion of different crops also remained fairly stable except early-sown barley often replaced wheat.

Figure 2. Cropping intensity (crops/yr) and the proportion of different crops under different farming system strategies at Pampas over the long-term (60 year) simulation.
Long-term predictions of system profitability
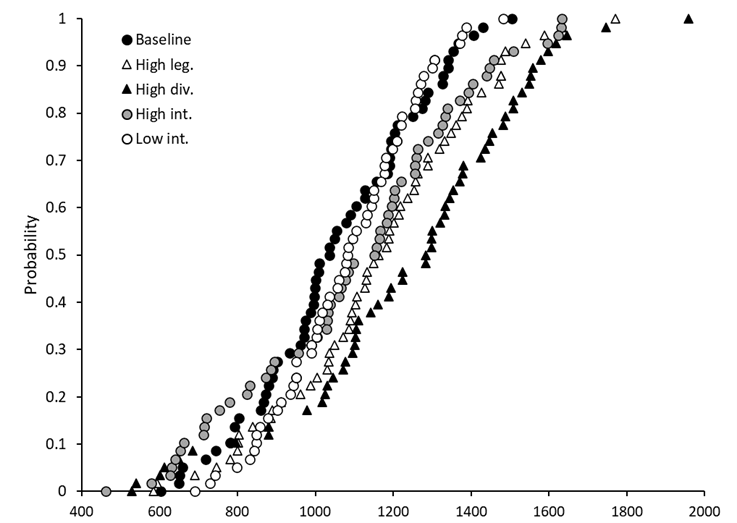
Figure 3 shows the range in average annual gross margin predicted over all the 6-year periods between 1957 and 2020 amongst the various simulated farming systems. These are arranged from the lowest to the highest to show the distribution of these predictions – this variability is driven only by climatic conditions as crop prices are held constant at 10-year average values.
The simulations suggest that across the full range of 6-year periods the Baseline system simulated here was never the most profitable choice. The Higher intensity system (grey circles) exceeds the profit generated in either the Baseline or Low intensity systems about 50% of the time, particularly under more favourable conditions. However, the Higher intensity system produces the lowest returns about 25% of the time when the overall profit is lowest. On the other hand, the Low intensity system (white circles) performs relatively well compared to Baseline and Higher intensity systems under the lower production and profit periods, exceeding them around 30% of the time.
The systems that alter the mix of crop (either Higher legume frequency or higher crop diversity) are predicted to generate higher profits over most periods. In general, they achieve similar potential profits to the other systems in the lower profitability periods, but potentially offer significant upside under more favourable conditions. In particular, these systems were able to offer a broader range of crop options to make use of seasonal rainfall and hence were more able to make use of additional crop opportunities when they occurred.

Figure 3. Distribution of simulated gross margin ($/ha, X-axis) (average of 6-years) over 60 years period (1957-2020) of different farming systems strategies at Pampas.
Short-term (experimental period) relative to the long-term
Comparing these long-term simulations with the experimental periods enables a comparison of observed differences in system profitability within a longer period. It also allows the comparison of differences in gross margin from both the experiments and the model predicted differences in gross profit. This paper compares the gross profit generated over the 2015–2022 period, as simulations are yet to be run the simulations for the whole period as reported above.
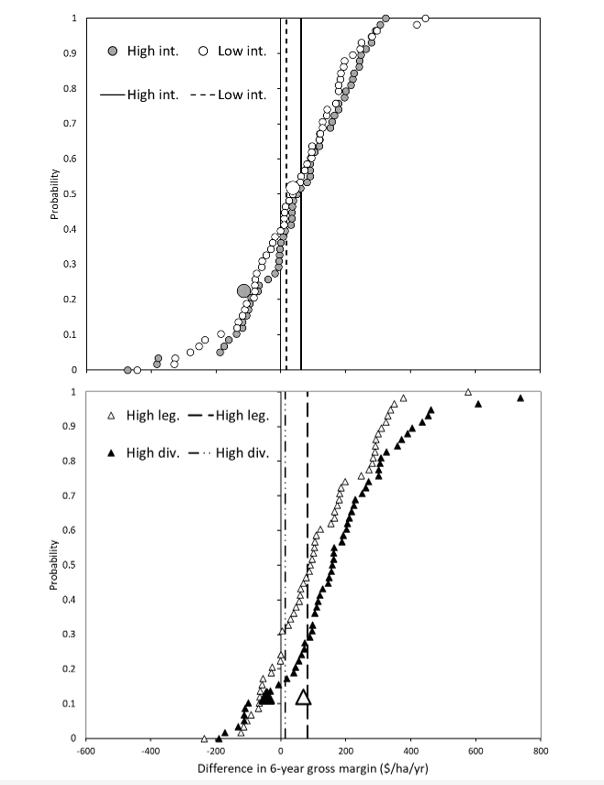
Figure 4 below presents similar results to those presented above in Figure 3, but this time just compares the predicted outcomes of each of the systems compared to the Baseline in each of the 6-year periods simulated. This shows that the modified farming systems frequently produce higher average returns (Figure 4); the Higher diversity systems produced higher returns 85% of the time, Higher legume systems 70% of the time, Higher and lower intensity systems about 60–70% of the time. However, the Higher/Lower intensity systems also had significantly lower profit in some periods compared to the Baseline.
The figure also includes what the model would have predicted to be the difference in gross margin between the Baseline and the altered systems over the experimental period (indicated by the larger symbols in Figure 4) – the vertical lines indicate the experimental findings. The model predicted that the Higher intensity system would be about $150/ha/yr behind, and this corresponded to the lower quartile of outcomes. However, this prediction is quite different from our experimental findings over this same period, where the Higher intensity system has generated around $60/ha/yr higher gross margin.
The observed and model predicted differences in gross margin corresponded well for the other systems. Over the experimental period the Higher legume system was predicted to be $70/ha/yr ahead of the Baseline, but the model predicted that over 90% of other 6-year periods would have generated further higher profits from this system. The Higher crop diversity system was predicted to produce slightly lower gross margin than the Baseline over the experimental period, but again over 90% of other periods would have generated relatively higher gross margins from this system. On the other hand, the Lower intensity has performed similarly to the Baseline over the experimental period, however this was around the median of these results, indicating that this experimental period was probably more favourable to this strategy than to the other systems.

Figure 4. Difference in simulated 6-year gross margin between the Baseline and: (top) Higher- or Lower Intensity systems; and (bottom) Higher legume frequency or Higher crop diversity systems at Pampas between 1957 and 2023. Small symbols show the difference in simulated annual returns between the systems over 54 different 6-year periods. Vertical lines indicate the experimentally determined differences in gross margin between each of the systems and the Baseline (2015–2022), the large symbol indicates the simulated difference over that same period and where this would have sat on the wider distribution of simulated periods.
Conclusions
Farming strategies or systems need to consider resilience and relative performance across the full range of likely climate variability. While our experimental work has captured a range of seasons, the modelling here adds further insight into how the various farming system strategies might perform over the long-term. The modelling predictions of the relative differences over the past 6 years correspond well with our experimental data over the same period. While some of the alternative systems have not proved to be advantageous over this experimental period, the long-term analysis suggests there is potential to make use of a greater diversity of crops which could add significant upside under more favourable growing seasons. Further examination of the influence of price variability and risk on these findings is required to understand how robust different strategies are, and the key factors that might influence this.
Acknowledgements
The research undertaken as part of this project is made possible by the significant contributions of growers through both trial cooperation and the support of the GRDC, the author would like to thank them for their continued support.
We acknowledge the various collaborators involved with collecting the experimental data and farmer collaborators for hosting the farming systems experiments across the region.
Contact details
Lindsay Bell
CSIRO
203 Tor St, Toowoomba, Qld, 4350.
Ph: 0409 881 988
Email: Lindsay.Bell@csiro.au
Date published
August 2024
GRDC Project Code: DAQ2007-004RMX,
