Valuing soil and plant testing for agronomic decisions
Valuing soil and plant testing for agronomic decisions
Author: Rick Llewellyn, Jackie Ouzman (CSIRO), Fiona Dempster (University of Western Australia), Therese McBeath (CSIRO), Roberto Busi (University of Western Australia) and Masood Azeem (CSIRO) | Date: 04 Feb 2025
Take home messages
- The potential for greater ‘data-driven’ decision making is rising but use of testing demonstrates the logistical and information-value constraints that need to be addressed.
- Technology has enabled the potential for more precise soil fertiliser application, however collection of annual soil-specific test data to inform annual paddock decisions for major nutrients, including N, is not a widespread routine practice.
- Similarly, paddock testing to confirm suspected herbicide resistance and/or confirm susceptibility to alternatives is not common practice, due to reasons relating to sampling and information value relative to other sources and experience.
- Placing test information and the particular uncertainty it can reduce in a broader strategic context, points to new value propositions for soil and plant testing.
Background
There is a rapidly increasing range of data and access to new cropping-related information, such as remote sensing and other sensor-based sources. This makes it timely to examine the current use of well-established sources of farm- and paddock-specific information. What can we learn from the current use of existing measurement and data opportunities for agronomic decision-making? And what does it tell us about the potential for new informational technologies and their potential role in farm-level decision-making in increasingly large-scale, labour-limited cropping scenarios?
As an example of testing new data-driven opportunities, Colaço et al. (2024) implemented an extensive field research program with twenty-one N strip trials in wheat and barley paddocks across Australia over four cropping seasons. The results highlighted the strong performance of the existing N fertiliser management strategies of the participating growers. Their uniform management was within 6% of the maximum profitability achievable using site-specific application (with hindsight) and was within 2% of the maximum profitability for a uniform application. The ‘grower’ rate also outperformed the ‘simplified mass balance’ approach and most univariate, sensor-based, digital N recommendation methods. While showing an opportunity to improve the profitability of N management by up to 6% through more data-intensive methods, it also highlighted diminishing gains in profitability as N management accuracy increases for many growers. Multivariate data-driven methods showed some potential to reduce error and increase profitability of fertiliser management, but they were heavily reliant on extensive historical field digital databases and on-farm experimental strips to characterise the field- and season-specific conditions. Conclusions pointed to the need for the cost of technological solutions for N management to be kept low, including consideration of labour and management time.
In this paper we bring together results from two studies, one exploring the use of soil and plant testing for crop nutrition management across the southern cropping region and a second looking at the use of testing of weeds for herbicide resistance status in the western grains region. We consider the role and value of such plant and soil-testing information in the context of shaping the type of ‘current grower practice’ used as a benchmark in the study described above.
Studies of the economics of grower use of testing services are often based on the assumption that the net utility of adoption needs to be positive if adoption is to occur, and this is primarily based on the relative value of the additional information gained in reducing uncertainty and risk (Fuglie and Bosch 1995). In addition to the cost of acquiring the data (including consideration of inconvenience, opportunity cost, sampling and testing), factors that contribute to net value of the test information include the prior level of information or understanding held (e.g. how much is already known and to what degree of certainty), and the accuracy of the new information gained from the testing (e.g. the degree to which the new information can inform existing understanding, including reducing uncertainty) (Babcock et al. 1996). Related factors affecting the value of specific information sources include the availability and quality of other ‘competing’ sources of information, such as local field observation or past observation/data. Another critical factor is the timeliness and the extent to which effective action can be implemented based on the new information. Using this common framework for considering information value, we examine the use of paddock-specific test information and how actual paddock-specific test information relates to grower perceptions and/or actions in the absence of the test information.
Method
Soil testing information
Prior to growers and advisers conducting a program of on-farm field trials, a survey was conducted to determine current status of soil testing. Results from interviews with 100 growers conducted through AgCommunicators as part of the ‘GRDC soil and plant testing for profitable fertiliser use’ project are presented here (see https://www.agronomysolutions.com.au/resources). In addition, the project team ran a series of eight workshops across South Australia and Victoria with collaborating growers and advisers. These regional workshops involved 41 participants involved in the project and gained ‘prior’ expectations of fertiliser rates for their nominated paddocks. Participants were asked about the lowest possible, most likely, and highest possible fertiliser rates they might apply, both at seeding and over the season. Over 2019 and 2020, a cohort of growers were invited to further participate in the project by implementing on-farm strip trials. Strip treatments of varying rates of either nitrogen (N) or phosphorus (P) fertilizer (informed by soil test-based recommendations and the local grower standard practice) were implemented, with yield mapping used to assess treatment outcomes.
Herbicide resistance testing information
In late 2020, agronomists collected weed seed samples, most commonly including Lolium rigidum (ryegrass) and Raphanus raphanistrum (wild radish), from mature crops in 128 paddocks belonging to 51 growers across the Western Australian wheatbelt using common protocols (Owen et al. 2015). About half of the sampled farms (52%) included cereals, canola/pulses together with grazed pastures, with the remainder being cropping-based and not including substantial grazing enterprises. In the following autumn, herbicide resistance tests were conducted on each weed sample using the method outlined in Busi and Beckie (2021). A total of 25 growers reported on their prior perceived herbicide resistance status for 12 herbicides for 97 paddocks across each weed seed sample they had tested.
Results and discussion
Nutrient testing
The survey results showed that 61% of growers did some soil testing in the previous season with a similar proportion considering soil testing as an action that increases profitability. Those that did soil test commonly tested less than 10% of the crop area in any one year. Sampling intensity was also low, with <5 samples per paddock being common and >15 samples per paddock being rare. More than 70% of growers and advisers stated that time or cost related factors were the main reason for not doing more soil N testing (time required for sampling 30%, cost of sampling 24%, lab cost 18%), with factors related to the ability to make use of the data being the next most common factor (the ability to translate soil tests results into a profitable fertiliser decision 13%, ability to represent variability in paddock 6%, timing of receiving results 6%). Only 3% stated the level of accuracy of lab testing as a factor. Results for plant sample testing indicated that time and cost (66%) were again the major factors that limited further amounts of plant testing.
Growers were asked in February 2019 what their planned fertiliser rates were for specific paddocks and the maximum extent to which they thought the final rates at sowing may vary from those February plans. They stated that they would only increase or decrease their planned fertiliser rate at seeding by an average maximum of +/-5kg of P and +/-11kg of N.
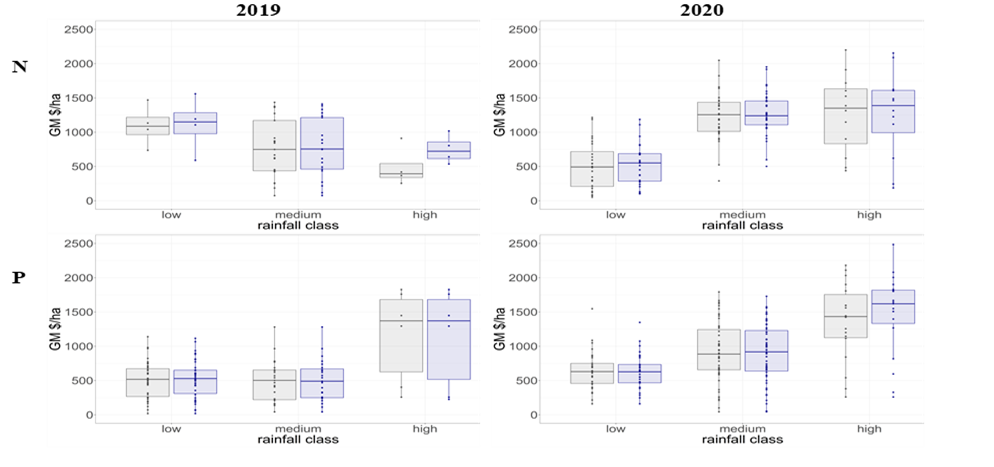 Figure 1. Box and whisker plots of GM results for nitrogen and phosphorus strip trials data grouped into rainfall class. Grey dots and box and whiskers are grower standard practice rates and blue are approximate recommended rate. Middle line in box is median, and lower and upper lines are 25% and 75%.
In the field strip trials, the gross margin of trial strips receiving the grower’s standard rates (uninformed by the test results) and those receiving rates based on recommendations from soil test results were generally similar. The planned grower fertiliser rates for N and P were often in line with the soil test-based recommended rates. Where differences did exist, profits were greater where the fertilizer rates were informed by the soil tests (Figure 1), generally reflecting effects on yield (data not shown). The results demonstrate how seasonal uncertainty and/or satisfactory grower rates (not informed by testing) mean that economic benefits from soil-testing may not be expected in a single season. The study also highlights how growers are often constrained in their responsiveness to fertiliser recommendations prior to seeding, for example, due to factors such as fertiliser supply and other logistics, leading to difficulties in changing fertiliser rates, let alone changing products. As reflected in the typical paddock soil testing frequency, growers often described their approach as ‘testing a paddock every few years’ to ‘keep track’, or ‘identify problems’ rather than annual testing every paddock to inform annual soil-specific fertiliser rates.
Herbicide resistance testing
The growers’ prior perception of herbicide resistance status was not entirely consistent with the test results. For example, it was relatively common for the test to indicate susceptibility when the growers had classified the weed population as having developing resistance. This may be partly explained by factors affecting control other than genetic resistance being attributed to resistance, although there is the possibility that some biotypes with a level of resistance may be less likely to be controlled under field conditions compared to test conditions. It was not common for growers to perceive susceptibility in populations that tests showed to be resistant (only 7% of paddock samples for wild radish and 1% ryegrass) and there was no statistically significant difference (P>0.1) between the likelihood of the test results being resistant and growers’ perception of herbicides being resistant. However, historically common forms of resistance were not included in this study (for example, testing ryegrass for diclofop and sulfonylurea resistance), as these herbicides are no longer used for that purpose, as the focus was on testing for discovery of forms of resistance that were not (yet) widespread (Dempster et al. 2022). It was more common for grower expectations to be aligned with test results for ryegrass (67%) than for wild radish (44%). This may be partly explained by the observability of these resistances, with the wild radish herbicides being more commonly used in mixes, making observation of the efficacy of a single herbicide active component more difficult.
Conclusion
Technology has enabled the potential for more precise fertiliser applications, however collection of annual soil-specific test data to inform annual paddock decisions for major nutrients, including N, is far from widespread or routine. Similarly, herbicide resistance and cross-resistance in major weeds to a widening range of herbicides is increasing (Broster et al. 2019), but testing to confirm suspected resistance and/or confirm susceptibility to alternatives is not common. In both examples, the cost and labour demand of sampling on large-scale farms are cited as major constraints and are likely increasing. However, the results primarily point to important factors limiting the relative value of the additional information for reducing uncertainty and improving decisions. These include typically sound existing practices and difficulty in clearly identifying common costly ‘wrong’ assumptions (e.g. herbicide resistance status) or practices, particularly under seasonal uncertainty (e.g. N rates). Alternative information sources (e.g. familiar resistance patterns, alternative herbicide efficacy patterns in neighbouring paddocks, occasional soil data or observed crop performance later in season), typically limit the benefits of the test information. Test information also comes with its own level of error, although concern about error at the level of the testing service/laboratory was not common. Opportunities for additional quality and timely paddock-specific information to offer benefit to decisions were identified, but so too was the need to keep acquisition costs and inconvenience low in increasingly large farms, where logistics and the highly unpredictable seasonal conditions experienced in Australian cropping are primary drivers. The results point to the value of recognising the effectiveness of many existing decision approaches within this context, and the available information and experience that has shaped the commonly applied ‘decision rules’. This then points to the opportunities for new data and test information to be best integrated to improve or ‘calibrate’, rather than replace, the less ‘data-driven’ decision approaches.
Acknowledgements
The research undertaken as part of this project is made possible by the significant contributions of growers through both trial cooperation and the support of the GRDC, the authors would like to thank them for their continued support. GRDC funded the studies that generated the results reported in this paper and the subsequent contributions from RiskWi$e (https://research.csiro.au/riskwise). The contributions of Sean Mason (Agronomy Solutions), Harm van Rees (Cropfacts), Belinda Cay (AgCommunicators), APAL, and advisers is gratefully acknowledged. UWA Human Ethics approval ET000244.
References
Babcock BA, Carriquiry AL, Stern HS (1996) Evaluation of soil test information in agricultural decision-making. Journal of the Royal Statistical Society, Series C (Applied Statistics) 45, 447-461.
Broster JC, Pratley JE, Ip RHL, Ang L, Seng KP (2019) A quarter of a century of monitoring herbicide resistance in Lolium rigidum in Australia. Crop and Pasture Science 70, 283-293.
Busi R, Beckie HJ (2021) Are herbicide mixtures unaffected by resistance? A case study with Lolium rigidum. Weed Research 61, 92-99.
Colaço AF, Whelan BM, Bramley RGV, Richetti J, Fajardo M, McCarthy AC, Perry EM, Bender A, Leo S, Fitzgerald GJ, Lawes RA (2024) Digital strategies for nitrogen management in grain production systems: lessons from multi-method assessment using on-farm experimentation. Precision Agriculture 25, 983-1013.
Dempster F, Llewellyn R, Azeem M, Busi R (2022) Yes, no, maybe – getting value from herbicide resistance testing. Proceeding GRDC Grains Research Update, Perth, March, 2022 (https://grdc.com.au/resources-and-publications/grdc-update-papers/tab-content/grdc-update-papers/2022/03/yes,-no,-maybe-getting-value-from-herbicide-resistance-testing)
Fuglie KO, Bosch DJ (1995) Economic and environmental implications of soil nitrogen testing: a switching-regression analysis. American Journal of Agricultural Economics 77, 891-900.
Owen MJ, Martinez, NJ, Powles SB (2015) Multiple herbicide-resistant wild radish (Raphanus raphanistrum) populations dominate Western Australian cropping fields. Crop and Pasture Science 66, 1079-1085.
Contact details
Rick Llewellyn
CSIRO, Waite Campus
0429 690 861
rick.llewellyn@csiro.au
GRDC Project Code: CSP2303-015BGX, UWA2006-006SAX, ASO1805-001RTX,