Using existing soil and landscape data sources to estimate plant available water capacity (PAWC) for decision-making and crop resourcing (with Central Queensland examples)
Using existing soil and landscape data sources to estimate plant available water capacity (PAWC) for decision-making and crop resourcing (with Central Queensland examples)
Take home messages
- Plant available water (PAW) is a key determinant of potential yield in dryland agriculture. Obtaining a measurement or estimate of PAW informs crop management decisions relating to crop type, time of sowing and the level of fertiliser inputs
- Estimating PAW, whether through soil coring, use of a soil water monitoring device or a push probe, requires knowledge of the plant available water capacity (PAWC) of a soil, which is affected by soil properties and subsoil constraints
- PAWC characterisations are publicly available in the APSoil database, which can be viewed in Google Earth and in the ‘SoilMapp’ application for iPad and Android. However, the nearest characterisation is not necessarily the most appropriate one as the soil properties may differ
- Relationships between soil properties, parent material and position in the landscape are reflected in soil and landscape information available online through the Queensland Globe and NSW eSPADE, as well as in digital soil maps like the Soil and Landscape Grid of Australia that provide predictions of soil properties at finer resolution
- Estimating PAWC relies on combining the available information with local observations which is guided by a five-step method. The methodology is region specific due to the available information and nature of different landscapes. In landscapes with highly variable PAWC, such as the Central Highlands undulating downs soils where soil depth varies considerably over short distances, yield mapping across multiple years contains valuable information that should be explored for recurring patterns.
Plant available water and crop management decisions
The amount of water available to a crop, either from rainfall, stored soil water or irrigation, is a key determinant of potential yield. In the GRDC northern region the contribution of stored, plant available water (PAW) to crop productivity for both winter and summer cropping has long been recognised. The amount of stored soil water influences decisions to plant or wait (for the next opportunity), to sow earlier or later (and associated crop and variety choices) and the input level of resources such as nitrogen fertiliser. For example, Whish (2014) demonstrated the trade-offs between stored soil water and in-season rainfall in the context of sowing time decisions for sorghum and Rodriguez et al. (2011) show an example of crop choice rules for opportunistic cropping in Central Queensland that draw largely on PAW.
The amount of PAW is affected by pre-season and in-season rainfall, infiltration, evaporation from the soil and transpiration by the crop. It also strongly depends on a soil’s Plant Available Water Capacity (PAWC), which is the total amount of water a soil can store and release to different crops. The PAWC, or ‘bucket size’, depends on the soil’s physical and chemical characteristics as well as the crop being grown. The PAW reflects how full that ‘bucket’ is (Figure 1).
Measuring PAWC
The PAWC can be determined in the field following procedures described in the GRDC PAWC Booklet ‘Estimating plant available water capacity’ (Burk and Dalgliesh, 2013). This method will usually provide the best estimate for a location of interest, although there are some pitfalls and common mischaracterization issues that need to be avoided (Verburg et al., 2017).
Over the past 20 years, CSIRO in collaboration with state agencies, catchment management organisations, consultants and farmers has characterised more than 1100 sites around Australia for PAWC. The data are publicly available in the APSoil database, including via a Google Earth file and in the ‘SoilMapp’ application for iPad and Android (see Resources section).
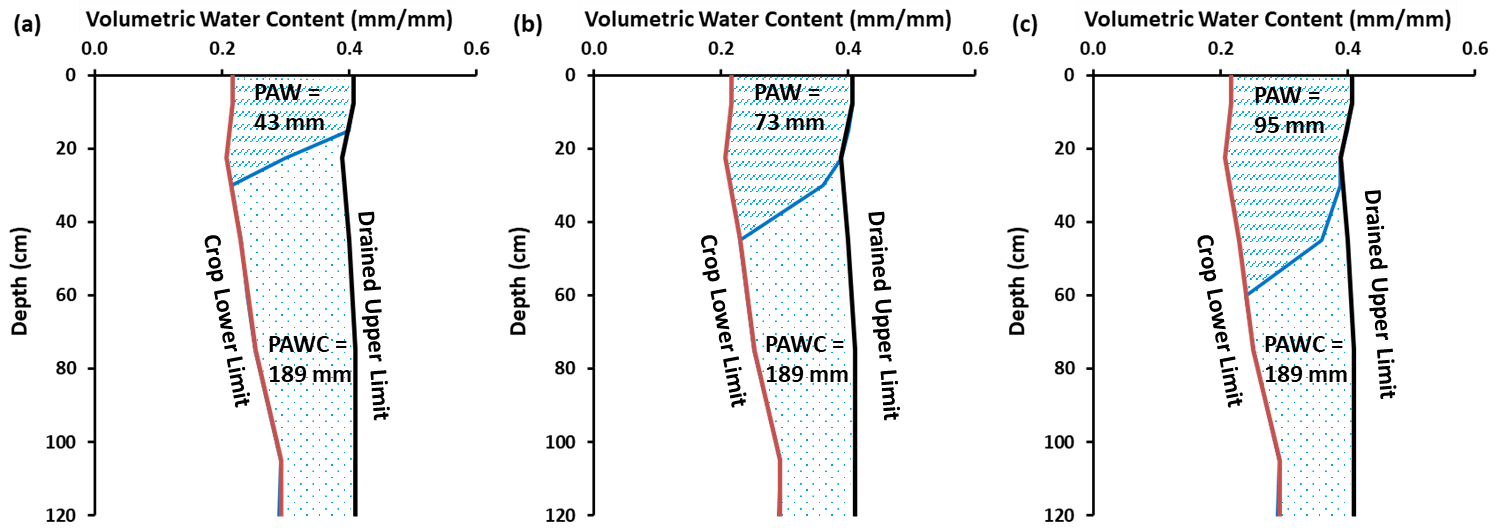
Figure 1. The Plant Available Water Capacity (PAWC) is the total amount of water that each soil type can store and release to different crops and is defined by its Drained Upper Limit (DUL) and its crop specific Crop Lower Limit (CLL); Plant Available Water (PAW) represents the volume of water stored within the soil available to the plant at a point in time. It is defined by the difference between the current volumetric soil water content and the CLL. Three levels of PAW are shown for APSoil No1269 near Gindie, Qld
Estimating PAWC
The data contained in the APSoil database can be used to obtain an estimate of PAWC when it is not possible to determine PAWC in the field. However, the nearest APSoil PAWC characterisation may not be the most appropriate as its soil properties could be quite different. PAWC is affected by soil properties like soil texture, stones and gravel and chemical constraints. It is hence important to find an APSoil that has similar soil properties as those at the location of interest.
Within a specific region the soil properties that affect PAWC are influenced most by landscape position and parent material (the source of sediments or type of rock in which the soils are formed). Soil surveys that produce maps of soil-landscape units (SLUs) or land resource areas (LRAs) draw on that by grouping parts of the landscape that have similarity in landscape position and parent material. Vegetation has an influence too and can also often serve as an indicator.
The same concepts also sit behind digital soil mapping that predicts soil properties on a grid using spatial models that describe how site soil data relate to other environmental information layers, called covariates. These include soil and parent material indicators (e.g. information from gamma radiometrics), climate variables (e.g. rainfall, potential evaporation), existing soil maps and information on vegetation (e.g. land cover, NDVI) and terrain and landscape position (e.g. elevation, slope, orientation of slope). The Soil and Landscape Grid of Australia (SLGA) provides predictions at 90 m resolution across Australia and in NSW the eSPADE online tool provides mapping at a 100 m grid.
In this project we explore whether we can draw on the soil-landscape or land resource area mapping information to help estimate PAWC and find an APSoil with similar soil properties. We are testing this in several case study areas, including Queensland Central Darling Downs (Thomas et al. 2019) and Central Highlands (Thomas et al. 2020), and NSW Macquarie-Bogan Floodplain and Moree Plains (Stockmann et al. 2020a,b; Verburg et al. 2020) and Liverpool Plains (Cocks et al. 2020). Here we share some of the findings from the Central Highlands case study.
Information available for Central Highlands
The Central Highlands in Queensland currently include 13 APSoil characterisations which can be viewed in Google Earth (see Resources Section for the link) or in the Soilmapp app.
Land Resource Area (LRA) mapping was carried out in a project by Thwaites and Maher (1993). It is available through the Queensland Globe (see resource section) with a wealth of information contained in the accompanying Field Manual (Bourne and Tuck, 1993a) and Resource Information (Bourne and Tuck, 1993b). The Queensland Globe also includes information on soil profile descriptions, and where available associated soil data, from many historical soil sampling exercises.
Over geological times the landscape of the Central Highlands has undergone deep weathering of rocks and experienced periods of basalt flows and erosion, as well as deposition of alluvial materials in some parts. This has resulted in today’s landscape being dominated by undulating to level plains in between hills, peaks and ridges of resistant quartz-rich materials. The resulting landscape is reflected in the LRA mapping which consists of six broad landscape units: Alluvial Plains, Undulating Scrub Plains, Eucalypt Duplex Plains, Undulating Downs, Plateaus and Ranges LRAs.
Cropping is limited to three of these LRAs: on plains with deep, heavy clays in the Alluvial Plains LRA, on soils formed from deposition of weathered sediments in the Undulating Scrub Plains LRA and on heavy clay soils formed in situ on basalt and other fine-grained sedimentary rocks in the Undulating Downs LRA (Resource Information, Bourne and Tuck, 1993b).
Within these LRAs eighteen ‘Agricultural Management Units’ (AMUs) are distinguished. These are groups of similar soils and not mapped. However, the information in the Field Manual and Resource Information allow them to be recognised based on soil characteristics, landscape position and native vegetation indicators (see Table 1). The number of AMUs in each LRA is limited, which makes it possible to narrow down quite quickly to one or two candidate AMUs using the information on nature of the profile, surface condition, parent material and (native) vegetation.
The Field Manual suggests a stepwise approach to determining the major soil for a site. As in our work for the Central Darling Downs (Thomas et al. 2019) we build on this for a 5-step PAWC estimation process.
Table 1. Examples of AMUs within the Undulating Scrub Plains and Undulating Downs LRAs; information obtained from Field Manual and Resource Information (Bourne and Tuck, 1993a,b)
LRA | AMU | Description (Field Manual) | PAWC constraints (Resource Information) |
|---|---|---|---|
2. Undulating Scrub Plains LRA | |||
Uniform clays | Adelong | Self-mulching, dark or grey cracking clays of brigalow/coolabah scrub with yellowwood on alluvial plains. | Occasional low subsoil salinity at depth |
Picardy | Deep, red, brown to grey cracking clays under brigalow, softwood scrub or gidgee scrub. | Occasional subsoil salinity at depth | |
Rolleston | Deep, cracking grey to brown clays formed from highly weathered sediments under brigalow/eucalypt scrub. | Hard sodic clay subsoils, subsoil salinity | |
Lonesome | Melon holed grey and brown clays on brigalow scrub plains. | Subsoil salinity | |
Springton | Red to brown cracking and non-cracking clays usually on upper slopes of undulating scrub country. | Hard coarse subsoils, gravel or parent rock | |
Duplex soils | Glengallan | Thin, sandy-surfaced yellow-brown duplex soils; hard setting surface overlies coarse, impervious clay subsoils under brigalow/eucalypt scrub. | Coarse sodic clay |
Glenidol | Red to brown duplex soils which are moderately structured and well drained under brigalow scrub. | Hard clay subsoils or gravel | |
Turkey Creek | Grey to brown duplex soils with thin sandy surfaces on undulating brigalow scrub country. | Hard coarse subsoils or gravel, occasional subsoil salinity | |
4. Undulating Downs LRA | |||
Uniform clays | Orion | Deep, cracking dark clays on undulating downs on basalt. | Depth to bedrock |
Kia-Ora | Black cracking clays with a strong fine granular surface mulch on undulating open downs formed on shales. | Depth to bedrock | |
Moramana | Deep, red-brown to grey uniform clays on broad to narrow, occasionally deeply incised, alluvial plains draining basalt landscapes. | ||
Shallow soil | Jimbaroo | Shallow cracking and non-cracking clays on undulating open downs formed on basalt. | Depth to bedrock |
Duplex soils | Glen Idol | Red to brown duplex soils which are moderately structured and well drained under brigalow scrub. | Hard clay subsoils or gravel |
Example 5-step PAWC estimation process
Here we discuss 5 steps of a PAWC estimation process that draws on the available soil and landscape information. We illustrate the steps for an example paddock near Capella in the Central Highlands.
Step 1: Determine the LRA for your site
Viewing the location of the paddock in Google Earth along with LRA map, we find it is located within the Undulating Downs unit (Figure 3). Descriptions of this LRA unit in the Field Manual of “Gently undulating to undulating plains and rises” matches the landscape. The soils for this unit are described as “Black, brown and grey cracking and non-cracking clays, shallow to moderately deep, frequently stony” and the vegetation as “Mainly grasses with scattered mountain coolabah, bloodwood and silver leaved ironbark”. Both match local observations.
Note that when a paddock of interest is close to the boundary between two LRA units, it is important to consider the descriptions of both units as the lines are approximate and do not represent sharp boundaries.
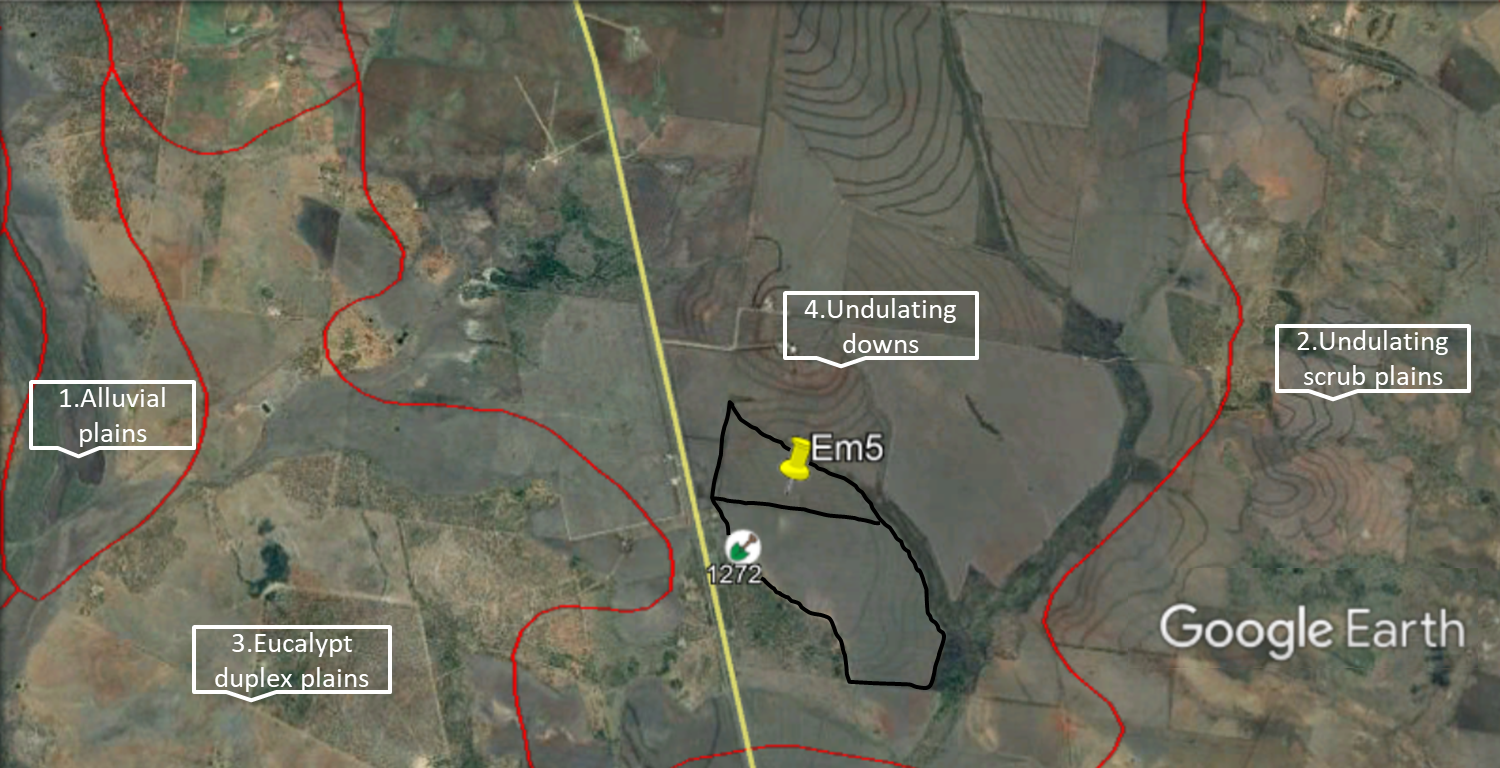 Figure 2. Example paddock (marked with Em5) located within the ‘Undulating downs’ unit of the Land Resource Areas map for the Central Highlands (accompanying Twaites and Maher (1993) available via Queensland Globe.
Step 2: Determine likely soil type or AMU
As part of this step we first collected all available observations about the soils in the paddock. In addition to our own observations of soil texture, structure, colour and depth at four points along a sampling transect, this particular paddock also had 9 historical soil sampling points with the soil profile descriptions available in Queensland Globe (Figure 4a). The descriptions of the soil profiles were remarkably similar describing the soils as black, self-mulching Vertosols overlying basalt, i.e. cracking clay soils in which the dominant soil colour is black (very dark grey-brown to black). Both soil sampling exercises noted a highly variable soil depth ranging from 70 to 160 cm for these 13 points within the paddock. In addition, a study by Lynch and Dougall (2007) measured soil depth for 140 points in the northern part of the paddock, with depths ranging from 42 to 155 cm.
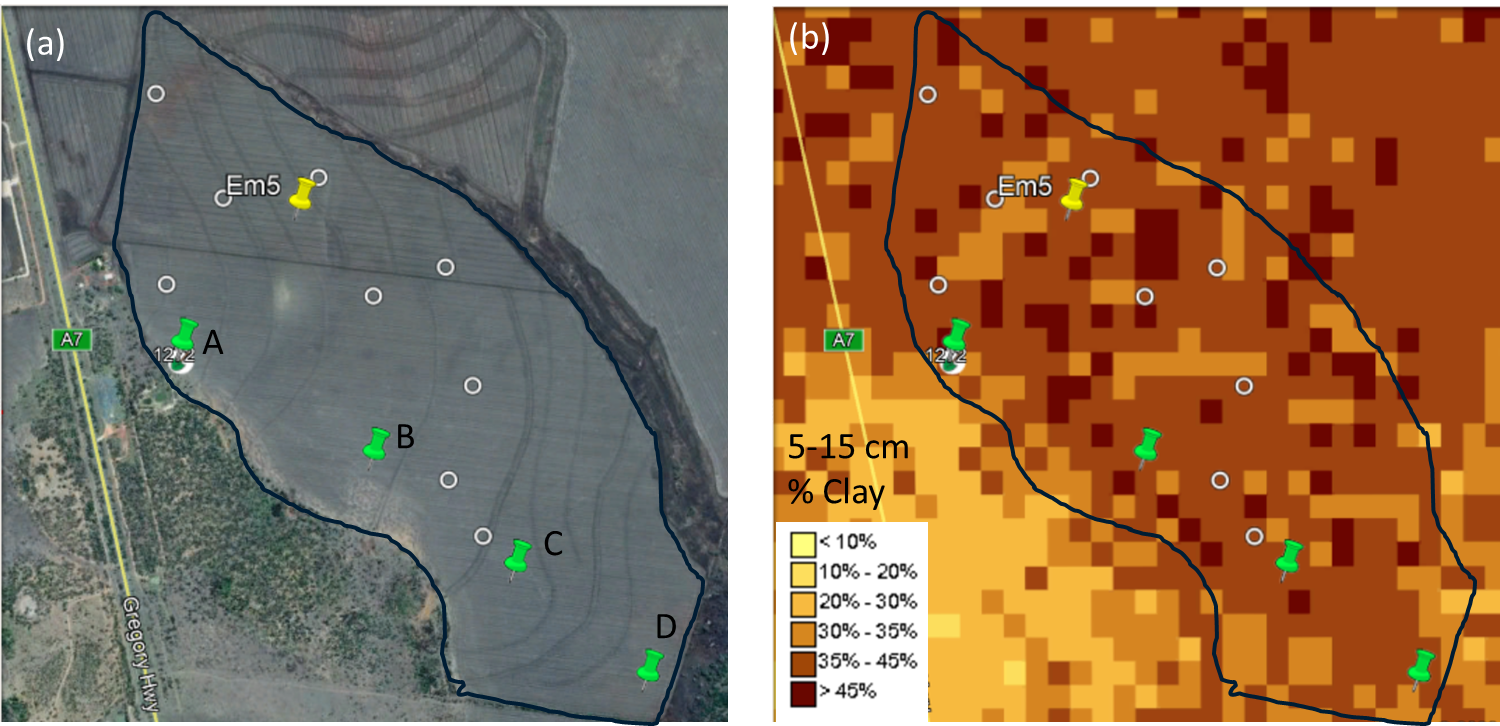
Figure 3. (a) Locations within the paddock with soil profile information available in Queensland Globe (circles) and CSIRO transect sampling (green pins); (b) Predicted % clay for the 5-15 cm layer from the Soil and Landscape Grid of Australia.
Drawing on the soil property observations and the “Keys to identifying Agricultural Management Units (AMU) of the Central Highlands” in the Field Manual the soil/AMU of the paddock was identified as Orion (Figure 2. The descriptions in the Field Manual matched the observations and both the Field Manual and the Resource Information noted the “high PAWC” of the soil material, but “variability of depth and PAWC” as limitation. The descriptions also noted the AMU is “non sodic and non-saline”.
Step 3: Corroborate with information from digital soil map
The digital soil map predictions of % clay for the surface (5-15 cm) layer (Figure 3b) and subsoil (60-100 cm) layer (not shown) confirmed the high clay content throughout the soil profile (>30% in surface, > 35% in subsoil). Slight variation in surface clay content could have a small effect on PAWC, but given that this is a national map, the individual pixel values should not be overinterpreted and clay content is high across the paddock. The map does indicate that the uncropped area south-west of the paddock has a different soil type, with a lower clay content in the surface indicating a duplex soil.
Step 4: Estimate PAWC
The example paddock was fortunate to have a local APSoil profile (Figure 4a). This APSoil No1272 had a field measured PAWC of 169 mm to 90 cm. The volumetric CLL is relatively high at 0.28 mm/mm, which relates to its high clay content (67-74%; Lynch and Dougall, 2007). Clay content can affect the positions of the CLL and DUL slightly, although measurement error and the bulk density used to convert gravimetric to volumetric water content can also affect this. Other APSoils are listed in Table 2.
The Resource Information ranked the Orion AMU as having a high PAWC, or between 12 and 15%. This value relates to the difference between DUL and CLL, so that the soil depth still needs to be accounted for as well. APSoil No1272 had a slightly higher PAWC (DUL – CLL) of approximately 18%.
The CSIRO project also predicted PAWC using pedotransfer functions and information from the digital soil map (Soil and Landscape Grid of Australia), which resulted in PAWCs between 15 and 17% on average across the first 1 m of soil.
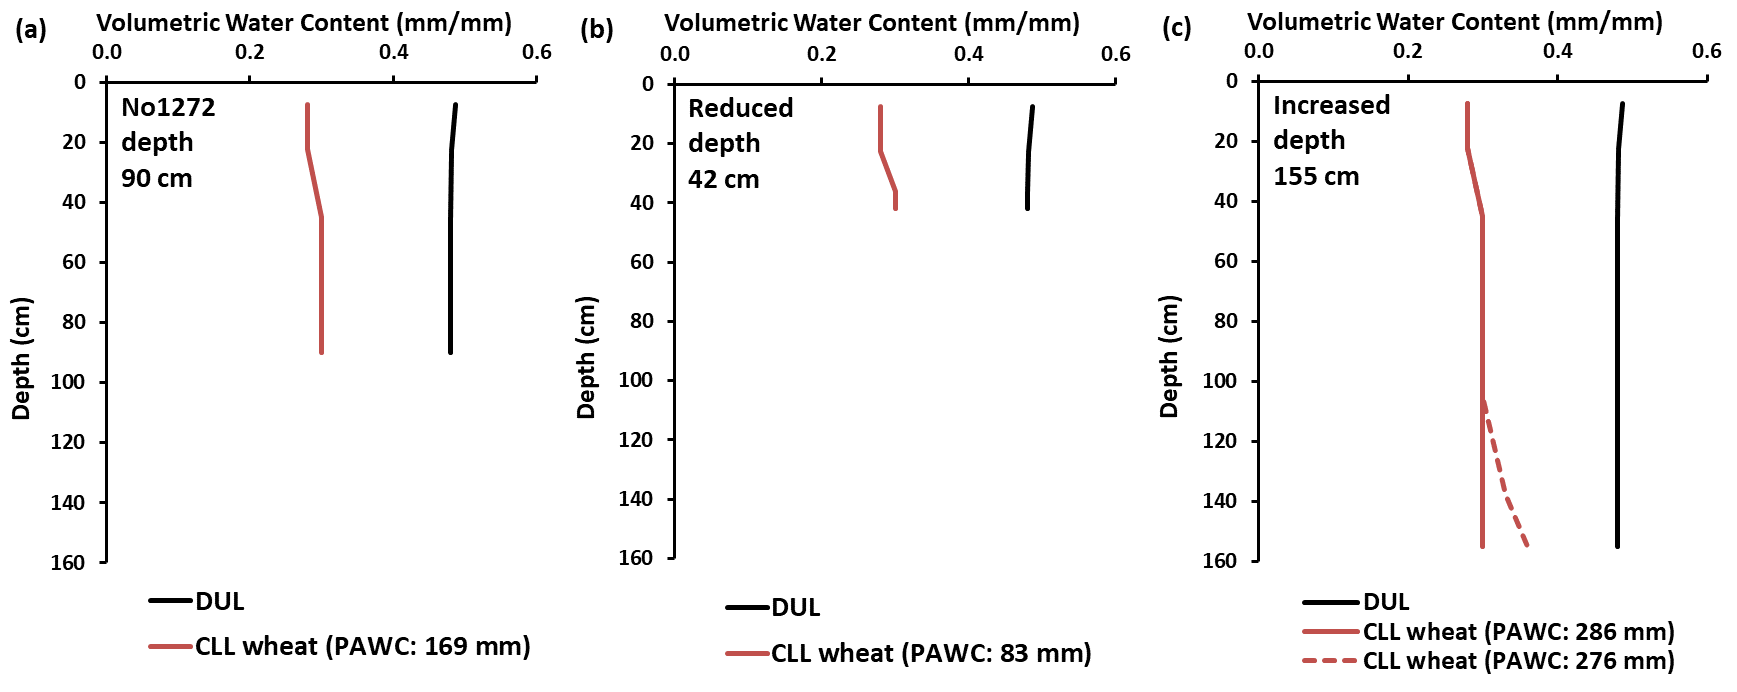 Figure 4. (a) APSoil No1272 and depth adjusted profiles for soil depths of (b) 42 cm and (c) 155 cm; with deeper profiles the CLL may need to be tapered a little to adjust for reduced rooting at depth.
Table 2. Select APSoil profiles within the area of the Central Highland LRA map.
APSoil | Land Resource Area (LRA) | PAWC (mm) | Notes |
|---|---|---|---|
1261 | Undulating Downs | 261 (to 180 cm) | CLL estimated and may be too high at depth in absence of salinity |
1264 | Undulating Downs | 230 (to 150 cm) | CLL estimated, DUL 90-120 cm layer affected by basalt rubble |
1266 | Undulating Downs | 175 (to 90 cm) | CLL estimated, DUL 60-90 cm affected by basalt rubble |
1267 | Undulating Downs | 159 (to 90 cm) | |
1272 | Undulating Downs | 169 (to 90 cm) | |
1275 | Undulating Downs | 213 (to 120 cm) | CLL estimated |
1276 | Undulating Downs | 160 (to 90 cm) | CLL estimated, DUL 60-90 cm layer possibly affected by basalt rubble |
106 | Undulating Scrub Plains | 137 (to 150 cm) | PAWC profile suggests soil may be affected by subsoil salinity at depth |
1263 | Undulating Scrub Plains | 272 (to 180 cm) | CLL estimated and does not account sufficiently for subsoil salinity below 120 cm, overestimating PAWC |
1269 | Undulating Scrub Plains | 189 (to 120 cm) | Self-mulching cracking clay |
Step 5: Adjust PAWC to local conditions (soil depth, subsoil salinity, yield history)
The final step in the process of estimating PAWC involves adjusting the PAWC % estimate or APSoil PAWC profile to local conditions. The information gathered at Step 2 indicated that subsoil salinity was not a rooting limitation for the soil in the example paddock, but soil depth was. To estimate the profile PAWC, the depth of the APSoil profile can be adjusted by truncating the profile for a shallower depth (Figure 4b) or extrapolating the properties to deeper depth (Figure 4a). For the range of soil depths observed by Lynch and Dougall (2007) and using APSoil No1272 as our starting point, this results in profile PAWCs ranging from 83 to ~286 mm.
Some Undulating Scrub Plain soils are known to experience subsoil salinity (Table 1). The severity of the salinity will depend on landscape position, with lower lying areas that are less well drained most susceptible. Mottled soil colours in the subsoil are often an indicator and where subsoil salinity is suspected, a chloride measure can provide an indication of its severity (Dang et al. 2008). The effect of subsoil salinity is an increase of the CLL, bringing it closer to the DUL and reducing the PAWC. The magnitude of the reduction in PAWC is dependent on the level of chloride (Hochman et al., 2007). Levels above approximately 300 ppm will start to have an impact on the CLL, with levels above 600 ppm seeing significant reductions and above 1200-1500 ppm generally resulting in a ‘closing of the bucket’ (CLL meeting DUL), although these indicative thresholds are crop specific with pulses more sensitive than wheat or sorghum.
It is important to ‘road test’ the estimated PAWC, for example by assessing against yield observations. Over time this may prompt some further adjustments to the PAWC profile. For Undulating Downs soils, local growers and advisors have noted that some shallow soils can achieve higher yields than expected based on soil depth determined by soil coring. It is possible that measured soil depth underestimates the depth of crop rooting. Crop roots may be able to access water in the basalt rubble that the soil core could not get through or in cracks and fissures within the basalt rock. If variability in soil depth is at very short distances, the crop roots may also access water laterally. Observations like these may prompt adjustments to the estimated profile PAWC.
What about the variable soil depth?
The variable soil depths and PAWC contribute to variable yield (Lynch and Dougall, 2007). The effect of soil depth will depend on the season and the extent the crop is relying on stored soil water versus benefitting from in-season rainfall. In addition, access of water beyond the measured soil depth or on account of within paddock water flows (e.g. runoff) can also moderate the effect. However, recurring yield patterns can often be seen, especially in wheat and sorghum (Figure 5). In the absence of other subsoil constraints, these patterns will likely relate to soil depth.
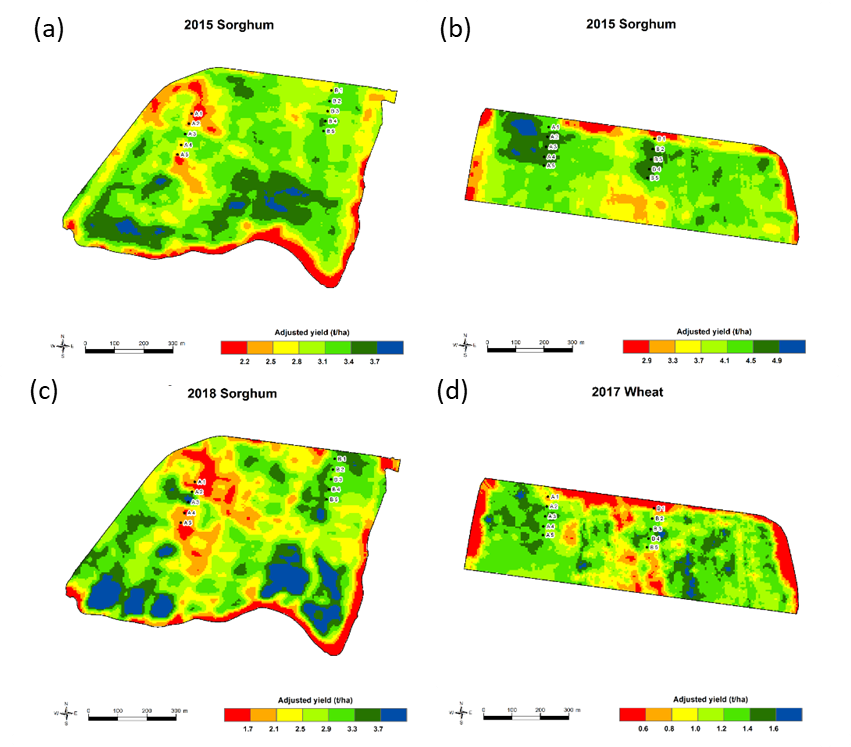 Figure 5. Yield maps from National Paddock Survey project for two paddocks (a,c and b,d) in the Capella Qld region. (Note that yield scales differ between the four maps.)
As part of the Central Highlands case study we are evaluating whether we can use a new, national digital soil depth map (Malone and Searle, 2020) as part of Step 5. The map is based on digital soil mapping, drawing on thousands of soil depth measurements across Australia and using supporting information (covariates) of clay mineralogy, climate indices, vegetation indices, terrain indices and parent material to predict soil depth at 90 m grid scale.
The data collected by Lynch and Dougall (2007) provided an opportunity to test the predictions at paddock scale (Figure 6). The 90 m resolution soil depth predictions from the national model are shown in (Figure 6b), along with the digital elevation model predictions in (Figure 6a). The individual soil depth points from Lynch and Dougall (2007) are shown (Figure 6c) and have been interpolated to produce a map at 30 m resolution (Figure 6d) for comparison with the predictions. The predicted map correctly identifies the shallower soils in the middle of the paddock. It also predicts the deeper soils at the bottom of the paddock (eastern end). It does, however, not capture the deepest soils at the top end of the paddock (south-western corner).
For a national scale soil depth model, the broad correspondence between the predicted map and the observed soil depths is encouraging. In relation to missing the deepest soils, it may be that the dataset the modelling drew on did not include data that reflects this combination of climate, landscape position, parent material and weathering process. It will be useful to test whether the presence of deeper soils in higher elevation positions occurs more widely within the Undulating Downs LRA. Another factor explaining mismatches between predictions and observations is the variability of weathering rates leading to different soil depths promoted by ancient cracks and fissures in the basalt. This variability means that it makes it (i) hard for the soil depth model to predict depth from few data points in an inherently variable bedrock and (ii) impossible to represent the full variability over a 90 m prediction grid cell, the grid cell representing instead an ‘average’ depth prediction. Finer resolution (i.e. <90 m) digital soil mapping based on more local data would likely represent the natural depth variability better across the whole paddock.
For use in Step 5 the results indicate that the new soil depth map can provide guidance on broad patterns, but that local verification is warranted. The yield map for the 2006 sorghum crop (Figure 6e) shows broad correspondence with the observed soil depths (Figure 6c and d), with lower yields in the shallow centre part of the paddock and the highest yields obtained on the deepest soil. Correspondence is not perfect as even the soil coring may not have picked up all of the spatial variability in depth. In addition, as mentioned above, roots may find deeper water and within paddock water flows and topography introduced by the contour bands also affect how much water is available to the crop in each location of the paddock.
As the yield map effectively integrates the amount of water available to the crop, study of yield patterns on maps from across multiple seasons is likely to contain valuable information. Indeed, current research is exploring whether inverse modelling can ‘back-calculate’ the PAWC (Wang et al. 2019).
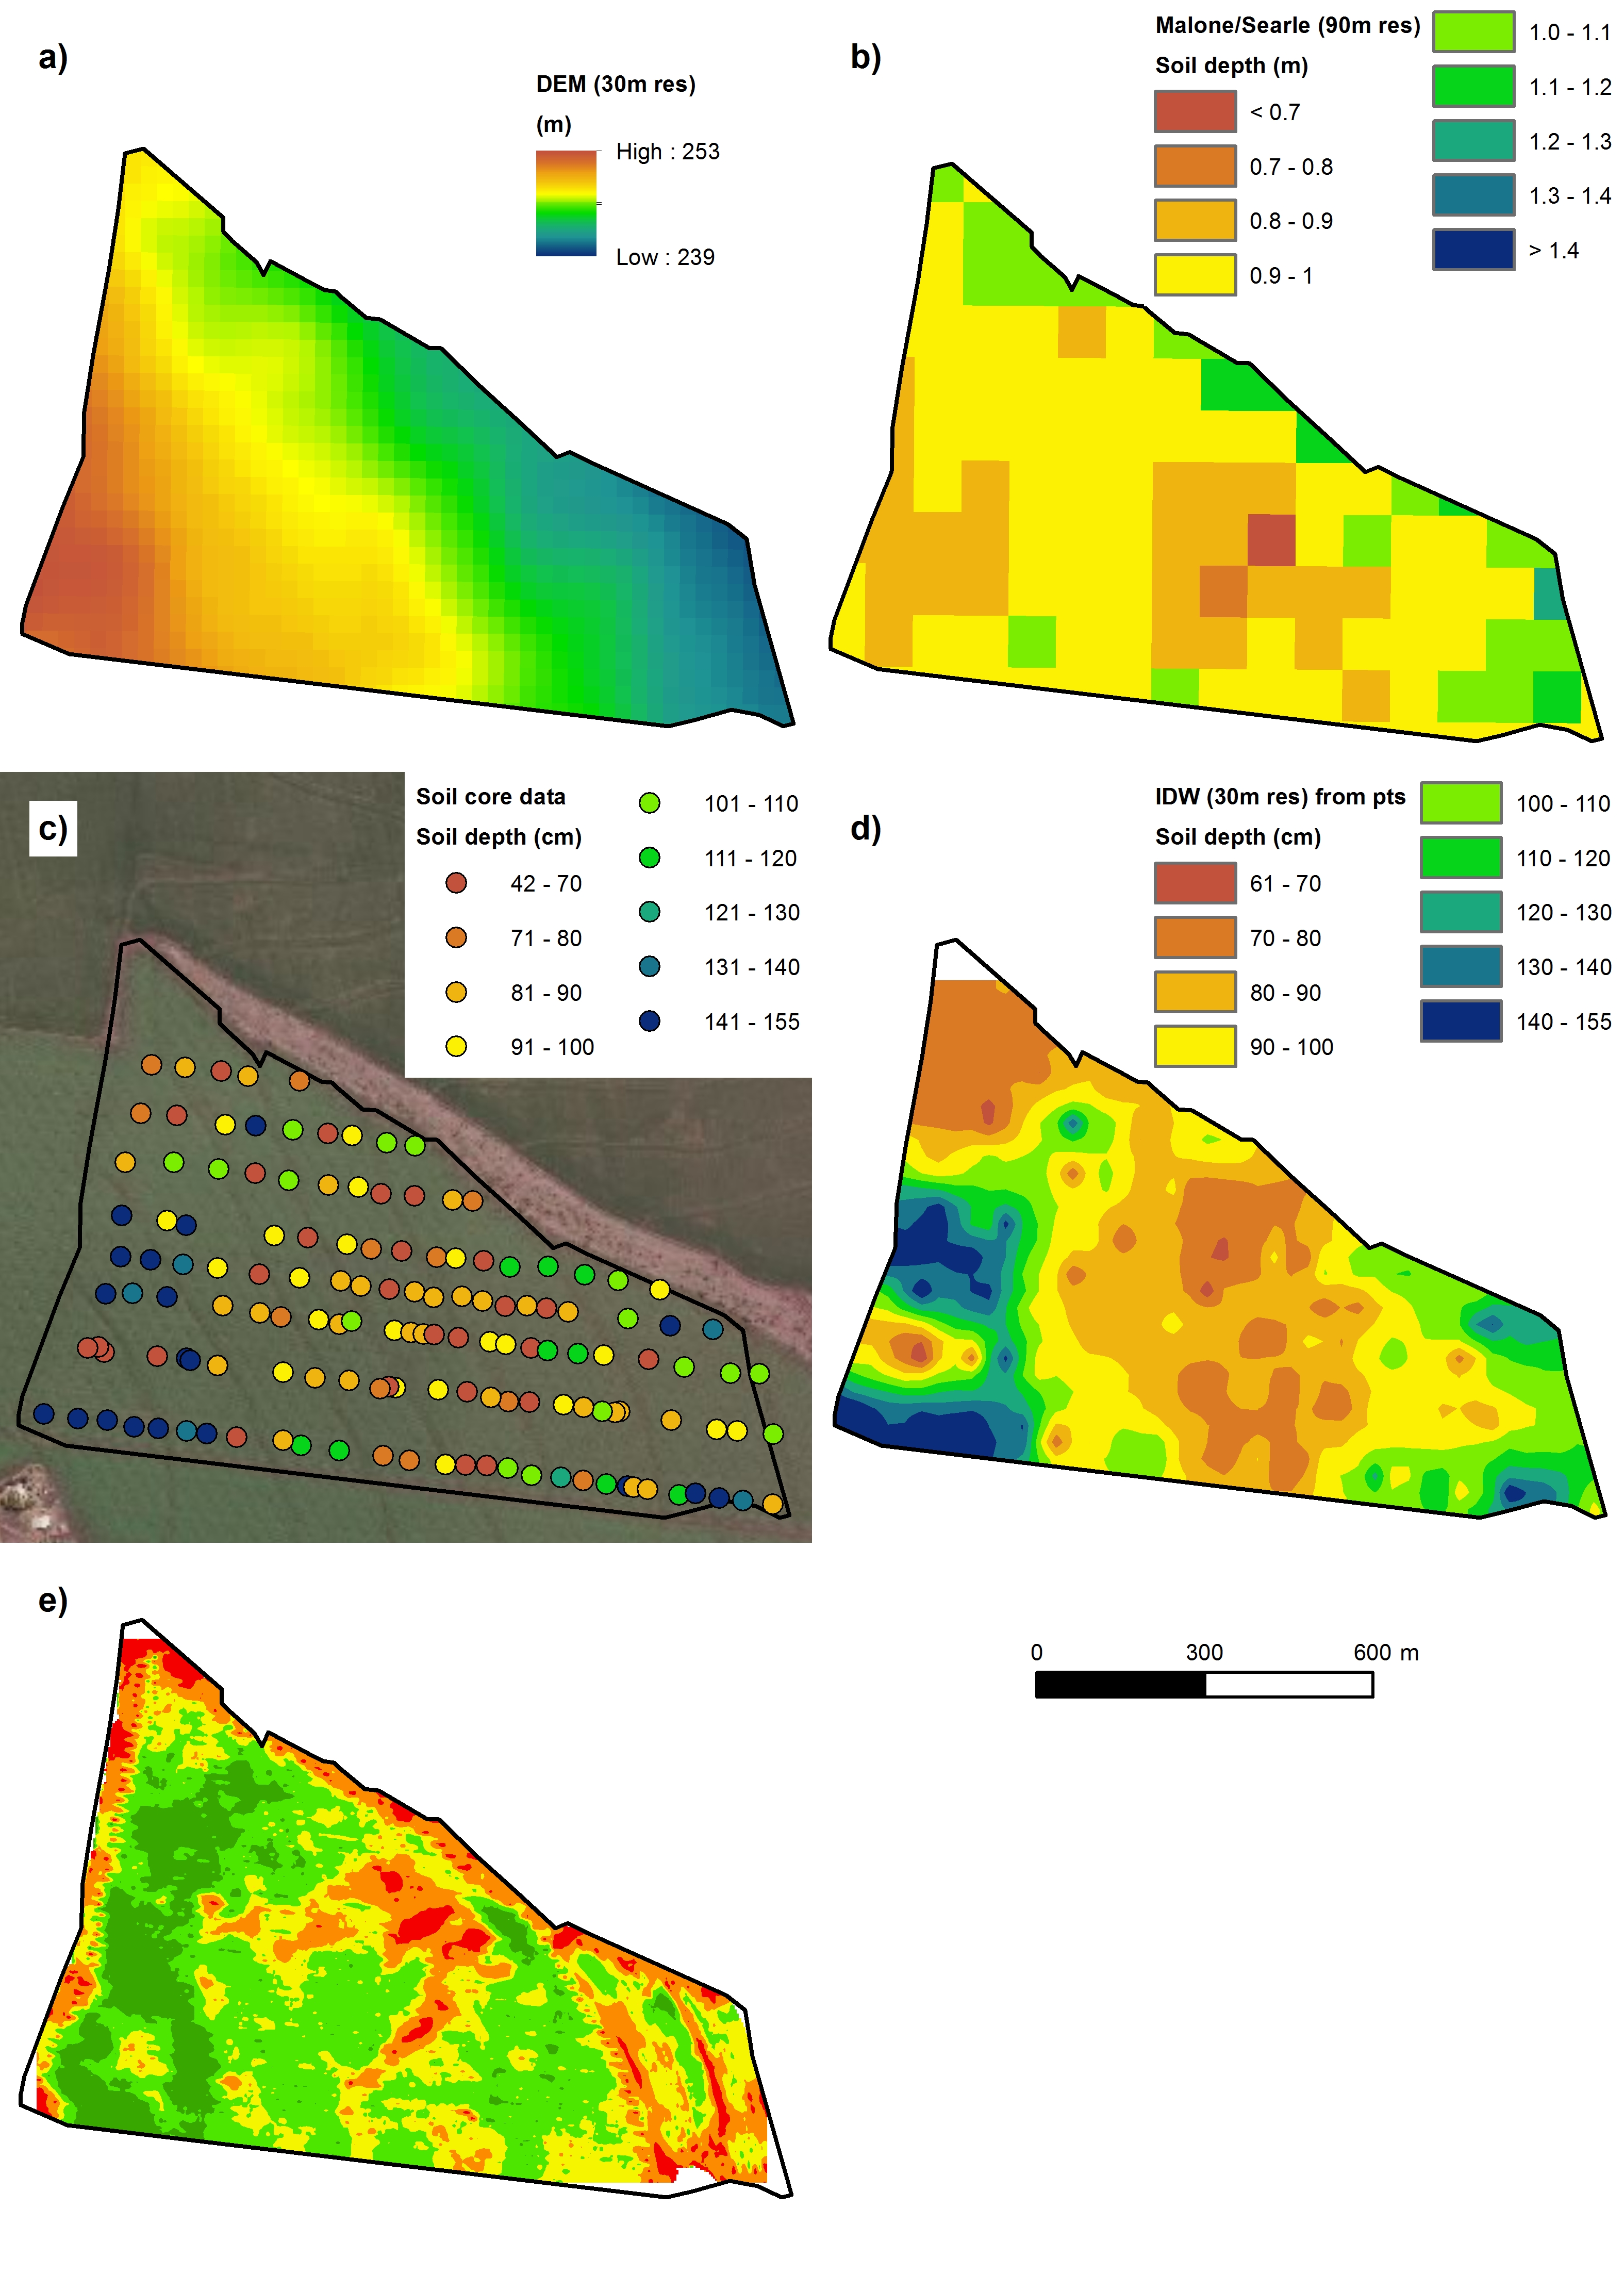 Figure 6. (a) Digital elevation model, (b) soil depth predicted by the national soil depth model of Malone and Searle (2020), (c) observed soil depths (data from Lynch and Dougall, 2007), (d) interpolated soil depth data and (e) yield map for the 2006 sorghum crop (data from Lynch and Dougall, 2007)
Reflection
The information contained in the LRA mapping and associated Field Manual and Resource Information can be combined with the APSoil database, the digital soil mapping of the Soil and Landscape Grid of Australia and the new soil depth layer to estimate PAWC. More broadly, the combination of resources improves our understanding of the properties of different soils and how these relate to position in the landscape and parent material.
The example presented here is one of the more straightforward analyses and we are in the process of applying the same methods in more complex parts of the landscape. However, it does relate to much of the Undulating Downs cracking clay soils.
Combining the different resources is currently a process that takes time – both in terms of process (e.g. access is through different platforms) and in grasping the full depth of knowledge contained in the reports. We are exploring ways to make this simpler and welcome feedback from people who try to access some of the resources and the steps suggested in this paper.
Acknowledgements
The research undertaken as part of this project is made possible by the significant contributions of growers through cooperation with our PAWC and soil characterisations, their generous time discussing their soils and their support of the GRDC; the authors would like to thank them for their continued support. We also gratefully acknowledge the contributions of CSIRO colleagues and other collaborators involved with the field PAWC characterisations captured in the APSoil database. The information on PAWC presented in this paper heavily draws on the work over many years by Neal Dalgliesh (CSIRO). Discussions with him and others, including with those involved with soil-landscape mapping (Neil McKenzie, Rob Banks, Brian Murphy, Neroli Brennan, Andrew Biggs and Mark Silburn) helped refine our concepts around the use of soil-landscape mapping for PAWC estimation. We thank David Gobbett and Brendan Malone for discussions and for access to yield maps in Figure 5 and the new soil depth DSM layer, respectively. We thank local agronomists and growers, Darren Aisthorpe, Josh Bell, Andrew Bates, David Storey and Tim Gersbach for insights into local soil properties and management as well as for access to yield data for select paddocks from the National Paddock Survey project (led by Harm van Rees, Graham Spackman and growers).
Resources
APSoil database (includes link to Google Earth file as well as to various papers and reports)
SoilMapp (soil maps, soil characterisation, archive and APSoil sites): Apple iPad and Android app; documentation. (Note iPad version currently down)
Queensland Globe (LRA maps and more)
(Select ‘Add Layers’, then choose ‘Land resource area mapping’ and/or ‘Soil mapping and sites’ under ‘Geoscientific information’ and zoom into the area of interest)
eSPADE v2.0 (soil-landscape and land systems mapping and reports, reports on soil characterisation sites and DSM predictions)
(Select ‘Soil landscapes’ or ‘Soil and land resources’, ‘Soil Profiles’, or ‘Modelled soil properties’ from menu on right and zoom into the area of interest after selecting ‘Hybrid’ as Base map)
Queensland Land resources assessment manuals
Soil and Landscape Grid of Australia
References
Bourne GF, Tuck GA (1993a) Field Manual. In: R.N. Thwaites and J.M. Maher (eds.) Understanding and Managing Soils in the Central Highlands, Department of Primary Industries, Brisbane.
Bourne GF, Tuck GA (1993b) Resource Information. In: R.N. Thwaites and J.M. Maher (eds.) Understanding and Managing Soils in the Central Highlands, Department of Primary Industries, Brisbane.
Burk L, Dalgliesh N (2013) Estimating plant available water capacity.
Cocks B, Stockmann U, Deery D, Austin J, Glover M, Thomas M, Gallant J, Schwenke G, Manning W, Verburg K (2020) Using plant available water (PAW) to inform decision-making and crop resourcing: What to do when you do not have a PAWC characterisation on-site. Mullaley 2020 GRDC Update paper.
Dang YP, Dalal R, Mayer DG, McDonald M, Routley R, Schwenke GD, Buck SR, Daniells IG, Singh DK, Manning W and Ferguson N (2008). High subsoil chloride concentrations reduce soil water extraction and crop yield on Vertosols in north-eastern Australia. Australian Journal Agricultural Research 59, 321–330.
Hochman Z, Dang YP, Schwenke GD, Dalgliesh NP, Routley R, McDonald M, Daniells IG, Manning W, Poulton PL (2007) Simulating the effects of saline and sodic subsoils on wheat crops growing on Vertosols. Australian Journal of Agricultural Research 58, 802–810.
Lynch BC and Dougall CP (2007) Yield maps - more than just pretty pictures? Does soil depth explain spatial variability of yield on a Central Queensland Black Vertisol? 5th Australian Controlled Traffic and Precision Agriculture Conference. 16-18 July 2007, Perth, Western Australia.
Malone B, Searle R (2020) Improvements to the Australian national soil thickness map using an integrated data mining approach. Geoderma 377 (2020) 114579.
Rodriguez D, deVoil P, Power B, Cox H, Crimp S, Meinke H (2011) The intrinsic plasticity of farm businesses and their resilience to change. An Australian example. Field Crops Research 124, 157–170.
Stockmann, U, Austin, J, Gallant, J, Cocks, B, Glover, M, Thomas, M, Verburg, K (2020a) Macquarie-Bogan floodplain Plant Available Water Capacity prediction case study. CSIRO, Australia.
Stockmann U, Austin J, Glover M, Gallant J, Cocks B, Thomas M, Verburg K (2020) Moree Plains Plant Available Water Capacity Prediction Case Study. CSIRO, Australia.
Thomas M, Cocks B, Stockmann U, Glover M, Austin J, Gallant J and Verburg K (2019). Measuring and predicting plant available water capacity (PAWC) to drive decision-making and crop resourcing: extrapolating data in the Central Darling Downs from limited site numbers across paddocks helped by soil-landscape understanding. Dalby 2019 GRDC Update paper.
Thomas, M., Stockmann, U, Glover, M., Cocks, B., Austin, J., Gallant, J. and Verburg, K. (2020), Central Highlands (Queensland) PAWC prediction case study. CSIRO, Australia.
Thwaites, R.N. and Maher, J.M. (eds.) 1993, Understanding and Managing Soils in the Central Highlands, Department of Primary Industries Training Series QE93002,Brisbane.
Verburg K, Cocks B, Manning B, Truman G, Schwenke GD (2017). APSoil plant available water capacity (PAWC) characterisation of select Liverpool Plain soils and their landscape context, CSIRO, Canberra.
Verburg K, Cocks B, Stockmann U, Thomas M, Austin J, Glover M, Gallant J (2020). Using plant available water (PAW) to inform decision-making and crop resourcing: What to do when you do not have a PAWC characterisation on-site? Goondiwindi 2020 GRDC Update paper.
Wang E, He D, Luo Z (2019) Predicting soil water holding capacity from climate and crop yield. Proceedings of the 2019 Agronomy Australia Conference, 25 – 29 August 2019, Wagga Wagga, Australia.
Whish J (2014). Sorghum yield risk vs starting soil moisture. GRDC Update paper.
Contact details
Kirsten Verburg
CSIRO Agriculture and Food
GPO Box 1700, Canberra ACT 2601
Ph: (02) 6246 5954
Email: kirsten.verburg@csiro.au
Brett Cocks
CSIRO Agriculture and Food
203 Tor St, Toowoomba QLD 4350
Ph: (07) 4571 3280 / 0427 583 7564
Email: brett.cocks@csiro.au
® Registered trademark
GRDC Project Code: CSP1706-013RTX,
