Using plant available water (PAW) to inform decision-making and crop resourcing: What to do when you do not have a PAWC characterisation on-site?
Take home messages
- Plant available water (PAW) is a key determinant of potential yield in dryland agriculture. Obtaining a measurement or estimate of PAW can, therefore, inform crop management decisions relating to time of sowing, crop type or the level of fertiliser inputs
- Estimating PAW, whether through soil coring, use of a soil water monitoring device or a push probe, requires knowledge of the plant available water capacity (PAWC) of a soil. PAWC characterisations are publicly available in the APSoil database, which can be viewed in Google Earth and in the ‘SoilMapp’ application for iPad and Android
- Variation in the observed PAWC is linked to parent material, texture and subsoil constraints. Similarity in soil properties is therefore key, when extrapolating PAWC data
- Recognising how soils are distributed across the landscape, helped by understanding how the soils have been formed, assists with assessing similarity in soil properties. The nearest characterisation is not necessarily the most appropriate one
- Relationships between soil properties, parent material and position in the landscape are reflected in soil-landscape, soil and land resources and land resource area mapping and described in accompanying reports available online through eSPADE (NSW) and the Queensland Globe
- Digital soil maps (DSMs) provide predictions of soil properties at 90 or 100 m resolution and are available through eSPADE for NSW and the Soil and Land Grid (SLGA) for all of Australia
- Predicting PAWC currently requires combining the information from these multiple resources with local observations. Work is currently underway to test and refine the PAWC prediction processes and make them more user-friendly
- In the meantime, exploring the soil differences on your farm using these tools and the provided PAWC information may explain differences in performance between or within paddocks, and help adjust yield expectations and inform management decisions.
Plant available water and crop management decisions
A key determinant of potential yield in dryland agriculture is the amount of water available to the crop, either from rainfall or stored soil water. In the GRDC northern region the contribution of stored soil water to crop productivity for both winter and summer cropping has long been recognised. The amount of stored soil water influences decisions to plant or wait (for the next opportunity or long fallow), to sow earlier or later (and associated crop and variety choices) and the input level of resources such as nitrogen fertiliser. Examples have been presented by others at previous GRDC Updates (e.g. Routley, 2010; Whish, 2014; Dalgliesh, 2014; Fritsch and Wylie 2015; and Bell, 2019).
The amount of stored soil water available to a crop - Plant Available Water (PAW) – is affected by pre-season and in-season rainfall, infiltration, evaporation and transpiration. It also strongly depends on a soil’s Plant Available Water Capacity (PAWC), which is the total amount of water a soil can store and release to different crops. The PAWC, or ‘bucket size’, depends on the soil’s physical and chemical characteristics as well as the crop being grown.
The PAWC can be determined in the field following procedures described in the GRDC PAWC Booklet ‘Estimating plant available water capacity’ (Burk and Dalgliesh , 2013). This method will usually provide the best estimate for a location of interest, although there are some pitfalls and common mis-characterisation issues that need to be avoided (Verburg et al., 2017). See below for more details.
Over the past 20 years, CSIRO in collaboration with state agencies, catchment management organisations, consultants and farmers has characterised more than 1100 sites around Australia for PAWC. The data are publicly available in the APSoil database, including via a Google Earth file and in the ‘SoilMapp’ application for iPad and Android (see Resources section).
But what to do when you are not in the position to do a local field PAWC characterisation and there is no APSoil PAWC characterisation on-site?
The APSoil database provides geo-referenced data (i.e. data linked with locations on a map). The nearest APSoil PAWC characterisation may, however, not be the most appropriate as its soil properties could be quite different. The presence or level of subsoil constraints may vary too. The challenge is, therefore, to find a PAWC characterisation for a soil with similar properties.
The soil properties that affect PAWC (texture, stones and gravel, chemical constraints) change within the landscape as a function of parent material and how the soil formed, or soil material got there. These aspects are reflected in soil-landscape models that underpin soil survey maps produced by state government departments and other research organisations. This information is increasingly becoming available online. Our project tests the hypothesis that soil-landscape information can inform PAWC prediction.
This paper describes the concepts behind PAWC and outlines where to find existing information on PAWC. It discusses findings from research in progress on how you can use the available PAWC characterisation data, along with soil-landscape information and local observations to inform estimation of PAWC on your farm. This is illustrated by examples from the GRDC Northern Region.
Plant Available Water Capacity (PAWC)
To characterise a soil’s PAWC, or ‘soil water bucket size’, we need to determine (Figure 1a):
- Drained upper limit (DUL) or field capacity – the amount of water a soil can hold against gravity
- Crop lower limit (CLL) – the amount of water remaining after a particular crop (wheat, chickpea, cotton, etc.) has extracted all the water available to it from the soil
- Bulk density (BD) – the density of the soil, which is required to convert measurements of gravimetric water content to volumetric.
In addition, chemical data are obtained to provide an indication whether subsoil constraints (e.g. salinity, sodicity, boron and aluminium) may have affected a soil’s ability to store water, or the plant’s ability to extract water from the soil (e.g. rooting depth).
Plant available water is the difference between the CLL and the current volumetric soil water content (mm water/mm of soil) (Figure 1b). The latter can be assessed by soil coring (gravimetric moisture which is converted into a volumetric water content using the bulk density of the soil) or the use of soil water monitoring devices (requiring calibration to quantitatively report soil water content).
An approximate estimate of PAW can be obtained from knowledge of the PAWC (mm of available water/cm of soil depth down the profile) and the depth of wet soil (push probe or based on a feel of wet and dry limits using an uncalibrated soil water monitoring device).
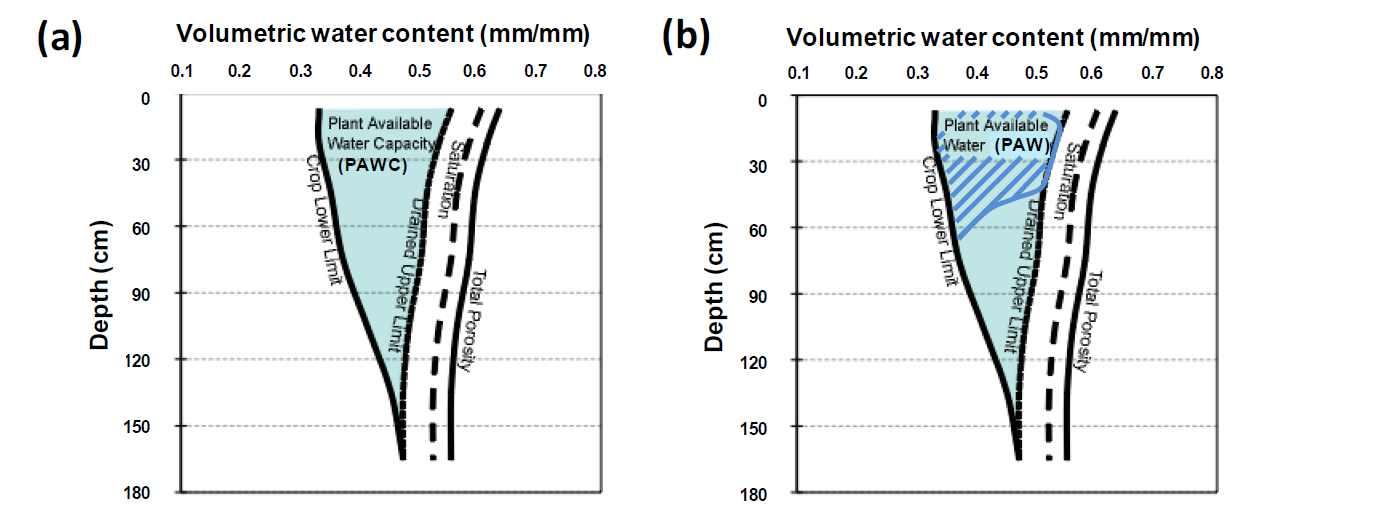 Figure 1. (a) The Plant Available Water Capacity (PAWC) is the total amount of water that each soil type can store and release to different crops and is defined by its Drained Upper Limit (DUL) and its crop specific Crop Lower Limit (CLL); (b) Plant Available Water (PAW) represents the volume of water stored within the soil available to the plant at a point in time. It is defined by the difference between the current volumetric soil water content and the CLL.
Field measurement of PAWC
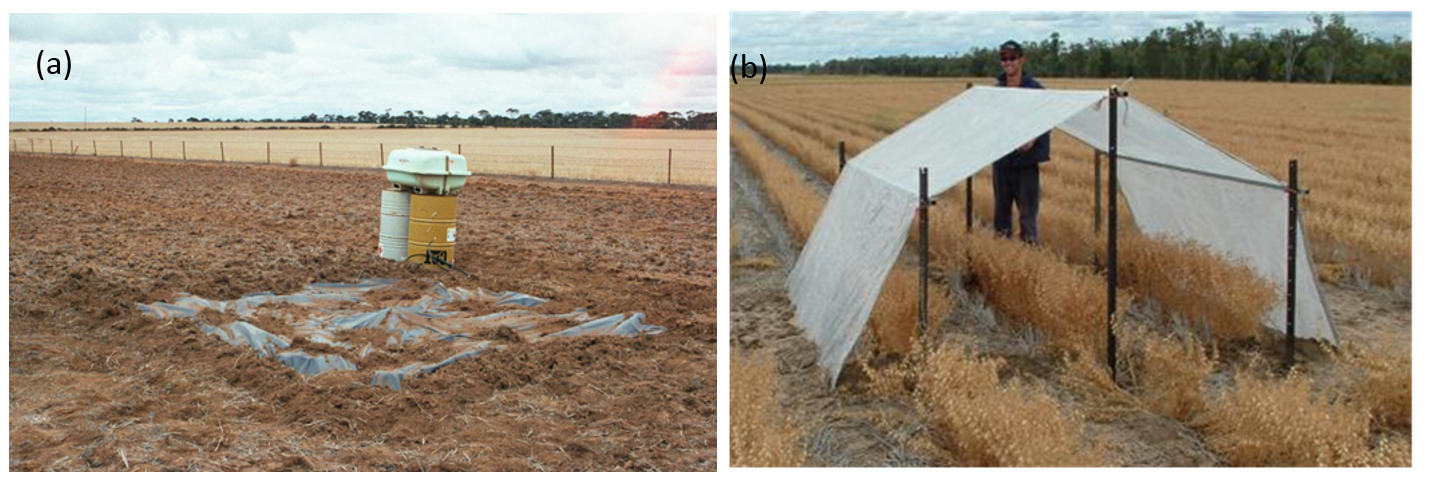
Field measurement of DUL, CLL and BD are described in detail in the GRDC PAWC booklet ‘Estimating plant available water capacity’ (Burk and Dalgliesh, 2013; see resources section). Briefly, to determine the DUL an area of approximately 4 m x 4 m is slowly wet up using drip tubing that has been laid out in spiral (see Figure 2a). The area is covered with plastic to prevent evaporation and after the slow wetting up it is allowed to drain (see GRDC PAWC booklet for indicative rates of wetting up and drainage times). The soil is then sampled for soil moisture and bulk density.
The CLL is measured either opportunistically at the end of a very dry season or in an area protected by a rainout shelter between anthesis/flowering and time of sampling at harvest (Figure 2b). This method assumes the crop will have explored all available soil water to the maximum extent and it accounts for any subsoil constraints that affect the plant’s ability to extract water from the soil.
Pitfalls and common mischaracterization issues have been documented in a report describing APSoil PAWC characterisations in the Liverpool Plains (Verburg et al., 2017; see Resources Section). Key issues affecting the DUL measurement include too little water application or application at rates that cause surface or subsurface runoff and insufficient time for drainage (particularly on clay soils). Those affecting CLL include large rainfall events refilling soil under the rainout shelter via cracks or subsurface flow (especially on slopes) and insufficient wetting of the deep subsoil. The latter issue has been an issue in recent dry years and causes the measured CLL to reflect the water extraction of previous deep-rooted crops.
Where to find existing information on PAWC
Characterisations of PAWC for more than 1100 soils across Australia have been collated in the APSoil database and are freely available to farmers, advisors and researchers. The database software and data can be downloaded from the APSIM website. The characterisations can also be accessed via Google Earth (KML file from APSoil website) and in SoilMapp, an application for the iPad and Android. The yield forecasting tool Yield Prophet® also draws on this database.
In Google Earth the APSoil characterisation sites are marked by a shovel symbol (see Figure 3a), with information about the PAWC profile appearing in a pop-up box if one clicks on the site. The pop-up box also provides links to download the data in APSoil database or spreadsheet format.
In SoilMapp the APSoil sites are represented by green dots (see Figure 3b). Tapping on the map results in a pop-up that allows one to ‘discover’ nearby APSoil sites (tap green arrow) or other soil (survey) characterisations. The discovery screen then shows the PAWC characterisation as well as any other soil physical or chemical analysis data and available descriptive information.
Most of the PAWC data included in the APSoil database has been obtained through the field methodology outlined above, although for some soils, estimates have been used for DUL or CLL. Some generic, estimated profiles are also available. While field measured profiles are mostly geo-referenced to the site of measurement (+/- accuracy of GPS unit), generic soils are identified with the nearest, or regional town.
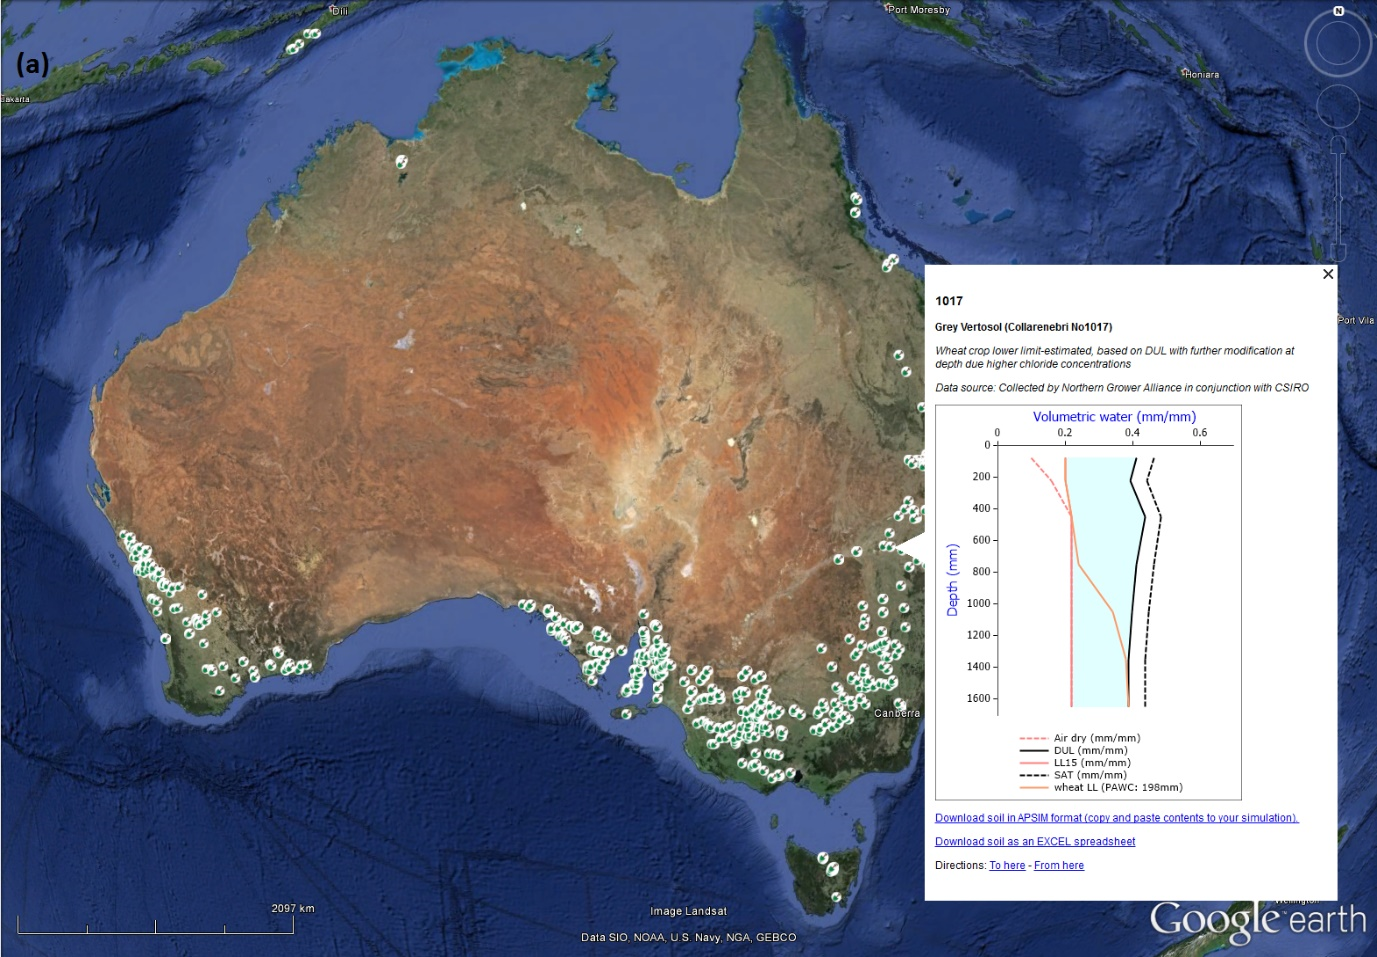
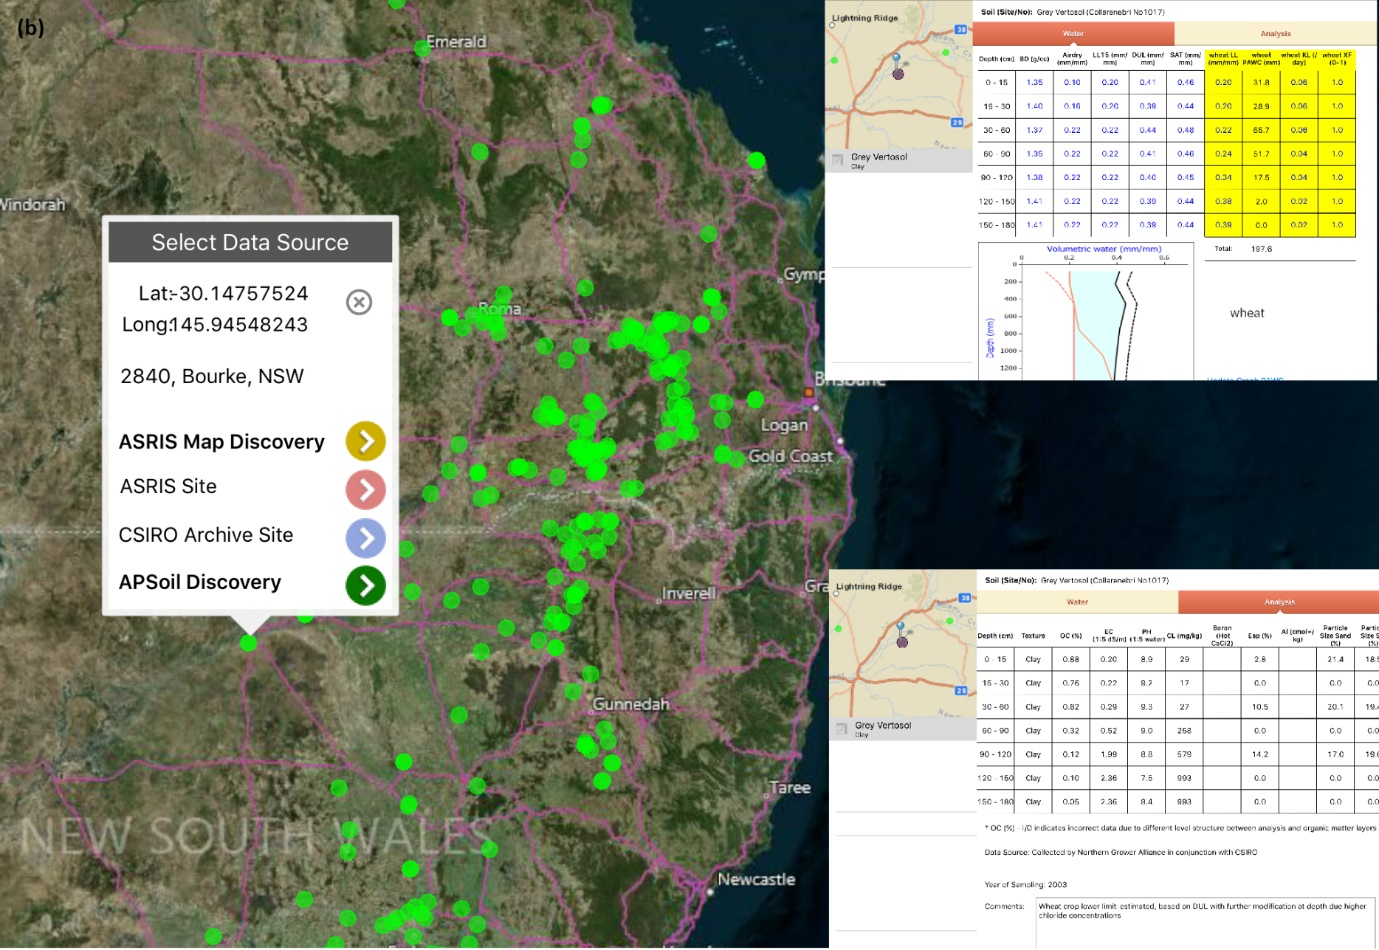 Figure 3. Access to geo-referenced soil PAWC characterisations of the APSoil database via (top) Google Earth and (bottom) SoilMapp (APSoil discovery screens as inserts).
Using soil-landscape information to help estimate PAWC
The concept of using soil-landscape information to help estimate PAWC is based on previous work providing soil management advice specific to soil-landscape positions as used in the ‘Glovebox Guide to Soil of the Macquarie-Bogan Flood Plain’ by Hulme (2003), land management manuals available for several regions in Queensland (e.g. Harris et al. (1999) for the Central Darling Downs) and the on-line mapping and reports for soil-landscapes and soil and land resources in various regions of NSW.
These resources have in common that they draw on a mapping of so-called soil landscape units (SLUs) or land resource areas (LRAs) which identify “broad landscape units that group soils developed from related geology and exhibit recurring patterns of topography and vegetation” (Harris et al., 1999). The maps were produced as part of soil survey programs undertaken by the states and are now available on-line. The Queensland maps can be accessed via the Queensland Globe, whereas the NSW maps are available through the eSPADE tool (see resources section).
As the maps are typically at a 1:100,000 or 1:250,000 mapping scale the map units often include more than one soil and usually do not reflect uniform soil properties or PAWC. Further differentiation within the units is required. The accompanying reports provide guidance on typical sequences of soils and their landscape position or indicate the distinguishing features of different soils. However, local observations on the landscape around the point of interest and specific soil features are still required for PAWC prediction at paddock scale.
Digital soil mapping (DSM) predicts soil properties on a grid using spatial statistical models that describe how site soil data relate to other environmental information layers, called co-variates. These include soil and parent material indicators (e.g. information from gamma radiometrics), climate variables (e.g. rainfall, potential evaporation), existing soil maps and information on vegetation (e.g. land cover, NDVI) and terrain and landscape position (e.g. elevation, slope, orientation of slope). The Soil and Landscape Grid of Australia (SLGA) provides predictions at 90 m resolution and in NSW the eSPADE provides mapping at a 100 m grid (see resources section).
Below we illustrate the use of these resources for two examples from north-western NSW. Previous Update papers provided information on the Liverpool Plains (Verburg et al., 2018) and Central Darling Downs (Thomas et al., 2019).
Macquarie-Bogan floodplain
Detailed SLU mapping has been carried out in this region, but this is not yet available on-line in eSPADE. The Glovebox Guide by Hulme (2003) presents a simplified version of this mapping. The mapping distinguishes four main floodplain formations: Trangie, Carrabear, Bugwah, and Marra Creek (Duncan et al., 2012). These represent different geological times during which the alluvial materials were deposited (~ 1.6 million years to < 5,000 years). As position and stream power of the river system changed over time, the materials were deposited under different energy conditions, affecting their particle size distribution. The particle size distribution is also affected by the relative position within the river systems: high-energy bed-load results in coarser and more variable materials in the meander plains, whereas low energy deposition of clays characterises the backplains (Figure 4). The SLU mapping, therefore, also distinguishes backplain units and meander plain units.
APSoil PAWC characterisations in the area reflect these differences in texture (Table 1). Those representing backplains also show some consistency in PAWC, resulting in a rule-of-thumb that could be used as a first approximation: PAWC of 200-220 mm, unless affected by subsoil salinity which can reduce PAWC by 50 mm or more. Due to their nature, the meander plains are more variable and current work is exploring the use of DSM based predictions and terrain analysis to guide variation within these units. The DSM of electrical conductivity (EC) available in eSPADE also looks promising to identify areas where the presence of salinity limiting the PAWC needs to be considered.
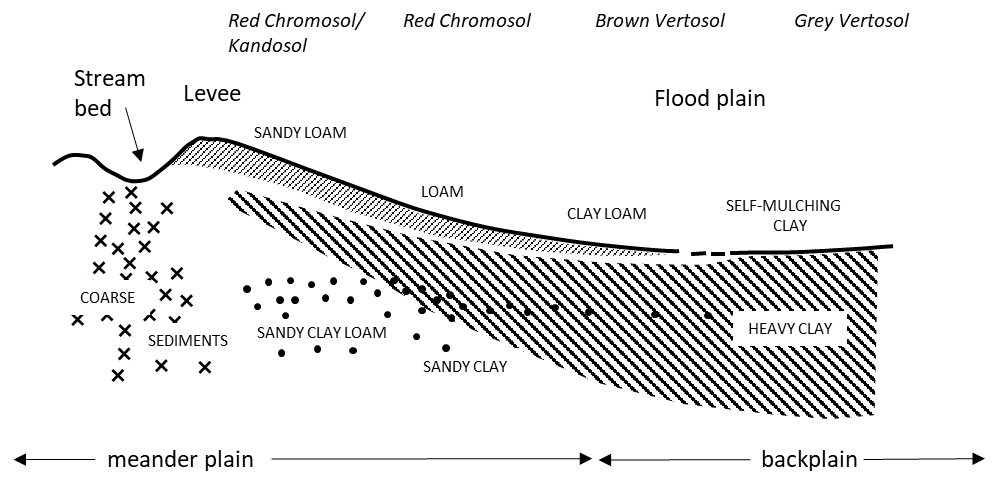 Figure 4. Distribution of materials across the meander plain and backplain; adapted from Butler (1958) with the soil type sequence of one of our transects through the Carrabear Western soil landscape group.
Table 1. Select APSoil characterisations in Macquarie-Bogan Floodplain region with PAWC (to 180 cm or rooting depth).
APSoil | Soil-landscape group and unit | PAWC | Soil | Soil Constraints to PAWC | |
|---|---|---|---|---|---|
683 | Trangie | meander plain | 141 | Duplex | |
684 | Trangie | backplain | 193 | Vertosol | |
1161 | Carrabear Western | backplain | 210 | Vertosol | |
1156 | Carrabear Eastern | backplain | 153 | Vertosol | Constrained by salinity |
248 | Carrabear Macquarie | meander plain | 148 | Duplex | |
705 | Carrabear Macquarie | backplain | 184 | Vertosol | |
1160 | Carrabear Merri | backplain | 127 | Vertosol | Constrained by salinity |
1159 | Carrabear Combara | meander plain | 215 | Gradational | |
1158 | Carrabear Combara | backplain | 213 | Vertosol | |
Moree Plains
This area has soil and land resources mapping available through eSPADE which covers the alluvial plains and fans of the Namoi, Mehi, Gwydir, Barwon and Macintyre Rivers (NSW OEH, 2016). Our project focussed on the area north of Moree. Most of the agricultural land in this area is mapped as SLUs associated with the floodplains of the different rivers, an SLU representing the gently undulating sandstone hills and rises on the western margin of bedrock-based ranges along the eastern border (e.g. around North Star) or the SLU representing the older alluvial plains and colluvial fans downstream (west) of these bedrock hills (the landscape crossing the Newell Highway) (Figure 5). Clay-rich Vertosols are the dominant soils on the alluvial plains and fans in most of the SLUs. The exceptions are the lighter red duplex (texture contrast) soils in the area around North Star and the mosaics of soils with varying particle size occurring in smaller SLUs representing current or remnant meander plains and levees, not all of which are cropped.
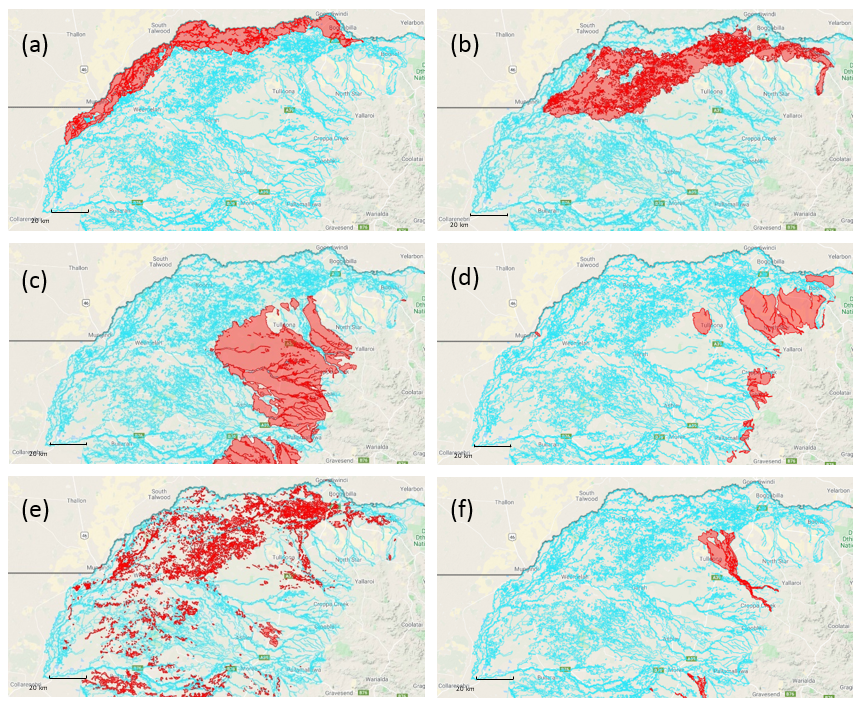
a) Mungindi (backplains and minor meander plains of the Barwon and Macintyre alluvial system),
b) Turrawah (floodplains and residual plains of the MacIntyre River fan system),
c) Gurley (remnant sheet-flood fan system), d) Mungle (undulating rises to hills mainly on sandstone), e) Boolcarrol (meander plains and levees), and f) Terry Hie Hie (palaeo-levee remnants on fan systems). See eSPADE for more.
APSoil characterisations are found in six of the SLUs (Table 2). It is difficult to generalise the nature of soils within the SLUs from these limited data points. For example, the three characterisations in the Turrawah SLU are Black Vertosols whereas the most common soil in this SLU is Grey Vertosol. Nevertheless, the data suggest that Vertosols on the floodplains, plains and fans will have PAWCs in the range of 200 mm (light clay) to 250 mm (heavy clay, clay > 50%) where there are no subsoil limitations. Subsoil salinity constraints can reduce this considerably with the depth of salinity being an important factor. The DSM of EC in eSPADE suggests that salinity subsoil constraint issues are common within most of the alluvial plains and colluvial fan SLUs. Subsoil salinity is usually experienced in soils that are less well drained, e.g. towards the bottom of the slope or in depressions. In flat landscapes like the Moree plains, the local topography plays a role and identification of subsoil salinity may require local assessment.
Due to the lighter texture of the surface soil, the texture contrast soils (e.g. Red Chromosols in Mungle SLU) tend to have lower PAWC (~150 mm, although dependent on texture). The Mungle SLU also has Red Ferrosols, Red and Brown Dermosols (previously called Red-brown Earths), which may have larger PAWC. Non-mapped areas within Mungle SLU representing, for example, drainage lines and depressions, may feature Vertosols and have a larger PAWC, subject to any subsoil constraints.
Table 2. APSoil characterisations in northern Moree Plains region with PAWC (to 180 cm or rooting depth).
APSoil | Soil landscape Unit (SLU) | PAWC (mm) | Soil | Soil constraints to PAWC |
|---|---|---|---|---|
1279 | Mungindi | 204W | Grey Vertosol | Constrained, salinity below 60 cm |
1278 | Hadleigh Park Road | 195W | Grey Vertosol | Unconstrained |
1277 | Turrawah | 224W | Black Vertosol | Unconstrained |
1287 | Turrawah | 227W | Black Vertosol | Unconstrained |
1288 | Turrawah | 182W | Black Vertosol | Unconstrained |
55 | Gurley | 140F | Brown Vertosol | No data, PAWC for fababean which usually extracts less water |
59 | Gurley | 132C | Grey Vertosol | No data, but PAWC profile suggests constraints below 60 cm |
101 | Gurley | 266W | Grey Vertosol | No data, but PAWC profile suggests unconstrained |
102 | Gurley | 203C-239W | Grey Vertosol | No data, but PAWC profiles suggests unconstrained |
233 | Gurley | 188C | Black Vertosol | Constrained, salinity below 60 cm |
234 | Gurley | 114C-117W | Black Vertosol | Constrained, salinity below 30 cm |
235 | Gurley | 196C-238W | Black Vertosol | Unconstrained |
238 | Gurley | 167C-194W | Grey Vertosol | Constrained, salinity below 90 cm |
239 | Gurley | 121C-154W | Grey Vertosol | Constrained, salinity below 60 cm |
870 | Gurley | 216 | Vertosol | Constrained, salinity below 90 cm |
1286 | Gurley | 191W | Black Vertosol | Constrained, salinity below 120 cm |
236 | Mungle | 153W-209C | Duplex Red Chromosol | Unconstrained |
237 | Mungle | 103C-139W | Black Vertosol | Constrained, salinity below 60 cm |
240 | Mungle | 147C | Duplex Red Chromosol | Unconstrained |
1285 | Mungle | 245W | Black Vertosol | Unconstrained |
68* | Terry Hie Hie | 191W | Grey Vertosol | No data, but PAWC profile suggests salinity below 90 cm |
865 | Terry Hie Hie | 221W | Vertosol | Constrained, salinity below 120 cm |
*APSoil 68 not georeferenced, W=wheat, C=chickpea, F=fababean.
A chloride concentration of 600 mg/kg was taken as threshold to indicate salinity constraints on the PAWC, but the effects gradually increase with chloride concentration (Dang et al., 2008) and there are some subtle differences between crops (e.g. as shown here for chickpeas versus wheat, see Whish et al., 2007) for more details on the experiments that collected these data.
Reflection
The accessibility of soil landscape information online provides an opportunity to predict PAWC (and other soil properties) where measured data are not available. The information helps explain observed differences and similarities between APSoil PAWC characterisations and the soil at the site of interest. This will provide a first approximation of the PAWC, which will need to be finetuned with local observations of soil, landscape and crop performance over time.
Mixing and matching the information from the available resources (APSoil database, soil and landscape mapping, DSMs) is currently a challenge, as is some of the soil science language in the reports. The soils are described and classified using the highly technical Australian Soil Classification (Isbell et al., 2016) or using local names that are hard to extrapolate elsewhere. The current project is not only testing and refining the PAWC prediction processes, but also looking at how to make them more user-friendly. In the meantime, our advice is to explore some of the available information and maybe seek out soil experts who understand how soils vary across the landscape. In some regions, there are soil and land resource officers in state agencies (usually with a training in pedology) who have the detailed knowledge that can help.
The accumulated knowledge on yield trends and paddock differences (e.g. from yield mapping, farm records) can also be used to understand the inherent qualities of the soils, including PAWC. Under water-limited growing conditions, paddocks or areas within them with subdued yields may indicate PAWC constraining factors. These observations can be used to target further investigations, including into the presence of soil salinity, texture changes or other factors like shallow soil depth.
Acknowledgements
The research undertaken as part of this project is made possible by the significant contributions of growers through cooperation with our PAWC and soil characterisations, their generous time discussing their soils and their support of the GRDC; the authors would like to thank them for their continued support. We also gratefully acknowledge the contributions of CSIRO colleagues and other collaborators involved with the field PAWC characterisations captured in the APSoil database. The information on PAWC presented in this paper heavily draws on the work over many years by Neal Dalgliesh (CSIRO). Discussions with him, Jeremy Whish, and others, including with those involved with soil-landscape mapping (Neil McKenzie, Rob Banks, Brian Murphy, Neroli Brennan, Andrew Biggs and Mark Silburn) helped develop the concepts and ideas presented in this paper. We thank Jeremy Whish and David Deery for their review comments on this paper.
Resources
APSoil database: (includes link to Google Earth file as well as to various papers and reports)
SoilMapp (soil maps, soil characterisation, archive and APSoil sites): Apple iPad and Android app; documentation
eSPADE v2.0 (soil-landscape and land systems mapping and reports, reports on soil characterisation sites and DSM predictions)
(Select ‘Soil landscapes’ or ‘Soil and land resources’, ‘Soil Profiles’, or ‘Modelled soil properties’ from menu on right and zoom into the area of interest after selecting ‘Hybrid’ as Base map)
Queensland Globe (LRA maps and more)
(Select ‘Add Layers’, then choose ‘Land resource area mapping’ under ‘Geoscientific information’ and zoom into the area of interest)
Queensland Land resources assessment manuals
Soil and Landscape Grid of Australia
References
Bell L, Klepper K, Mairs J, Lawrence J, Zull A (2019). Farming system impact on nitrogen and water use efficiency, soil-borne disease and profit. GRDC Update paper.
Burk and Dalgliesh (2013). Estimating plant available water capacity.
Butler BE (1958). Depositional systems of the Riverine Plain of south-eastern Australia in relation to soils. Australian soil publication No. 10. CSIRO, Australia
Dalgliesh N (2014). Practical processes for better soil water management. GRDC Update paper.
Dang YP, Dalal R, Mayer DG, McDonald M, Routley R, Schwenke GD, Buck SR, Daniells IG, Singh DK, Manning W and Ferguson N (2008). High subsoil chloride concentrations reduce soil water extraction and crop yield on Vertosols in north-eastern Australia. Australian Journal Agricultural Research 59, 321–330
Duncan D, Murphy B, Wooldridge A, Brennan N, Agar B, Welch A, Andersson K, Kellett J, Lawrie J, Kew G (2012). Soil Information Package for the Nyngan 1:250 000 Sheet. A comprehensive assessment of the limitations and capabilities of the soils on the lower floodplain of the Macquarie River in the Central West Catchment of NSW. Unpublished draft version 4.0 May 2012. Sustainable Soil Management
Fritsch S and Wylie P (2015). Managing the yield gap to achieve your yield potential on the western Downs. GRDC Update paper.
Harris PS, Biggs AJW, and Stone BJ (eds). (1999). Central Darling Downs Land Management Manual. Department of Natural Resources, Queensland. DNRQ990102
Hulme P (2003). Glove-box guide to the soils of the Macquarie – Bogan floodplain, Sustainable Soils Management, Warren
Isbell RF and National Committee on Soil and Terrain (2016). The Australian Soil Classification (2nd ed.). Melbourne: CSIRO Publishing
NSW OEH (2016). SLAM Soil Landscape Report for Moree Plains v 1.0. Reports for SLUs available through eSPADE
Routley R (2010). Water use efficiency – Optimizing farming systems performance and balancing fallow length and sowing decisions. GRDC Update paper.
Thomas M, Cocks B, Stockmann U, Glover M, Austin J, Gallant J and Verburg K (2019). Measuring and predicting plant available water capacity (PAWC) to drive decision-making and crop resourcing: extrapolating data in the Central Darling Downs from limited site numbers across paddocks helped by soil-landscape understanding. GRDC Update paper.
Verburg K, Cocks B, Manning B, Truman G, Schwenke GD (2017). APSoil plant available water capacity (PAWC) characterisation of select Liverpool Plain soils and their landscape context, CSIRO, Canberra. https://www.apsim.info/Products/APSoil.aspx
Verburg K, Stockmann U, Cocks B, Manning B, Austin J, Glover M, Thomas M, Gallant J (2018). Soil water – methods to predict plant available water capacity (PAWC) using soil-landscape associations. GRDC Update paper.
Whish JPM, Castor PA, Carberry PS, Peake AS (2007). On-farm assessment of constraints to chickpea (Cicer arietinum) production in marginal areas of northern Australia. Experimental Agriculture 43, 505–520
Whish J (2014). Sorghum yield risk vs starting soil moisture. GRDC Update paper. .
Contact details
Brett Cocks
CSIRO Agriculture and Food
203 Tor St, Toowoomba QLD 4350
Ph: 07 4571 3280 / 0427 583 7564
Email: brett.cocks@csiro.au
Kirsten Verburg
CSIRO Agriculture and Food
GPO Box 1700, Canberra ACT 2601
Ph: 02 6246 595
Email: kirsten.verburg@csiro.au
® Registered trademark
GRDC Project Code: CSP1706-013RTX,
Was this page helpful?
YOUR FEEDBACK
