Balancing risk and reward with high phosphorus and nitrogen input costs
Balancing risk and reward with high phosphorus and nitrogen input costs
Author: Jim Laycock (Incitec Pivot Fertilisers), Sean Mason (Agronomy Solutions), Rob Norton (University of Melbourne), Graeme Sandral (Grains Research Development Corporation) | Date: 15 Feb 2022
Take home message
- Results from two long term P and N sites indicate that targeting P and N balance (long term off-take in grain + losses/fixation) was more profitable using a range of input price scenarios than targeting the highest yields which were achieved with significantly greater fertiliser inputs
- Where soil Colwell P values are above the critical range (e.g., 50 or above), P inputs estimated at long-term P off-take rates (P off-take in grain) provides yield and profit optimisation with a very slow decline in soil Colwell P
- Even in very high Colwell P soils, starter P is necessary to obtain potential yield in a wheat canola rotation where late April through to mid-May sowings are applied
- Early sowing times (early April) with good soil moisture reduce the grain yield response from starter P in a range of soil Colwell P settings
- A sound paddock history of Colwell P and soil pre-sowing mineral N values is essential to inform optimisation of P and N profits
- N replacement rates below grain off-take levels results in lower yields and lower profits even where soil Colwell P levels and starter P rates were high
- Two long term P and N site indicate that about half of the crop N requirements were provided by soil mineralisation.
Introduction
It’s estimated that 3.54 billion people are supplied food that is only made possible with the addition of inorganic fertilisers (Erisman et al., 2008). It’s also clear that where nitrogen (N) or phosphorus (P) is deficient in soils and/or phosphorus is not applied in adequate amounts at sowing (starter P), crop yields are often much lower than the water limited potential yield. (e.g., Bell et al., 2013; Nkebiew et al., 2016; Sandral et al., 2018; 2019). This context is important whenever lower fertiliser inputs are considered, as the downside profit risk of lower inputs is significant.
Phosphorus
Annual P inputs are essential in all broadacre crops to maximise profits with the exception of broadleaf lupins (Lupinus albus). However, lowering P inputs can be considered where the soil P status is in excess to that of plant requirements. This may occur because (i) historic applications have been in excess of P exports and soil fixation or (ii) the particular crop species being grown has low soil critical P requirement. Other factors that are important considerations include the phosphorus buffering index (PBI) of the soil, the pH of the soil and the crop time of sowing. Fundamental to the potential to lowering P inputs is the fact that most crop P requirements are extracted from soil reserves and not from P applied at sowing. Even so, because of its low mobility in the soil, there is often a positive effect of having some P placed close to the seed at sowing (Nkebiwe et al., 2016; Figure 10).
The critical soil P value or critical P range is usually defined as the soil P that will provide 90 to 95% of crop water limited yield. The critical P range is mostly impacted by the crop type, sowing time, soil PBI, soil type and soil pH. Examples include, narrow leaf lupin (Lupinus angustifolius) which have a critical P range two thirds that of wheat (Anderson et al., 2015), April sowing times with adequate soil moisture that have at least half the starter P requirement compared with later May sowings of wheat (Batten et al., 1999, Mason and McDonald 2021), high PBI soils that bind more P in the soil resulting in a higher soil critical P requirement for Colwell P, and soil pH that impacts on P binding by changing the availability of Fe, Al, and Ca.
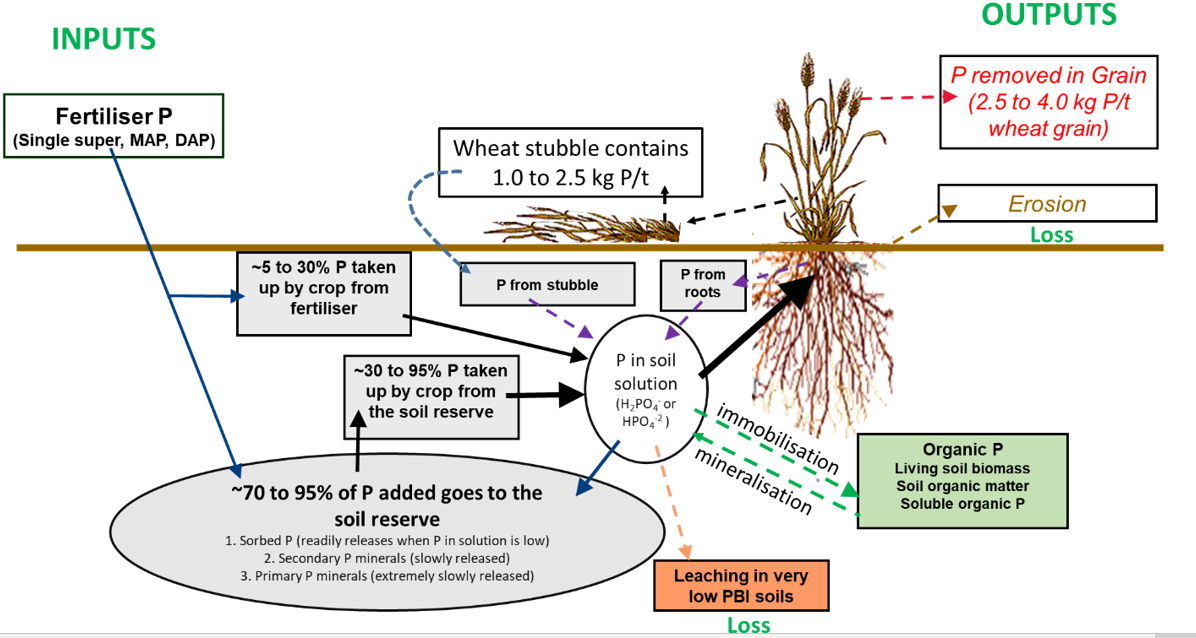
Phosphorus cycling: P fertiliser that is added to the soil in cropping systems primarily goes into the ‘soil reserve’ (Figure 2) where the P bind to soil in a process referred to as P sorption or fixation. Fixation occurs when P reacts with other minerals to form insoluble compounds and becomes unavailable to crops. An important factor controlling P fixation is soil pH and where soils are acid and have high Fe and/or Al, liming will provide additional plant available P (Figure 1). Studies that have compared the return on investment in P verses lime on acid soils (<4.8 CaCl2) have shown that returns are higher for lime when the time horizon is greater than 3 (Cho et al., 2020) to 5 years (Katitbie et al., 2002).
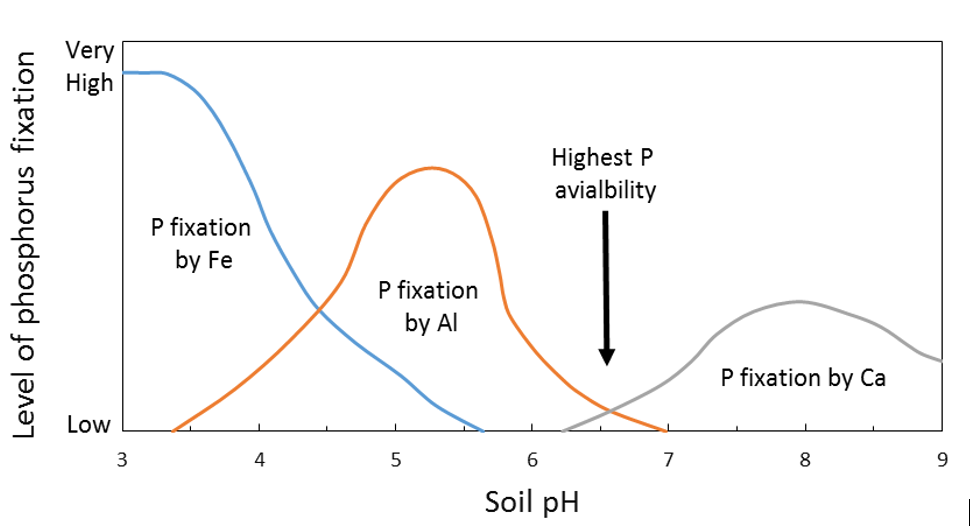
Plant available P in soil solution is predominantly present as H2PO4- (Dihydrogen phosphate) or as HPO4-2 (hydrogen phosphate) in more neutral and alkaline soils. Various estimates indicate approximately 70–95% of P fertiliser added in the crop year becomes part of the soil reserve (Price 2006, McBeth et al., 2012). The soil reserve is made up of:
- Sorbed P (P held on the surface of fine clay particles),
- Secondary P minerals (freshly bounded Fe, Al and Mn phosphates [acid soils] and Ca and Mg phosphates [alkaline soils]) and
- Primary P minerals (age and crystallised Fe, Al, Mn, Ca and Mg phosphates).
The soil P reserve (Figure 2) in P adequate soils (Table 2) provides the largest percentage of crop requirements in any one year which is estimated at ~30–95% (Price 2006, McBeath et al., 2012). Phosphorus fertiliser applied at sowing can directly provide ~5–30% of crop requirements (McBeath et al., 2012) with the percentage of available P in stubble estimated at ~9–44% (Noack et al., 2012) and in roots ~21–26% (Foyjunnessa et al., 2016).
PBI: The Phosphorus Buffering Index (PBI) test measures the P sorption of the soil. This is the process by which soluble P becomes adsorbed to clay minerals and/or precipitates out in soil and it determines the partitioning of P between the solid and solution phases of the soil. A high PBI will quickly bind P to soil exchange sites and make it less available for plant uptake. Consequently, P sorption capacity of soil influences the availability of P to plants and can be useful for determining Colwell P critical values. Figure 3 shows the relationship between PBI and Colwell P critical for wheat. Usually, large changes in PBI values are required to change crop critical values. Examples of this are provided in Table 1 calculated from Moody (2007) and Bell et al., (2013).
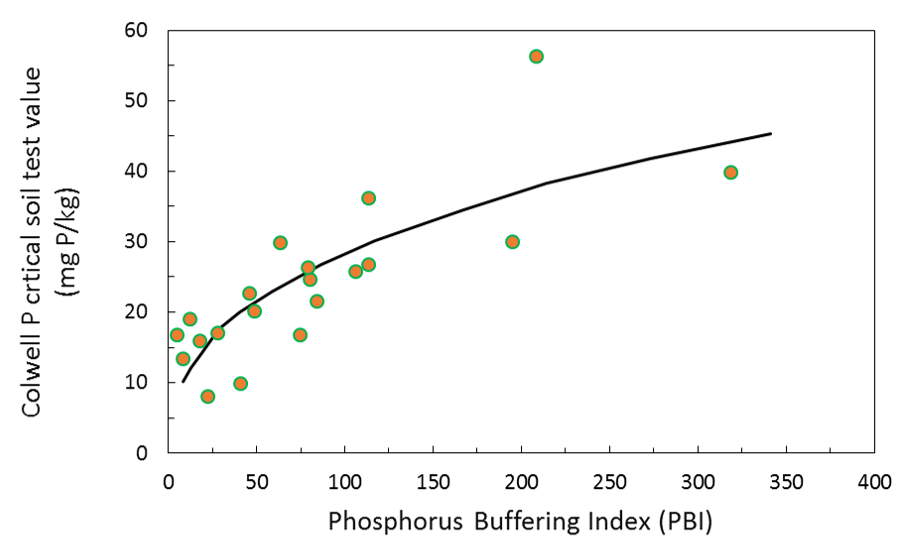
Table 1. Estimated 90% critical Colwell P soil values (mg P/kg soil) for wheat grown in soils with differing PBI (Moody 2007 and Bell et al., 2013).
P Buffering | PBI | Estimated 90% critical P | P Buffering | PBI | Estimated 90% critical P |
|---|---|---|---|---|---|
Extremely low | 10 | 11.4 | Low | 80 | 25.7 |
Very very low | 20 | 14.9 | Moderate | 180 | 35.4 |
Very low | 40 | 19.6 | High | 350 | 46 |
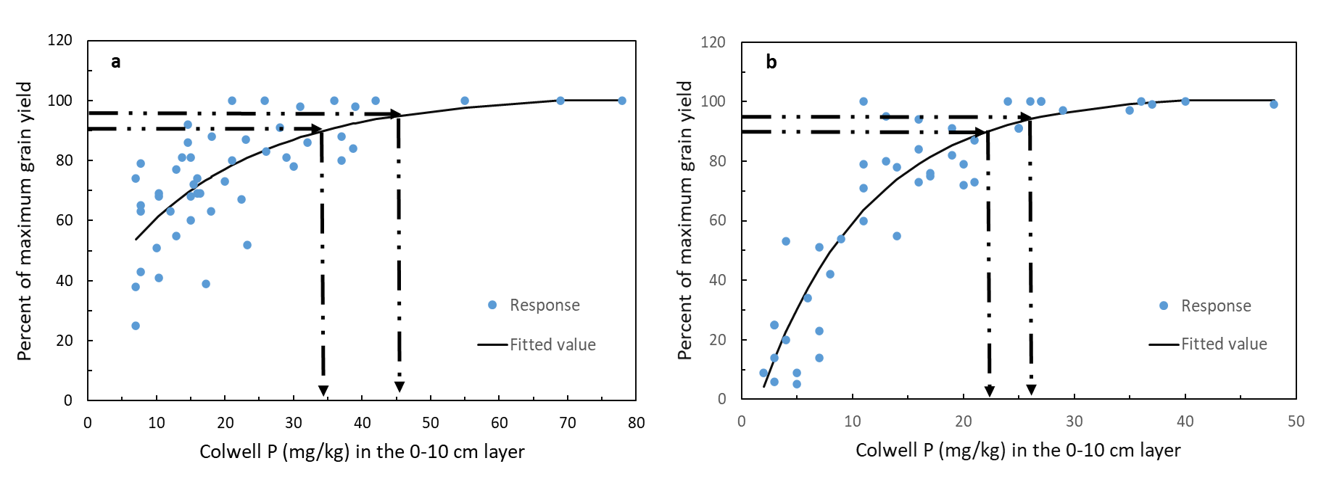
Critical Colwell P soil test values: An analysis of data from the BFDC database using Mitscherlich equations indicates 90 and 95% critical values for canola across soil types are estimated at 23 and 26 mg P/kg soil using Colwell P at 0-10cm soil depth (Figure 4b). While the quadratic equation for canola predicts a Colwell P range from 20 to 25 kg P /kg soil (Table 2). The same comparisons for wheat on red chromosols indicate a Colwell P critical of 34 and 45 (Figure 4a) using the Mitscherlich equation, while the quadratic equations predict 30 to 38 mg P/kg soil (Table 2). This suggests for canola and wheat where Colwell P values are above 26 and 45 mg P/kg soil respectively, the opportunity exists to provide a more conservative P input program focused on P replacement rather than P accumulation.
Table 2. Colwell P (mg /kg soil) values for 90 and 95% of maximum grain yield for various crop and soil type combinations extracted from the BFDC database. Estimated Colwell P critical values for chickpea, faba bean, lentil and broadleaf lupins are not available from the BFDC database due to no or insufficient data. Similarly, not enough data exists for feed barley, field pea, canola and narrow leaf lupin to provide specific soil type estimates of Colwell P critical values. Where states are nominated under ‘location’ this refers to the state where most of the experiments (not necessarily all) were conducted (BFDC database 2022).
Species | Soil | 90% | 95% | Location |
|---|---|---|---|---|
Feed barley | All soils | 20 | 25 | National |
Field Pea | All soils | 27 | 34 | National |
Narrow leaf lupin | All soils | 22 | 26 | National |
Canola | All soils | 20 | 25 | National |
Wheat | All soils | 24 | 32 | National |
Wheat | Chromosol red | 30 | 38 | NSW, QLD, Vic |
Wheat | Chromosol brown | 17 | 19 | WA, SA |
Wheat | Chromosol grey | 18 | 21 | WA |
Wheat | Calcarosol calcic | 24 | 29 | SA, Vic, Wa |
Wheat | Dermosol | 27 | 35 | NSW |
Wheat | Kandosol red | 24 | 30 | NSW |
Wheat | Tenosol | 16 | 20 | WA, SA, Tas |
Wheat | Sodosol brown | 27 | 32 | NSW, Vic, SA |
Wheat | Vertosol black | 25 | 33 | NSW, QLD |
Wheat | Vertosol brown | 24 | 32 | NSW, SA |
Wheat | Vertosol grey | 18 | 21 | Vic, NSW, QLD |
Long term experimental results – Dahlen: At Dahlen near Horsham in Victoria a long-term P and nitrogen experiment was conducted over the period 1996 to 2014 on a vertosol soil with a phosphorus buffering index of 110. Since establishment, the site has been in a canola, wheat, barley, pulse rotation. The fertiliser treatments include five rates of nitrogen (0, 20, 40, 80, 160 kg/ha as urea) and four rates of phosphorus (0, 9, 18, 36 kg/ha as triple super) applied annually over 18 years. Nitrogen was not applied during the pulse phase of the rotation. Annual rainfall over the period varied between 270 and 630 mm with average annual rainfall of 420 mm. The experiment had two complete crop failures (2002, 2006) and these years were fertilized and yields (nil) included in the averages in Figures 5 and 6.
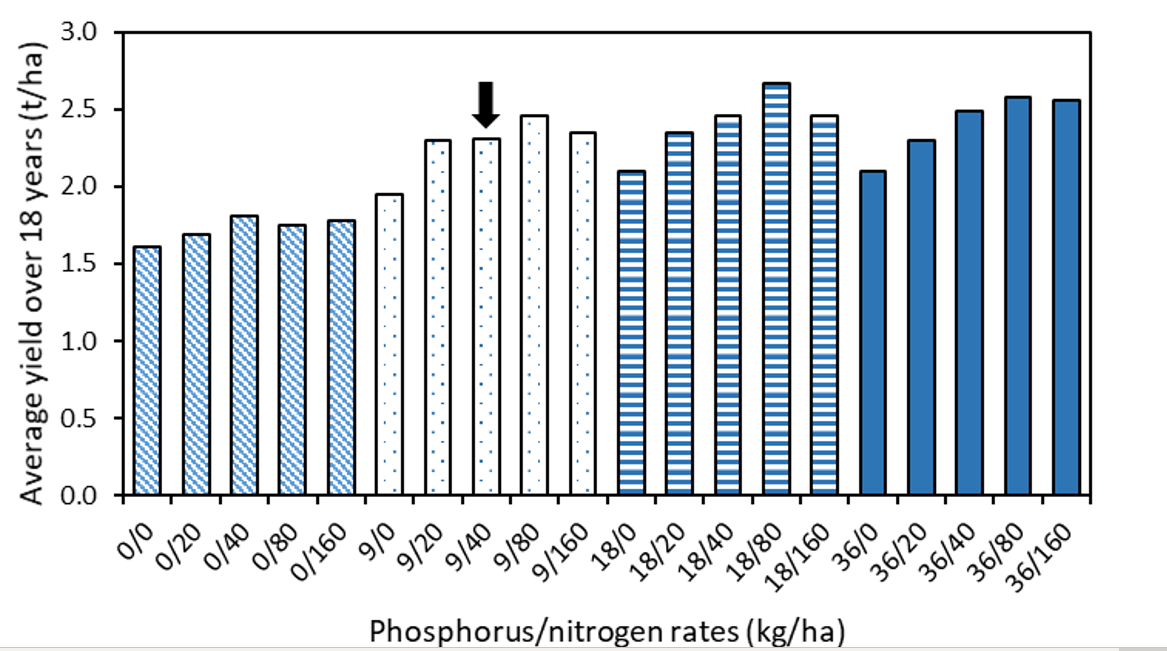
Approximate phosphorus and nitrogen balance (long-term fertiliser inputs equal long-term P and N off-take in grain) was achieved at applied treatment rates of 9 kg P/ha and 40 kg N/ha and provided an average yield of 2.31 t/ha. Calculated P and N offtake for the 9 P/ 40 N treatment was estimated at 8 and 46 kg/ha of P and N respectively. Consequently the 9 P/ 40 N treatment was slightly under supplied with N slightly over supplied with P which is supported by cumulative P balance presented in Figure 6. The highest average yield (2.67 t/ha) was achieved by inputs of 18 P/80 N which was an average increase of 0.36 t/ha. However, this treatment (18 P / 80 N) was less profitable than the 9 P/ 40 N using a number of fertiliser price scenarios.
The starting Colwell P for the Dahlen site in 1996 was 24 mg P/kg soil and it took 10 years (2004) for the 9 kg P/ha rate to raise the soil Colwell P to 30 mg P/kg soil. During this period the soil Colwell P value would have limited grain yield response. This should be considered when interpreting average yield results in Figure 5 reported above. The best estimates of P and N rates for the Dahlen site are 8 to 9 kg P/ha and 45 to 50 kg N/ha. These estimated P and N inputs are best perused after firstly rapidly raising the soil P Colwell P value from 24 (site starting Colwell P) to between 30 and 38 mg P/kg soil (critical P range for this wheat in this soil).
Annual P removal varied with crop type and yield at Dahlen. Seed P concentrations at delivered moisture concentrations were 2.7 kg P/t for barley, 2.8 kg P/t for wheat, 3.3 to 3.8 kg P/t for pulses, and 5.1 kg P/t for canola. Seed P concentrations were higher under higher P rates and these differences were included in the nutrient balances shown in Figure 6. The seed P concentrations for wheat and canola from Dahlen were similar to those reported by Norton (2012; 2013) from NVT trials and presented in Table 5.
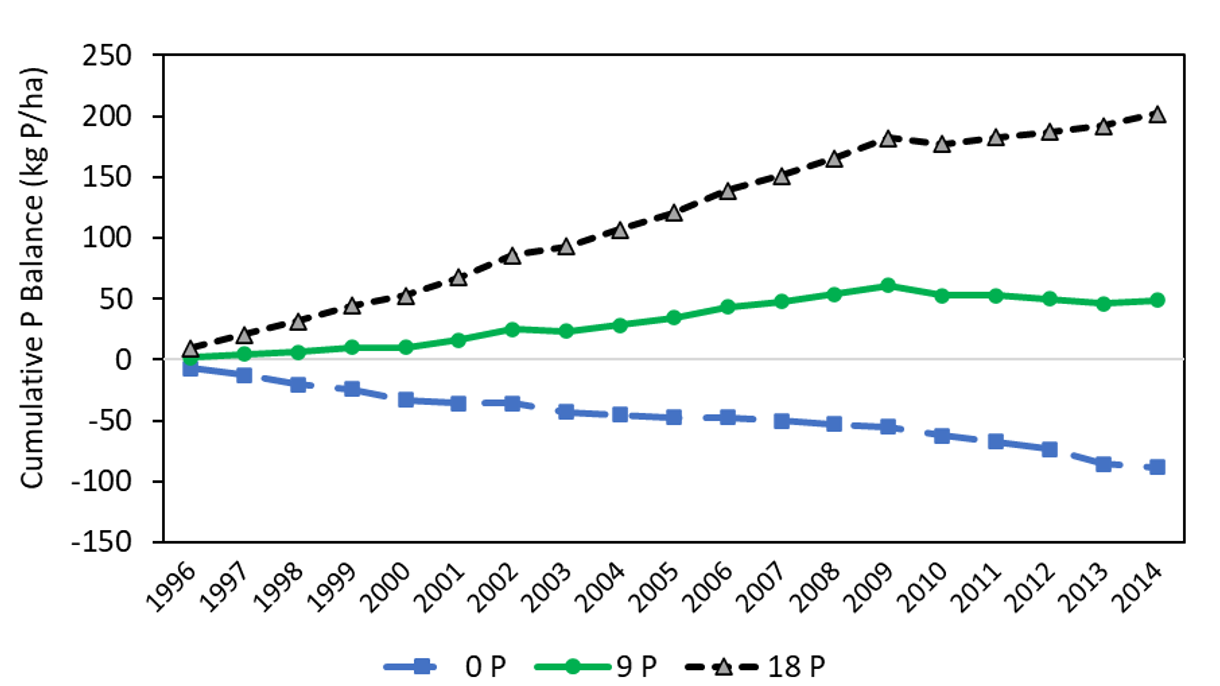
Over the duration of the experiment, Colwell P (0-10 cm) started at ~24 mg/kg in 1996, and by 2015 soil test values were 17, 40 and 72 mg/kg under the 0P/40N, 9P/40N and 18P/40N treatments (Figure 6). At the 9P/40N annual rates, 88% of the P applied was recovered in grain and the soil test increased by 16 units (Colwell P 24 in 1996 and Colwell P 40 in 2014). The last 11 years of the 9P/40N treatment provided optimal P for this system. Applying 18P/40N did not give a significant yield increase over 9P/40N, with the extra P largely going into increasing the soil test values through time and higher P concentrations in grain.
Long term experimental results - Glenelg: At Glenelg near Grenfell in central New South Wales a long-term P and N experiment on a red chromosol soil has been continually assessed since 2007. The soil phosphorus buffering index is 46, soil pH on the phosphorous only treatments was 4.8 (CaCl2) in 2008 and 4.6 (CaCl2) in 2021. The site has been in a canola, wheat and pulse rotation with five P and N fertiliser treatments (0, 10, 20, 30, 40 kg/ha as triple super and 0, 30, 60, 90, 120 kg/ha as urea). Nitrogen was not applied during the pulse phase of the rotation. Drought years were 2007, 2017, 2018 and 2019, canola was resown in 2014 and Albus lupins were grown in 2010. Stubble was burnt the week before planting in 2011, 2015, 2017 and stubble was retained in the other years. Annual rainfall over the period has varied between 285 and 1066 mm with average annual rainfall of 657 mm. Growing season rainfall (April-October) has varied between 127 mm and 616 mm for an average annual of 315 mm (Table 3).
Table 3. Annual and growing season rainfall (GRS) at Glenelg for years 2007 to 2021.
Year | 2007 | 2008 | 2009 | 2010 | 2011 | 2012 | 2013 | 2014 | 2015 | 2016 | 2017 | 2018 | 2019 | 2020 | 2021 |
|---|---|---|---|---|---|---|---|---|---|---|---|---|---|---|---|
Annual | 517 | 559 | 611 | 1066 | 806 | 640 | 486 | 611 | 664 | 921 | 618 | 347 | 285 | 736 | 996 |
GSR | 212 | 278 | 318 | 483 | 243 | 249 | 308 | 340 | 429 | 616 | 188 | 173 | 127 | 511 | 419 |
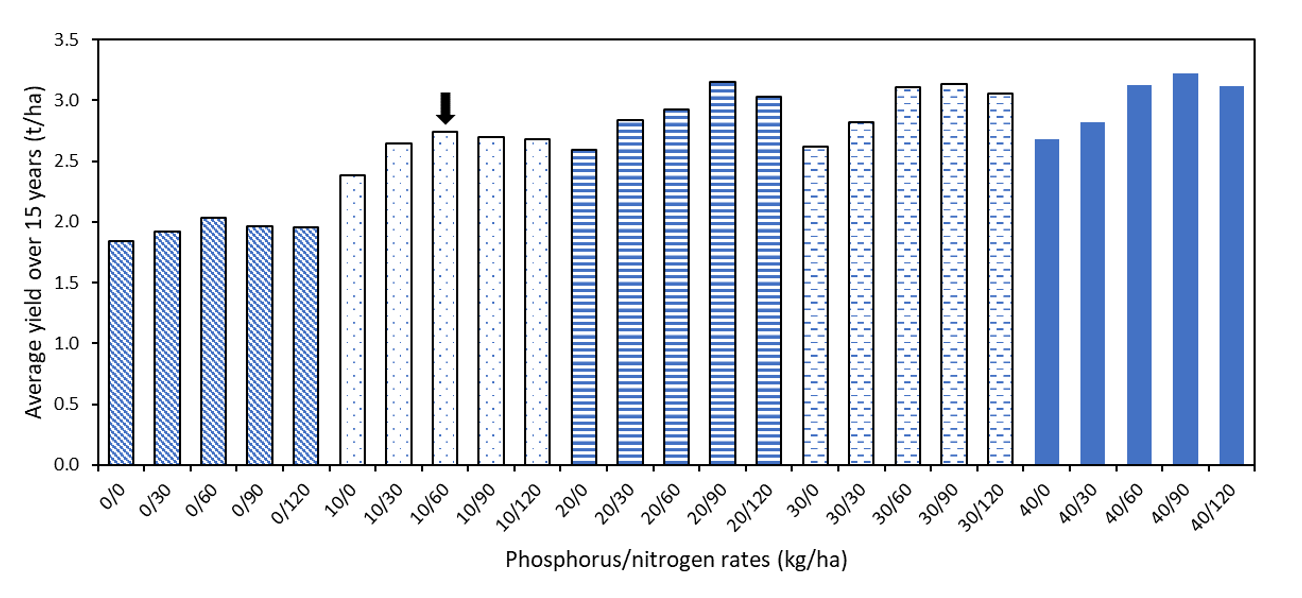
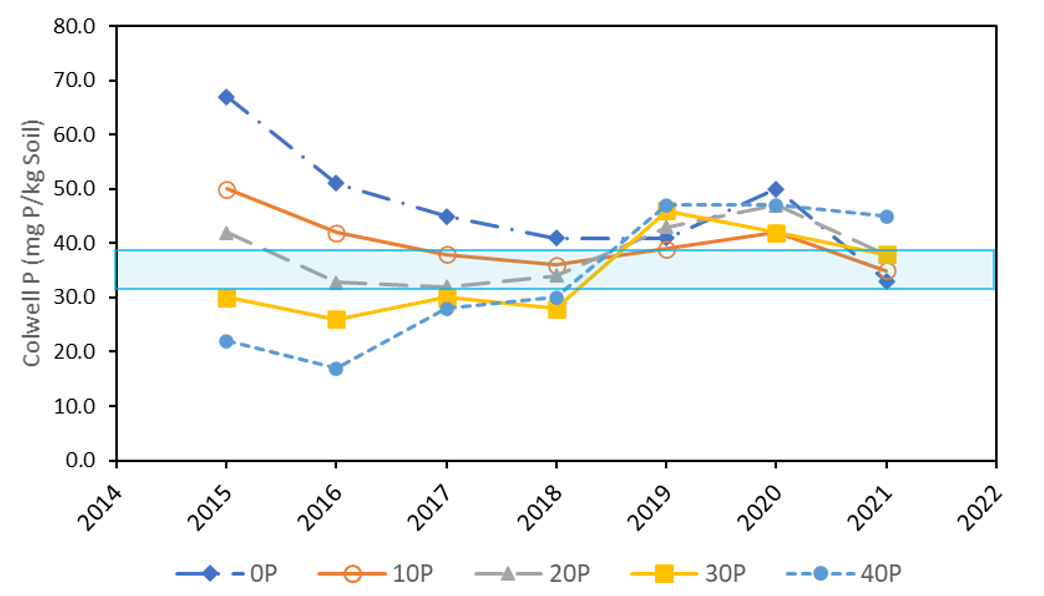
Phosphorus and N balance (long-term fertiliser inputs equal long-term P and N off-take in grain) was achieved at applied rates approximating 10 kg P/ha and 60 kg N/ha and achieved an average yield of 2.74 t/ha. Calculated P and N offtake for the 10 P/ 60 N treatment was estimated at 11 to 13 and 55 to 62 kg/ha of P and N respectively. At long term average P and N costs the highest profit was achieved at long term P and N off-take rates (appendix 1). The highest yielding treatment (20 P/90 N) was not more profitable and has accumulated soil phosphorus levels (Figure 8) above crop critical requirements and increased the soil N bank (data not shown). Phosphorus removal in grain approximated 4.2 kg P /t across the rotation.
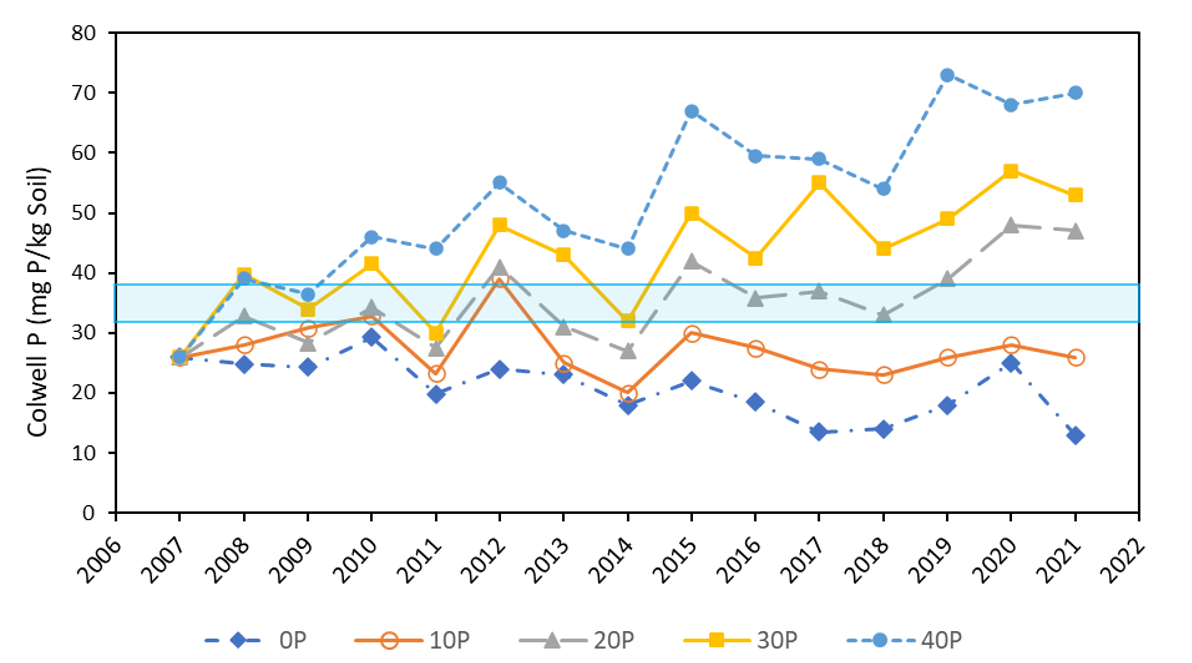
The starting Colwell P for the Glenelg site in 2007 was 26 mg P/kg soil and the 10 kg P/ha rate maintained this same Colwell P through to 2021 (open circle, Figure 8) but did not increase Colwell P into the critical range (open circles compared with shaded area Figure 8). Consequently, this Colwell P would have limited grain yield in some years effecting average yield shown in Figure 7. It took ~7 years for the soil Colwell P value to be consistently higher in the 20 kg P/ha rate (solid triangle, Figure 8) compared to the 10 kg P/ha rate (open circle, Figure 8). When considering Figure 8 in a paddock context it is clear that the 20 kg P/ha rate (closed triangle) could have been reduced to 11 to 13 kg P/ha (long term P off-take levels) at sowing in 2021 to reduce P input costs without likely impacting yield (Figure 8 and Figure 7).
The important question that arises from Figure 8 is how much can P inputs be reduced if there is a starting Colwell P above the critical range. In Figure 8 we identified that a P input of 10 kg/ha (open circle) was able to maintain the same soil Colwell P value through time. In Figure 9 the P input of 10 kg P/ha (also open circle) started at a Colwell P value of 50 and after 7 years reduced to Colwell P 35 which is within the critical range for wheat on this soil type. This suggests the actual replacement rate for P at this site is at the upper end of the calculated off-take rate of 11 to 13 kg P/ha.
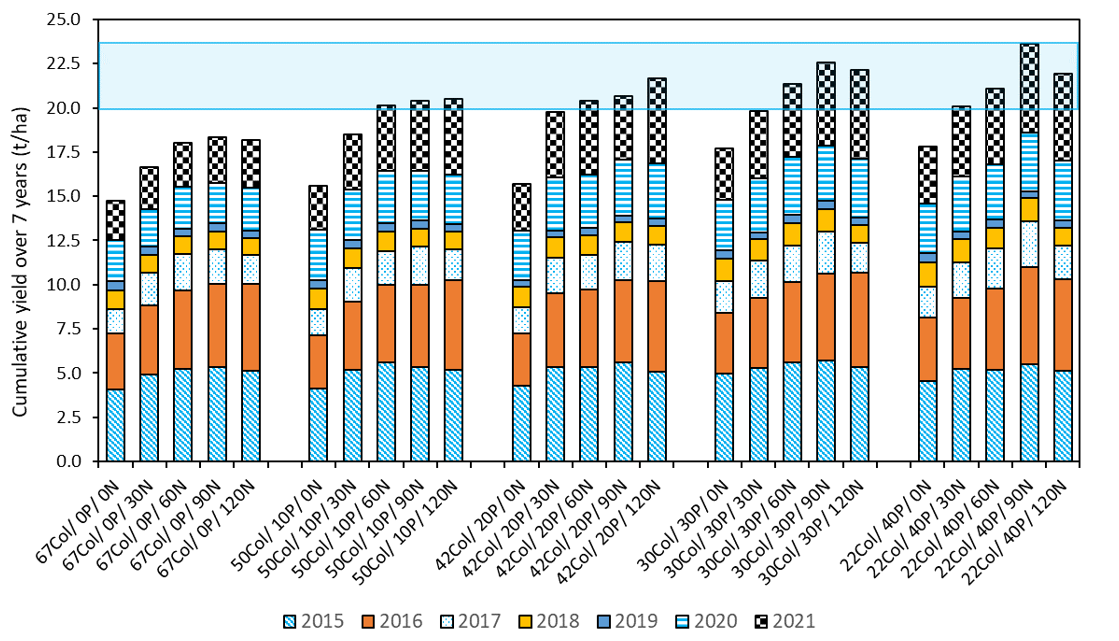
The results in Figure 10 indicate that even with a high starting Colwell P value of 67 mg P/kg soil, nil P application at sowing results in lower yields and that this is exacerbated by N rates below 60 kg N/ha. This clearly shows that even with very high soil Colwell P values, starter P applied at sowing is necessary to obtain potential yield in a wheat canola rotation (Figure 10) where sowing times are late April and May. In a high Colwell P soil adding 10 and 60 kg/ha of P and N respectively increased cumulative yield by 5.4 t/ha over 7 years or 770 kg of grain per ha per year. The high grain yield from the use of starter P may be partly explained by; McBeath et al., (2012) who showed that starter P increased total plant P uptake which was in turn explained by higher subsoil P uptake (e.g., higher uptake of native P below 10 cm), and Singh et al., (2005) who showed P applied at sowing resulted in improved subsoil water extraction.
Where the starting soil Colwell P was 50 the most profitable treatment inputs were 10 kg P/ha and 60 kg N/ha. Increasing P (20, 30 and 40 kg P/ha) and N (90 and 120 kg N/ha) above these rates did not improve cumulative grain yield at Colwell P starting values of 50, 42, 30 and 22 (Figure 10).
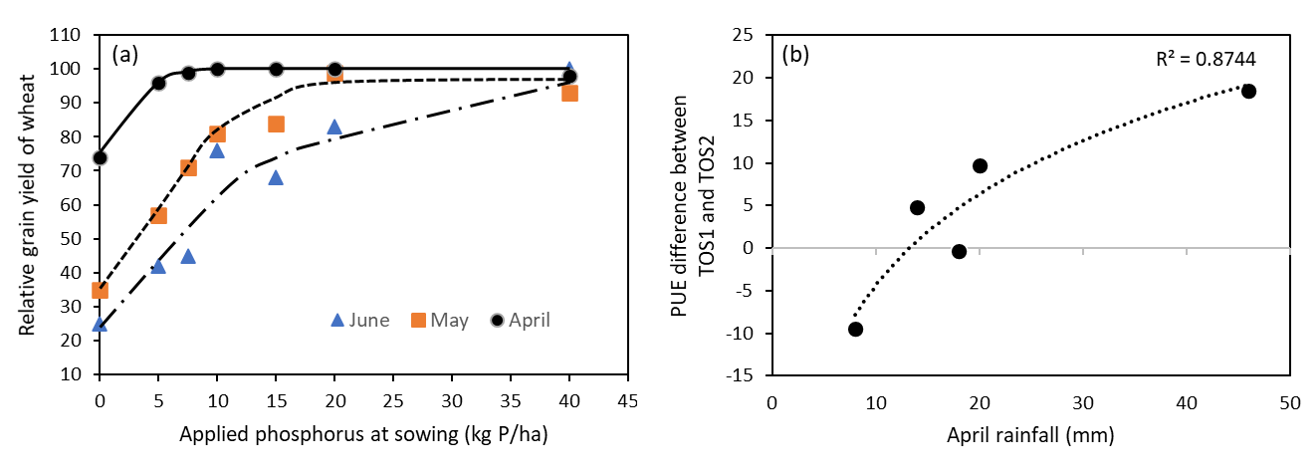
Time of sowing impacts on P requirements: Research by Batten et al., (1999) in NSW showed that on two P responsive sites at Cowra and Condobolin there was a significant effect of sowing time on starter P requirements. At the Cowra site, starter P requirements with June sowing were greatest (>20 kg/ha), however this rate had no effect on grain yield when the crop was sown in early April with good stored soil water. Similar sowing time effects were recorded at Condobolin where optimal starter P rates increased from 5 kg P/ha to 10-15 kg P/ha to 25 kg P/ha for April, May, and June sowing times respectively (Figure 11a).
Recent work has assessed sowing time effects on P requirements in SA on P responsive soil types driven by high PBI (> 100) associated with soil calcium carbonate contents > 10%. In accordance with previous work, it found, if adequate soil moisture was present at April sowing times, starter P rates could be reduced without any impact on grain yield (Figures 12a and b). This benefit diminished if either low moisture was prevalent in April or sowing times were delayed to mid-May or later.
The changes in Phosphorus Use Efficiency (PUE) for starter P applied for an April sowing is improved by early rainfall (Figure 11b). Under high soil moisture and warm temperatures crop root systems are more extensive and therefore exploration of soil P reserves is higher placing less reliance on fertiliser P inputs. Soil diffusion rates of P in these conditions are also optimised. It’s estimated from Figure 11a and b that reducing starter P rates is an option where April stored soil water is >40mm and an early sowing rainfall event is received.
Diffusive gradients in thin-films (DGT) soil P test: The relative new method for measuring available P called Diffusive Gradients in Thin-films (DGT) was first invented in the UK in the late 1990’s and on the back of promising glasshouse and field trial results, DGT was first made available in Australia in 2012 as a commercial soil test for P. DGT measures the diffusive supply of available P in the soil by employing a P sink (an iron oxide gel) and membrane which controls movement of P to the sink. DGT testing differs from the traditional Colwell P testing by mimicking the plant roots uptake of P rather than relying on a chemical extraction and displacement of P with another anion under fixed pH conditions.
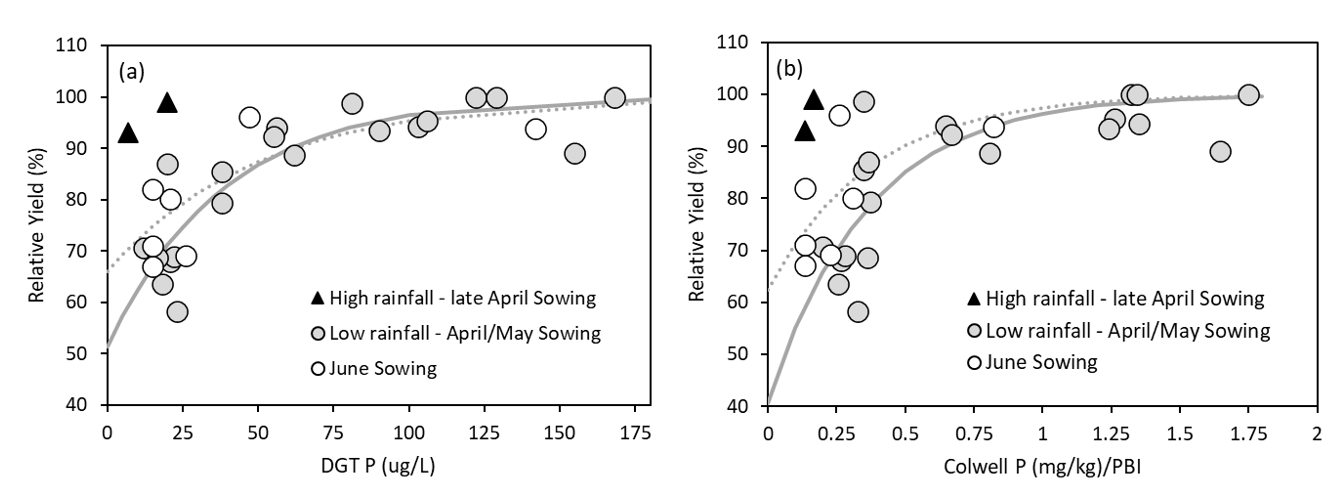
The power of DGT P over traditional methods of measuring P is the identification of P responsive soils where traditional tests such as Colwell P overestimate crop P supply. For example, soils containing calcium carbonate have been key targets for DGT P testing as P forms in these soils can be easily fixed which has led to replacement P programs undersupplying crop requirements where traditional P testing methods such as Colwell P were applied. With continued inclusion of trial work, DGT P has shown significant promise on soil types where P complexation and fixation attributed to soil Fe and Al commonly present in acids soils. Recent trials in NSW and WA have indicated an improved detection of P deficiency in soils where higher PBI values indicate additional P input requirements are necessary above P removal rates via grain. DGT P critical values continue to be stable for wheat as testing is expanded across sites and years (Mason et al., 2010 vs Table 4). Critical values are also being developed for other crops (Table 4). Opportunities exist to use DGT P to provide greater confidence on plant available P and thereby better inform P replacement programs.
Table 4. DGT critical values and critical ranges produced from 95% confidence intervals around the critical value for various crop types. Field trials were predominantly conducted in WA, SA, VIC and NSW. NA means the critical ranges don’t cross 90% relative yield due to a poor correlation caused by very low yielding sites.
Crop type | Number of trials | DGT critical Value (ug P/L) | Critical Range | R2 with relative yield |
|---|---|---|---|---|
Wheat | 134 | 63 | 56-73 | 0.66 |
Barley | 45 | 65 | 51-84 | 0.63 |
Canola | 27 | 33 | 24-46 | 0.55 |
Lentils | 23 | 44 | NA | 0.25 |
Field Pea | 10 | 51 | 26-84 | 0.63 |
Chickpeas | 17 | 48 | NA | <0.2 |
P Budgeting: Phosphorus is exported in grain and recycled in stubble and roots provided the stubble component is retained. Phosphorus in wheat grain ranges from 2.7–3.9 kg P/t, while in canola seed the range is 3.9–7.8 kg P/t (Table 5). Phosphorus in stubble for wheat and canola ranges from 1.0-3.0 kg P/t and 2.0–4.0 kg P/ha, respectively. Root P concentrations in wheat and canola ranges from 1.5–3.0 and 2.0–2.5 kg P/t respectively.
Table 5. Concentrations of phosphorus (kg/t) for wheat and canola grain samples selected from NVT sites. Values are expressed on a dry weight basis (Norton 2012; 2014).
State | NSW | NSW | NSW | SA | SA | SA | Vic | Vic | Vic |
|---|---|---|---|---|---|---|---|---|---|
Wheat | |||||||||
P in grain | 2.7 | 3.6 | 3.1 | 3.1 | 3.9 | 3.4 | 2.9 | 3.6 | 3.2 |
Canola | |||||||||
P in grain | 3.9 | 6.6 | 5.2 | 5.1 | 7.8 | 6.2 | 5.2 | 6.5 | 5.7 |
Approximations used for P budgeting in wheat include grain P export (2.7–3.6kg P/t) plus stubble P not accessible to the following crop (0.4–0.8kg P/t) plus soil fixation (0.3–0.7kg P/t grain production) which provides an estimated 3.4–5.1kg P required per tonne of grain production. Note this is similar to the estimate provided by the Glenelg long term experiment of 4.2 kg P/t of grain production. Canola seed P export (4.0–6.5kg P/t) plus stubble P not accessible (0.4–0.8kg P/t) plus soil losses (0.2–0.6kg P/t grain production) which provides an estimated 4.6–7.9kg P required per tonne of grain. On a per hectare basis, the export of P for wheat and canola is approximately the same assuming canola has half the water use efficiency for grain production as wheat. These budgets are of course very approximate, and they must be assessed and adjusted by tracking soil P values over several years to determine if soil test values are increasing (over estimate of P budget), decreasing (under estimate of P budgeting), or remaining within the critical 90 and 95% range for your particular soils. After several years of soil testing and adjusting P inputs it is possible to ensure relatively stable soil P test values.
Nitrogen
Nitrogen requirements for wheat, barley and canola grain production are approximately 10 to 13 times greater than that of P requirements for these crops and typically soil mineralisation of N is often inadequate to meet crop demands (Angus and Grace, 2016; Hochman and Horan, 2018). For example, Armstrong et al., (2021) found at a long-term site in western Victoria near Horsham, the 17 year mean minimum and mean maximum preseason mineral N for different crop rotations was 32 and 104 kg N/ha respectively, in an environment where the average wheat crop soil N requirement is approximately 150 kg N/ha. This suggests preseason N can supply as low as 21% of crop demand and as high as 70%. The long-term sites at Dahlen and Glenelg supplied approximately 50% of crop N requirements from soil mineralisation. The important consideration from these data is that crop rotation choice and previous N fertiliser history can make an enormous difference to preseason N supply and the only direct way to assess this is to undertake preseason soil N estimates using in-situ soil cores.
Typically, the industry rule of thumb for N is, wheat needs approximately 40 kg of soil mineral N per tonne of grain production while canola requires 80 kg of soil mineral N per tonne of grain production - assuming 50% crop recovery. Yield is then estimated on longer term average rainfall (stored plant available water at sowing (mm) + average growing season rainfall [mm] – soil evaporation [110 mm] x 20 = estimated yield in kg /ha). For wheat, the predicted grain yield in tonnes per ha is multiplied by 40 kg N/ha to indicated total soil N required for an average season. From this, pre-season soil N is subtracted to provide an estimate of the fertiliser N requirement to maximise grain yield in an average season. In this rule of thumb, 40 kg N/t of grain production assumes 50% crop recovery of soil N, however several studies suggest this is an over estimate. For example, Angus and Grace (2016) found after reviewing an extensive list of literature that wheat recovery of fertiliser N was on average 44%. In recent studies Armstrong et al., (2021) found an average N recovery of 35% and Sandral et al., (2018) found that to achieve 13% protein, 51 to 58 kg N/t of wheat production was required where crop recovery of soil N was between 35 to 40%. This suggests in the year of application an estimate of 50% crop recovery of fertiliser N is optimistic. Retrospective checking of N inputs can be undertaken by using a grain protein monitor to assess if grain protein was between 11.5 and 12.5%. Grain protein results below this range indicates insufficient N supply and that additional N would have produced a higher yield (Brill et al., 2013; Sandral et al., 2018; Unkovich et al., 2020).
In recent times there has been a growing emphasis on N banking targets that provide a base level of fertility (Meier et al., 2021) for cropping system. N banking for example uses a decile 7 season as the rainfall basis for estimating crop yield and N demand. Once this approach is established in the crop rotation, the annual fertiliser N input is buffered by the soil N bank, where carryover N from the preceding season(s) increases pre-sowing N which is subtracted from the N banking target to provide the fertiliser N input. This approach works well in environments that are not subject to high N losses as it relies on surplus N carryover from season to season. An approach similar to that described here has been tested by Kirkegaard et al., (2021). Their results at the Wagga Wagga Farming Systems site showed over two below average rainfall years (2018 and 2019) and one above average rainfall year (2021), the N banking approach using decile 7 rainfall to estimate crop N demand was more profitable than using a decile 2 N estimate. Similarly, Hunt et al., (2020; 2021) showed that N banking over three years maximised profit at neutral to slightly above positive N balance (long-term fertiliser inputs equal long-term P and N off-take in grain). This result agrees with the long-term experiments at Dahlen in Victoria and Glenelg in NSW.
The ongoing challenges for nitrogen management in cropping systems are associated with; (i) a general net negative N balance for many cropping paddocks while these same paddocks are often net P positive (Norton and Elaina vanderMark 2016), (ii) declining soil organic matter and soil N mineralisation (e.g., Heenan et al., 1995) and (iii) a half-life of total soil N between 18 to 34 years (Heenan et al., 2004; Helyar et al., 1997; Dalal et al., 2013). These circumstances highlight the current increasing requirements for fertiliser N and the lack of opportunity to reduce fertiliser N inputs unless these issues are addressed.
Conclusion
In the coming season N budgeting should proceed as the industry rule of thumb provided suggests. Growers and consultants should consider moving to an N banking approach which self-corrects based on pre-season soil N testing. Consideration should also be given to the lower fertiliser crop N recovery rates highlighted by a number of studies.
Care should be taken when reducing P inputs as long-term trials show yield improvements with the inclusion of starter P, even in high Colwell P soils. The yield increase from starter P is however diminished with early April sowing and good soil moisture conditions. Safe reductions in P inputs are therefore possible where soil test values are above crop critical requirements and early April sowing with good soil moisture is available. In these examples P can be reduced to estimated long term P removal rates in grain. However, this practise cannot be sustained if soil test values decline below the critical P range for the target crop. Long-term P budgeting along with soil testing will provide guidance on where phosphorus inputs can be altered to avoid over or under application.
Acknowledgements
The long-term research presented in this paper is part of a Incitec Pivot Fertilizers resourced experimental at Dahlen in Victoria and Glenelg in NSW. Sowing time results and DGT P results were supported by resources from the GRDC and SAGIT. The authors would like to thank them for their support.
Appendix 1
To estimate profits from long term P studies at Dahlen in Victoria and Glenelg in NSW the following assumptions were made:
- The average wheat price was $280/t
- The average cost of P was tested in the range of $3.60 to $5.60 per kg and
- The average N cost was tested in the range of $1.40 to $3.00 per kg.
References
Anderson G, Brennan R, Bell R and Chen W (2015) Making better fertiliser decisions for cropping systems in Western Australia. Soil test – crop response relationships and critical soil test values and ranges. Department of Primary Industries and Regional Development, Western Australia, Perth. Bulletin 4865.
Angus JF and Grace PR (2016) Nitrogen use efficiency and nitrogen balance in Australian farmlands. The 7th International Nitrogen Initiative Conference (INI2016), Melbourne, 4 – 8 December 2016. http://www.ini2016.com/
Armstrong R, Wallace A and Dunsford K (2021) Nitrogen fertiliser use efficiency ‘rules of thumb’ - how reliable are they?
Batten GD, Fettel NA, Mead JA and Khan MS (1999) Effect of sowing date on the uptake and utilisation of phosphorus by wheat (cv. Osprey) grown in central New South Wales. Aus. J Exp Ag 39: 161-170.
Bell R, Reuter D, Scott B, Sparrow L, Strong W & Chen W (2013) Soil phosphorus–crop response calibration relationships and criteria for winter cereal crops grown in Australia. Crop and Pasture Science 64 (5), 480-498.
Brill R, Gardner M, Graham R and Fettell N (2013) Will low protein become the new norm? GRDC Grower & Advisor Update, Coonabarabran.
Cho W, Brorsen BW and Arnall DB (2020) Banding of phosphorus as an alternative to lime for wheat in acid soils. Agrosystmes, Geosciences & Environment. DOI: 10.1002/agg2.20071
Dalal RC, Thornton CM and Cowie BA (2013). Turnover of organic carbon and nitrogen in soil assessed from δ13C and δ15N changes under pasture and cropping practices and estimates of greenhouse gas emissions. Science of the Total Environment 465, 26-35.
Erisman JW, Sutton MA, Galloway J, Klimont Z & Winiwarter W (2008) How a century of ammonia synthesis changed the world. Nature Geoscience, 1(10), 636-639.
Foyjunnessa, McNeill A, Doolette A, Mason S and McLaughlin MJ (2016) Use of 33P to trace in situ the fate of canola below-ground phosphorus, including wheat uptake in two contrasting soils. Crop and Pasture. Science 67:726–738. https://doi.org/10.1071/CP15311
Heenan DP, Chan KY and Knight PG (2004) Long-term impact of rotation, tillage and stubble management on the loss of soil organic carbon and nitrogen from a Chromic Luvisol. Soil & Tillage Research 76, 59–68.
Heenan DP, McGhie WJ, Thomson FM and Chan KY (1995) Decline in soil organic carbon and total nitrogen in relation to tillage, stubble management, and rotation. Australian Journal of Experimental Agriculture. (1995), 35, 877-84.
Helyar KR, Cullis BR, Furniss K, Kohn GD and Taylor AC (1997) Changes in the acidity and fertility of a red earth soil under wheat-annual pasture rotations. Australian Journal of Agricultural Research. 48, 561–586.
Hochman Z and Horan H (2018). Causes of wheat yield gaps and opportunities to advance the water-limited yield frontier in Australia. Field Crops Research Journal 228, 20-30.
Hunt, J (2020) Managing nitrogen for high crop yields and sustainable farming systems. GRDC Grower & Advisor Update. https://grdc.com.au/resources-and-publications/grdc-update-papers/tab-content/grdc-update-papers/2020/07/managing-nitrogen-for-high-crop-yields-and-sustainable-farming-systems
Hunt J, Kirkegaard J, Maddern K and Murray J (2021) Strategies for long term management of N across farming systems. GRDC Grower & Advisor Update, Wagga Wagga.
Kirkegaard J., Swan T., Dunn M., Sandral G., Wish J., et al. (2021). Managing water and N across years and crop sequences to drive profit. GRDC Grower & Advisor Update, Wagga Wagga.
Kaitibie S, Epplin FM, Krenzer EG, and Zhang H (2002). Eco-nomics of lime and phosphorus application for dual-purpose winter wheat production in low-pH soils. Agronomy Journal, 94(5), 1139–1145. https://doi.org/10.2134/agronj2002.1139
Mason S, McNeill A, McLaughlin MJ and Zhang H (2010) Prediction of wheat response to an application of phosphorus under field conditions using diffusive gradients in thin-films (DGT) and extraction methods. Plant Soil 337: 243-258.
Mason S and Mcdonald G (2021) Time of sowing influences wheat responses to applied phosphorus in alkaline calcareous soils in a temperate environment. Crop Pasture Sci 72: 861-873.
McBeath TM, McLaughlin MJ, Kirby JK and Armstrong RD (2012) The effect of soil water status on fertiliser, topsoil and subsoil phosphorus utilisation by wheat. Plant Soil 358: 337-348.
Meier EA, Hunt JR and Hochman Z (2021) Evaluation of nitrogen bank, a soil nitrogen management strategy for sustainably closing wheat yield gaps. Field Crops Research 261.
Moody PW (2007) Interpretation of a single-point P buffering index for adjusting critical levels of the Colwell soil P test. Soil Res. 45, 55-62.
Nkebiwe PM, Weinmann M, Bar-Tal A and Muller T (2016) Fertilizer placement to improve crop nutrient acquisition and yield: A review and meta-analysis. Field Crops Res 196:389-401
Noack SR, McLaughlin MJ, Smernik RJ, McBeath TM and Armstrong RD (2012) Crop residue phosphorus: speciation and potential bio-availability. Plant Soil 359:375–385. DOI 10.1007/s11104-012-1216-5
Norton RM (2012) Wheat grain nutrient concentrations for south-eastern Australia. "Capturing Opportunities and Overcoming Obstacles in Australian Agronomy". Edited by I. Yunusa. Proceedings of 16th Australian Agronomy Conference 2012, 14-18 October 2012, Armidale, NSW. http://www.regional.org.au/au/asa/2012/nutrition/7984_nortonrm.htm
Norton RM (2014) Canola seed nutrient concentration for southern Australia. In Ware AH and Potter TD (eds) 18th Australian Research Assembly on Brassicas (ARAB 18). Tanunda, 2014. Proceedings. Australian Oilseed Federation, p 1-6.
Norton R and vanderMark E (2016). Nitrogen performance indicators on southern Australian grain farms. Proceedings of the 2016 International Nitrogen Initiative Conference, "Solutions to improve nitrogen use efficiency for the world", 4 –8 December 2016, Melbourne, Australia.
Price G (2006) Australian Soil Fertiliser Manual. Fertiliser Industry Federation of Australia Inc. CSIRO Publishing.
Sandral GA, Tavakkoli E, Harris F and Koetz E (2018) Improving nitrogen fertiliser use efficiency in wheat using mid-row banding. GRDC Grower & Advisor Update, Wagga Wagga
Sandral GA, Tavvakkoli E, Brill R, Harris F, Pumpa R, Barati M, Koetz E and Angus J (2019). Nutrition decisions following a dry season. Wagga Wagga GRDC Update 19 February 2019.
Singh DK, Sale PWG and Routley RR (2005) Increasing phosphorus supply in subsurface soil in northern Australia: rationale for deep placement and the effects with various crops. Plant and Soil 269, 35–44.
Unkovich MJ, Herridge DF, Denton MD, McDonald GK, McNeill AM, Long W, Farquharson R and Malcolm B (2020) A nitrogen reference manual for the southern cropping region. GRDC publication.
Contact details
Mr Jim Laycock – Research Agronomist, Incitec Pivot Fertilizers
Email: jim.laycock@incitecpivot.com.au
Ph: 0427 006 047
Twitter: @jlaycock55
