Soil and plant tissue testing for herbicide residues – how can it help
Soil and plant tissue testing for herbicide residues – how can it help
Take home messages
- Herbicide residue levels can be measured in soil, but to interpret what soil analysis results mean for the subsequent crop, information about how the soils were sampled, how the samples were analysed, crop toxicity thresholds, and soil-specific herbicide availability is needed.
- Soil analysis can provide an extra layer of information for decision making prior to sowing, but there will always be uncertainty in interpreting potential crop effects due to in-paddock variation, environmental conditions, and cultivar-specific tolerances.
- Soil analysis for herbicide residues is not a replacement for using herbicides according to label requirements.
- Leaf tissue testing for herbicide residues can also assist in diagnosing potential causes of poor crop performance.
Background
Ongoing adoption of new cropping, soil management and herbicide-use practices mean that growers and advisors continue to encounter challenges related to herbicide carryover in soil. New practices include early sowing, which can shorten the window for herbicide break-down; deep-ripping or soil inversion, which can change herbicide mobility and position in the soil profile; and use of new herbicide formulations where there is uncertainty around herbicide behaviour.
Accurate prediction of when herbicide residues will cause crop damage is related to several factors:
- Crop toxicity thresholds, which provides a measured concentration of herbicide in soil (for example, mg herbicide per kg of soil) that causes crop damage, are not well known.
- The bioavailable levels of herbicides (namely, how much the plant roots actually access) will vary from soil to soil, depending on herbicide and soil chemistry, and soil water content. Current soil tests nearly always report total, rather than (bio)available, herbicide residue concentrations.
- Other environmental factors can influence the herbicide toxicity, including weather conditions (for example, frost), soil properties (for example, micronutrient availability) and plant-specific characteristics (for example, cultivar tolerance).
- In most cases, more than one herbicide is usually detected in soil, and synergistic or antagonistic effects of these combinations remain unknown.
Considerations for soil analysis
Soil sampling
Where (and how many)
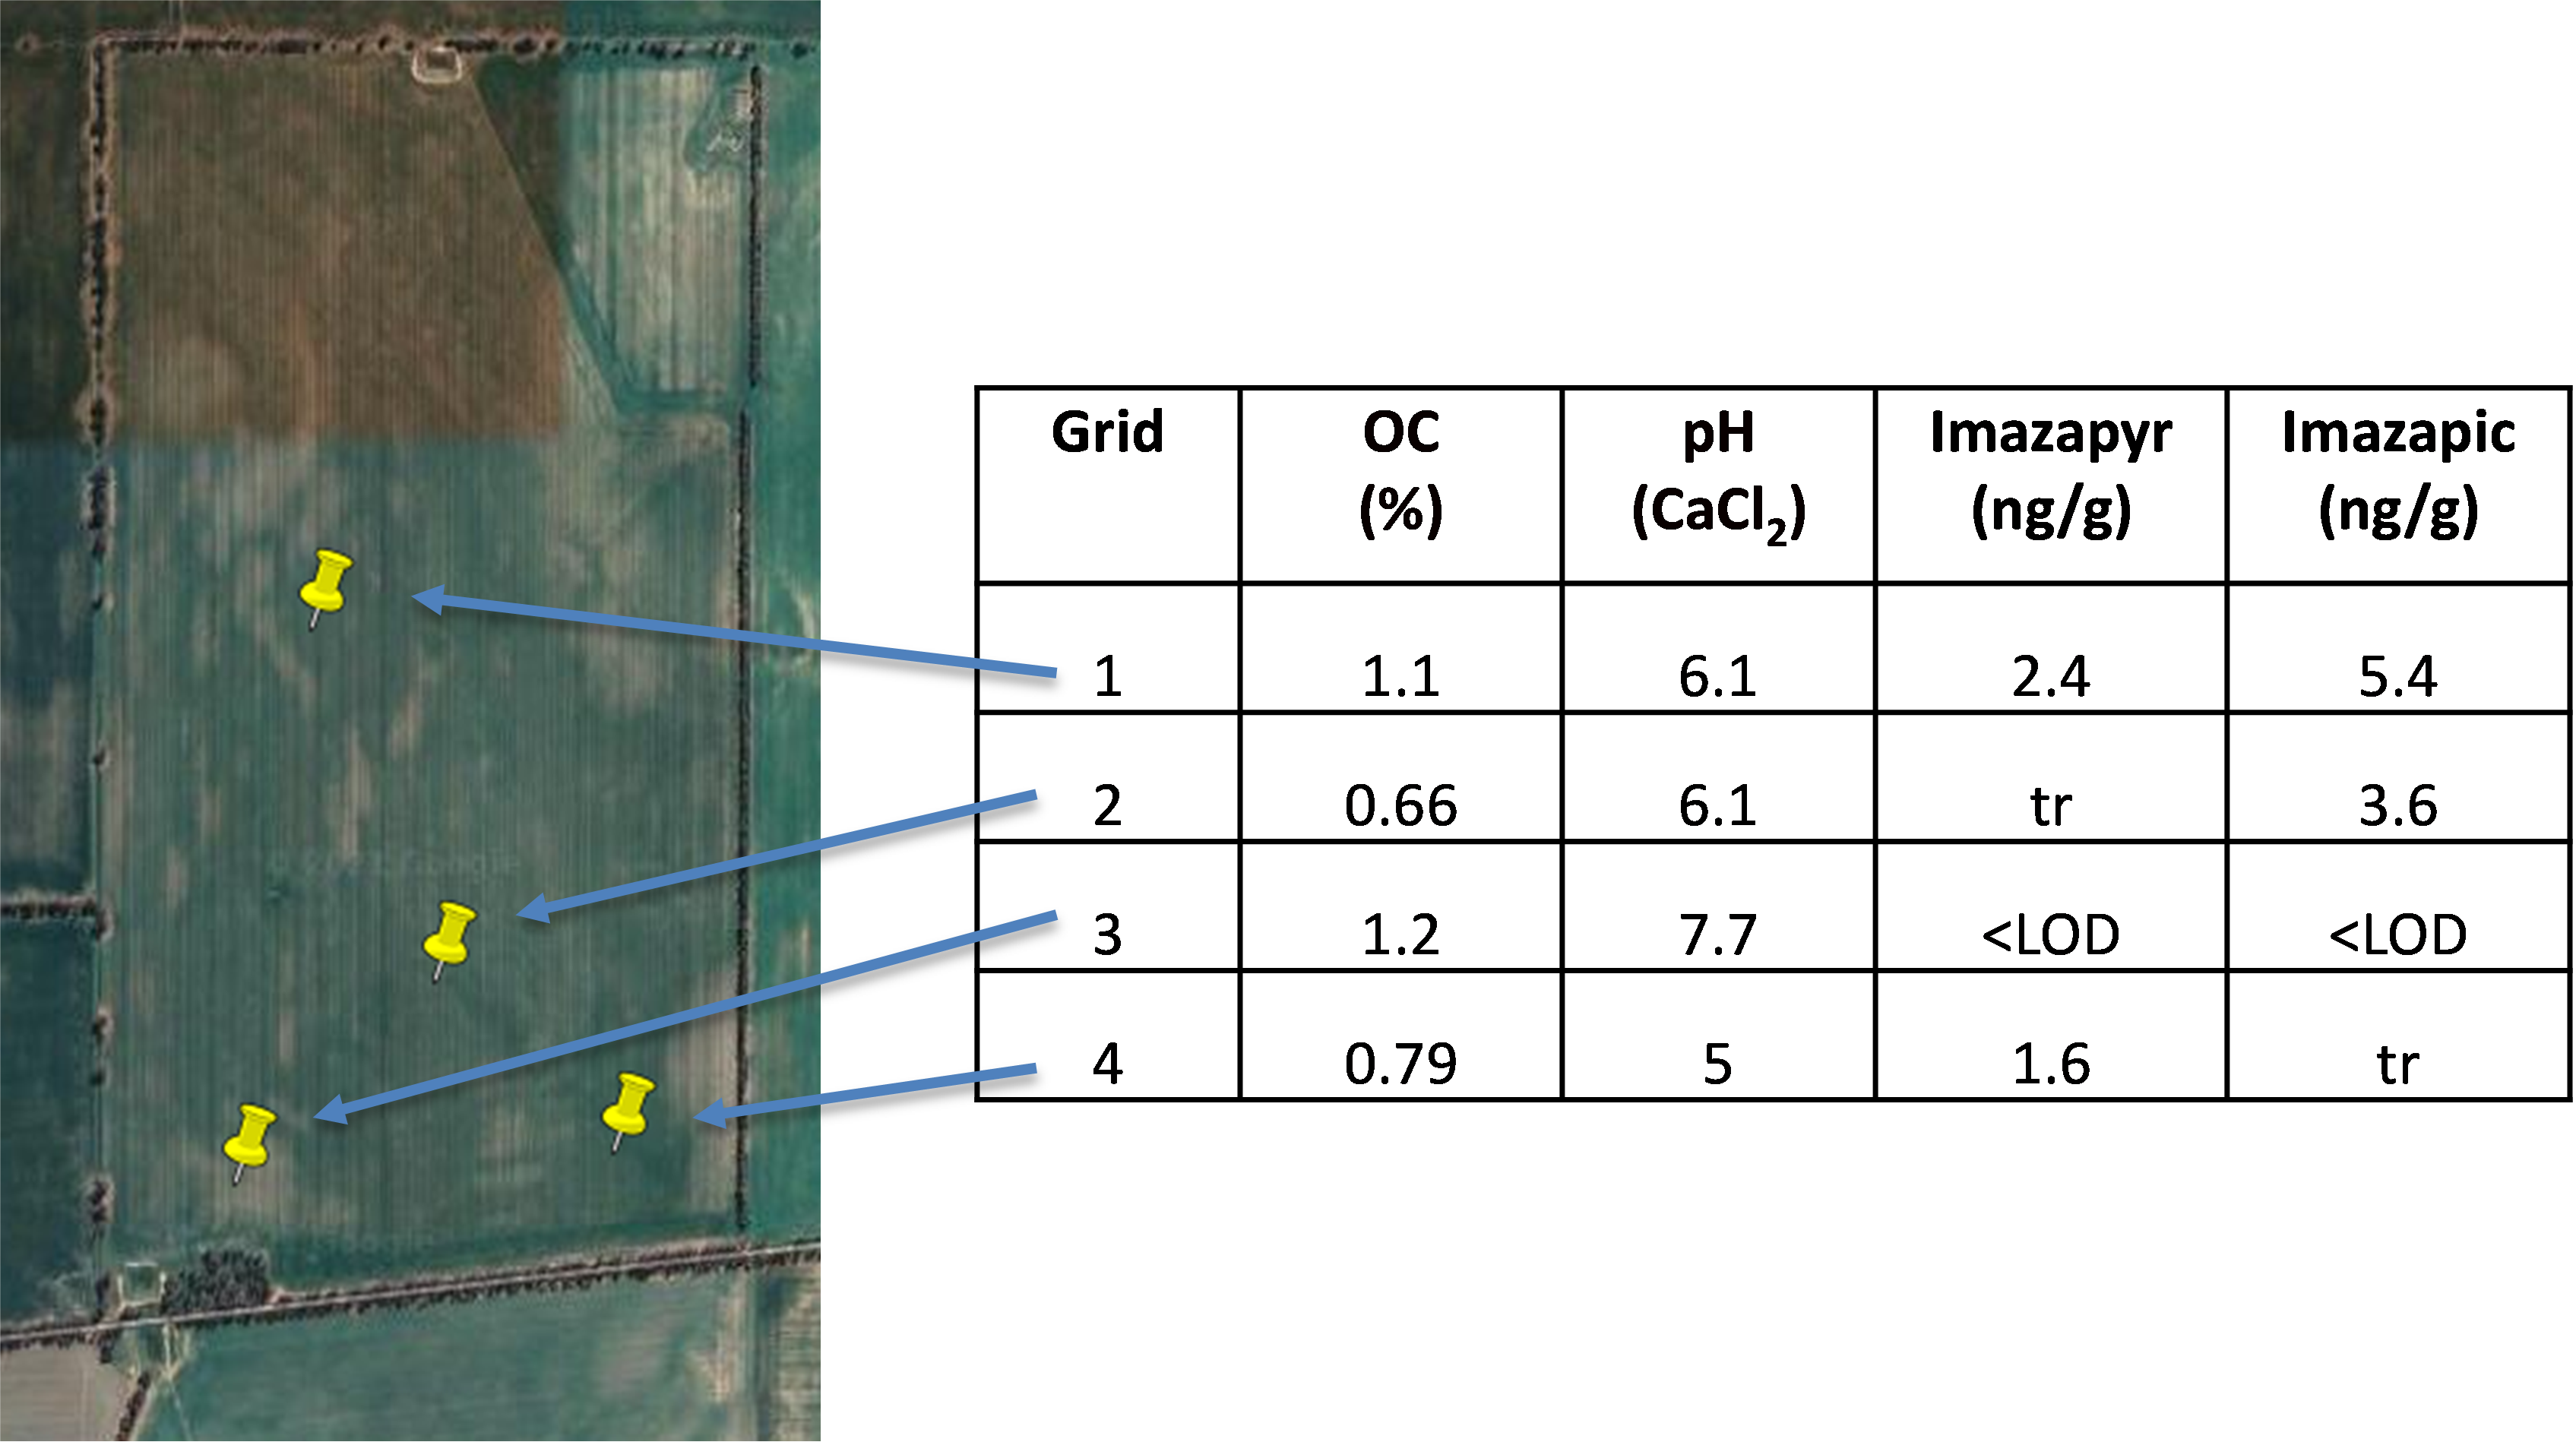
Determining where to take soil samples, and how many samples should be taken, is a challenge for all soil properties, not just herbicide residues. However, the high cost of herbicide residue analysis, which can exceed $100-400 per sample, increases the need for a targeted sampling strategy to give the required information. Previous work has shown that herbicide residue concentrations at points across a single paddock often vary by a factor of three and sometimes vary by more than an order of magnitude (see Figure 1 for an example). This is because of differences in soil texture, organic matter, pH, physical properties and slope which influence herbicide breakdown and leaching or lateral movement through the soil.

Figure 1. Soil organic C (%), pH and herbicide residues in soil samples from 0-10cm depth taken across a paddock in the Victorian Mallee prior to sowing, April 2021. Each sample point was a composite of 3 subsamples. LOD = limit of detection (0.5ng/g); tr = trace levels detected (0.5-1.0ng/g).
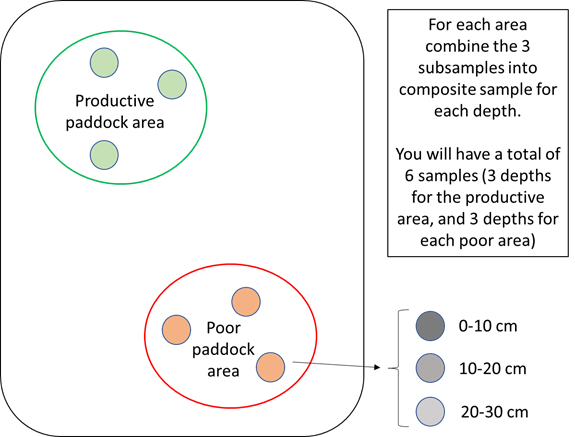
Therefore, it is recommended that sampling be conducted at a minimum of two locations within a paddock. For example, one sample could be taken from an area known to display higher productivity and one from an area known to have lower productivity; or within a dune-swale system, samples could be from dune, swale and seepage areas. Each sample submission to the laboratory should be a composite of at least three subsamples from within the area of interest (Figure 2). Sampling depth should also be considered. Research to date has shown that samples taken from 0-10cm will normally have the highest herbicide concentration. We would currently recommend that samples be taken from three depths: 0-10cm, 10-20cm and 20-30cm. However, leaching to depth may also occur under some circumstances, and if residues at depth are of interest (for example, planning soil inversion to >30cm, sharp texture contrast in soil profile between 30-60cm), then sampling should be designed to target these soil profile sections.

Figure 2. Suggested minimum sampling scheme for measuring soil herbicide residues. Note: actual sampling scheme should be designed to answer questions of interest to grower/advisor, considering spatial and vertical variations in soil/landscape features.
Some additional considerations about where to sample could include location within the crop row or in the inter-row of the previous crop. The concentration may vary depending on which herbicide is of interest, and how it was applied. Some pre-emergence herbicides that are incorporated by sowing, for example trifluralin, may be more concentrated in the interrow of the previous crop, which may have implications if the subsequent crop is to be sown in this zone.
When to sample
The timing of sampling is important for decision making. Factors to consider include:
- The time between sampling and sowing, as residue concentrations may decline during this period, particularly if conditions are warm and wet.
- The turnaround time for sampling, despatch, laboratory analysis and reporting of results. Enough time between sampling and sowing is required to be able to receive results and make decisions about sowing. This may be between 3-6 weeks.
Sample handling
Once samples (about 500g) are taken, they should be refrigerated as quickly as possible and then frozen. This minimises changes to herbicide concentration through microbial breakdown. This is particularly important if soil is moist/wet during sampling. Samples should be couriered to the testing laboratory in an esky or styrofoam box with ice bricks to ensure samples are cool during transport.
Laboratory analysis
Several laboratories around Australia have the capability to analyse for herbicide residues in soil and plant tissue. NATA accreditation ensures that results are reported based on laboratory procedures that have been certified for accuracy and precision for particular tests. Because of the large number of herbicides in use and potential environmental matrices (for example, soil, grain, leaf, water), it is possible that tests for some herbicide-matrix combinations are not available in Australia. It is worth contacting the laboratory to enquire about some specifics of the testing, including:
- Cost and ability to analyse single herbicide actives; classes of herbicides (for example, all imidazolinone herbicides); or full multi-residue herbicide analysis (namely, many herbicides across multiple classes). Generally, growers/advisors should have knowledge of the paddock spray history for at least the last two years or have an idea about which herbicide residues are of interest based on previous experience, or physiological symptoms if a post-emergence leaf test is required. This information can be used to inform the laboratory about which herbicide tests are required. Most testing laboratories will have the capability to conduct multi-residue analysis (namely, many herbicides across multiple classes) but this may increase the cost.
- The limit of detection/quantification/reporting of the test. For soil or plants, results will usually be reported in units of mg of herbicide per kg soil/plant dry weight (mg/kg, which is equivalent to parts per million, or ppm). Note that 0.001mg/kg = 1µg/kg = 1ng/g. This is important because some laboratories may only report at levels ≥0.01mg/kg, which may be above the toxicity threshold. That is, the laboratory may report ‘below limit of reporting’ or ‘<LOR’, which does not necessarily mean the herbicide of interest is not present. Some herbicides, including sulfonylureas, imidazolinones and clopyralid, may be detrimental to certain crops at levels ≤0.001mg/kg.
- Method ‘recoveries’. Some herbicides bind more strongly to soil than others or can be conjugated and unavailable for direct extraction in plant tissues (for example, phenoxy herbicides). It is worth enquiring if the lab will conduct a routine recovery test for a batch of samples, where a known amount of the target herbicide is spiked into the soil and the % recovery reported. This will provide extra confidence that the result reported are a true reflection of the amount of herbicide in the sample.
Interpretation of results: Toxicity thresholds and bioavailability
Laboratories will generally report ‘total’ extractable herbicide in a sample. Probably the greatest challenge for growers and advisors is interpreting what this number means in terms of crop growth and yield. Unlike other soil characteristics and nutrition, there is much less publicly available information on herbicide toxicity thresholds. We have recently compiled a register of herbicide dose-response thresholds for major grain crop seedlings in Australia from peer-reviewed studies and toxicology databases, which is currently in review for publication. In addition, we have generated dose-response toxicity curves for several crops exposed to residues of imazapic, imazapyr, diuron, pyroxasulfone and clopyralid in different soil types. This data is currently being used to develop risk models and can be available for assessing potential risk after herbicide residue analysis.
Toxicity thresholds for soil-borne herbicide residues are regulated by the capacity of the soil to bind, or ‘tie-up’, the residues through a process known as sorption. The extent to which sorption can reduce the bioavailability of herbicide residues is influenced by the herbicide properties, soil properties, soil moisture and plant characteristics. For many herbicides, soil organic matter and clay content will be the major drivers that affect bioavailability, but for other herbicides, pH or soil mineralogy can be the major drivers (Table 1). Thus, when interpreting a laboratory herbicide analysis result, the client should attempt to compare the lab result against a toxicity threshold that was generated in a soil with similar characteristics (primarily soil organic C, pH and % clay) to the field soil that was analysed. Due to the lack of toxicity thresholds available, this will not always be possible. We are currently working on a tool that can help estimate soil-specific thresholds for certain herbicides based on the soil properties listed above or using mid-infrared spectroscopy.
Table 1: Imazapic sorption (Kd) and toxicity thresholds (ED20) for contrasting soil types with different chemical properties. Higher Kd indicate greater binding to soil. The ED20 is the concentration in soil which causes 20% reduction in seedling biomass.
Soil | pH CaCl2 | Organic Carbon (%) | CEC (cmol/kg) | Kd (L/kg) | ED20 (wheat) (ng/g) |
|---|---|---|---|---|---|
Sand | 6.6 | 0.01 | 1 | 0.01 | 11 |
Applethorpe | 6.1 | 0.6 | 4.1 | 0.17 | 22 |
Wellcamp | 7.8 | 1.5 | 72 | 0.5 | 26 |
Kingaroy | 5.1 | 1.8 | 18 | 2.19 | 74 |
Case-study: diagnosing the cause for poor seedling growth in early sown wheat, northern NSW
Background and methods
A number of growers in northern NSW experienced poor growth of early sown winter wheat seedlings in 2021, following chickpea crops in 2020. It was suspected that imazapic used for summer fallow weed control had carried over, despite adherence to label plant-back recommendations. At the case study site, imazapic had been applied at 45g/ha in Oct 2020, and winter wheat was sown in early April 2021 after 350-400mm of rain during this period. Composite soil and leaf tissue samples were taken from three areas of the paddock with healthy crop growth and three areas of the paddock with poor crop growth and analysed for imazapic and other herbicide residues. The soil was a grey vertosol, with pHCaCl2 = 7.5-7.8, OC = 0.5% and clay = 26-29%. Herbicide residues were measured in 5cm increments to 30cm. Results were compared against toxicity thresholds for wheat that had been generated for the Wellcamp soil (Table 1 above).
Results
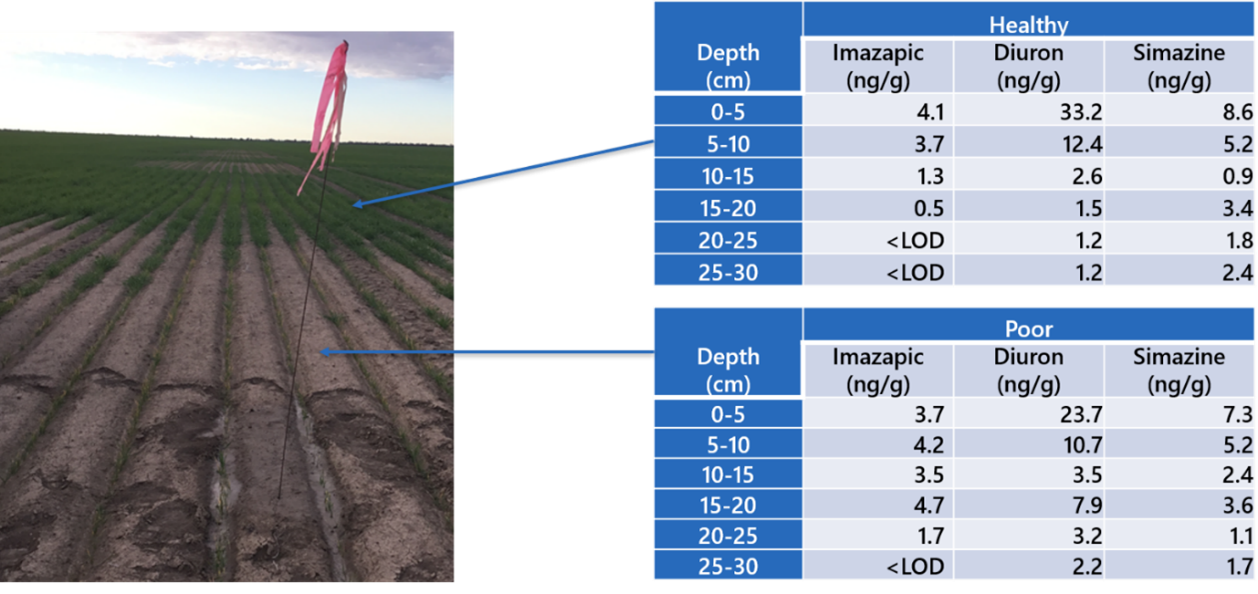
Concentrations of imazapic in the top 0-10cm soil profile from healthy and poor areas were similar, at around 4ng/g (Figure 3). However, imazapic residues in the 10-20cm profile remained at around 4ng/g in the poor soil but declined to an average of 1ng/g in the healthy soil. Nevertheless, the wheat toxicity thresholds for 20% seedling biomass reduction (ED20) in the similar Wellcamp soil type was 26ng/g, suggesting imazapic per se was not the sole cause for poor growth. Diuron and simazine residues were also found in both healthy and poor areas at similar levels down the profile. A project-generated ED20 value for wheat exposed to soil-borne diuron in the Wellcamp soil was estimated to be 210ng/g, suggesting diuron was also not a primary cause for poor growth. Threshold values for s-triazines have not been a target of our current projects, but two published thresholds for wheat exposed to simazine in a similar alkaline clay soil type were available, with estimated ED50 values of 10-20ng/g (Kulshrestha et al., 1982). This suggests that simazine may be responsible, at least in part, for the poor wheat growth observed.

Figure 3. Photograph of the field showing area of poor and healthy wheat seedling growth (left) and associated herbicide residue concentrations in the soil profiles (right).
Follow-up analysis of wheat leaf tissue confirmed the presence of imazapic and simazine, but not diuron, in wheat plants from both healthy and poor areas (Table 2). Notably, higher concentrations of imazapic and simazine were found in plants taken from the poor area, and simazine was found at significantly higher concentrations than imazapic. This provides further evidence that simazine, rather than imazapic, was a more likely cause for poor wheat growth. The possibility of both actives, and other soil constraints, acting together to cause poor growth cannot be ruled out.
Table 2: Concentration of herbicide residues (ng/g) in wheat leaf tissue sampled from healthy and poor areas of the affected paddock. LOD = limit of detection (1ng/g).
Wheat plant | Imazapic | Diuron | Simazine |
|---|---|---|---|
Healthy | 3.7 | <LOD | 135 |
Poor | 7.4 | <LOD | 610 |
Conclusions
Soil and leaf tissue testing for herbicide residues can provide information on plant-back risks and help diagnose the cause for poor crop performance. Careful consideration is required into where and when samples are taken; which herbicides should be analysed and to what levels of detection; and how results are interpreted. Results should be preferably compared to crop toxicity thresholds developed for the crop species and soil of interest; however, this is seldom possible given the scarcity of publicly available thresholds. This project is continuing to develop these thresholds and tools for assessing bioavailability, with information on priority herbicides (imazapic, imazapyr, diuron, clopyralid, and pyroxasulfone) likely available by the end of 2022.
Acknowledgements
The research undertaken as part of this project is made possible by the significant contributions of growers through both trial cooperation and the support of the GRDC, the author would like to thank them for their continued support. This work has also been supported by the Cooperative Research Centre for High Performance Soils whose activities are funded by the Australian Government's Cooperative Research Centre Program, through project 4.2.001. Thanks to Lee Kearney, Scott Petty, Kelvin Spann and Jesse Muller for technical support.
References
Kulshrestha G, Yaduraju NT, Mani VS (1982) The relative toxicity of the S‐triazine herbicides ‐ trazine and simazine to crops. Journal of Environmental Science and Health Part B 17(4), 341-354.
Herbicide residues in soil – what is the scale and significance?
Residue Watch: How do I know if herbicide residues are breaking down before sowing
Contact details
Michael Rose
NSW DPI
1243 Bruxner Hwy, Wollongbar NSW 2477
(02) 6626 1117
mick.rose@dpi.nsw.gov.au
@Mick_T_Rose
