Fusarium crown rot in central and northern cropping systems: it’s all a numbers game
Author: Steven Simpfendorfer (NSW DPI) | Date: 14 Feb 2024
Take home message
- Yield loss from Fusarium crown rot (FCR) is a function of the percentage of plants which get infected within a paddock
- The increased frequency of winter cereal crops within a rotation sequence elevated the probability of having much higher levels of FCR infection
- Rotation to non-host break crops such as canola and pulses does not fully eliminate FCR in all paddocks but considerably reduces the probability of having high levels of infection
- A two-year break may be required in paddocks with high FCR inoculum levels
- Rotation history remains a good indicator of likely FCR risk within individual paddocks but there is still some variability in actual levels of infection
- PreDicta®B or cereal stubble testing are useful tools to further refine crop rotation and other integrated disease management decisions to limit losses from FCR.
Background
Fusarium crown rot (FCR), caused predominantly by the fungus Fusarium pseudograminearum (Fp), remains a major constraint to winter cereal production across the central and northern grain production region. The causal fungus is stubble-borne with inoculum surviving between seasons as mycelium (cottony-growth) inside retained winter cereal stubble and/or grass weed residues. Crop rotation to non-host break crops such as canola and pulses (e.g. chickpea, lupin or faba bean) or summer crops (e.g. cotton, sorghum or mung bean) remain a key management strategy for FCR. However, the process revolves around decomposition of Fp infected cereal stubble during these break crop and fallow phases which is in turn dependent on moisture availability and time. Consequently, the season in which a break crop is grown influences its effectiveness at facilitating decomposition of cereal stubble and reducing FCR inoculum levels. Conversely, recent research has highlighted when relative humidity is >92.5% that Fp can colonise vertically up retained standing cereal stubble in a process termed ‘saprotrophic growth’. At 100% relative humidity this saprotrophic growth can occur at a maximum rate of 1 cm per day (Petronaitis et al., 2020). The FCR fungus can therefore saprotrophically grow to the cut height of the cereal stubble under prolonged or accumulated periods of rainfall, effectively increasing inoculum loads. This can then result in FCR infected cereal stubble being spread out the back of the header during the harvest of lower stature break crops such as chickpeas, increasing FCR risk for the next cereal crop (Petronaitis et al., 2022).
This dynamic between cereal stubble decomposition and saprotrophic growth appears to complicate the management of FCR within farming systems but what are real grower paddocks across the region telling us?
What did we do?
Under a co-investment with GRDC, NSWDPI has been providing a ‘free’ cereal stubble testing service to growers and advisors over the past two seasons. These samples are collected either during late grain filling or post-harvest from individual paddocks across central NSW, northern NSW and southern Qld, along with background information including the previous two crops within the rotation. Winter cereal stubble samples (bread wheat, durum, barley or oats) are trimmed and plated on laboratory media to determine the incidence of FCR based on distinctive growth of Fp in culture. Infection levels are then categorised as being either low (≤10% FCR), medium (11–25% FCR), high (26–50% FCR) or very high (≥51% FCR). This data provides an unbiased snapshot of FCR infection levels in winter cereal crops across the region under varying crop rotations over the last two seasons. But why is the level of FCR infection so important? It is simple, yield loss only occurs in cereal plants infected with FCR, with the actual extent of yield loss strongly dependent on the extent of moisture and temperature stress during grain filling. Growers may not have much influence over seasonal conditions and stress during this critical period, but they can influence the percentage of plants infected with FCR. Reduce FCR infection levels and you reduce the risk of yield loss by that same level. As a rough rule of thumb, 100% FCR infection can result in 80% yield loss in durum wheat, 60% in bread wheat and 40% in barley if prolonged hot and dry conditions occur during grain filling. Granted that these are worst case scenario values from replicated and inoculated field trials across seasons in this region, but even halving FCR infection levels to 50% reduces potential yield loss to 40% in durum, 30% in bread wheat and 20% in barley if the season turns to #%^&.
What did we find?
Seasonal effects
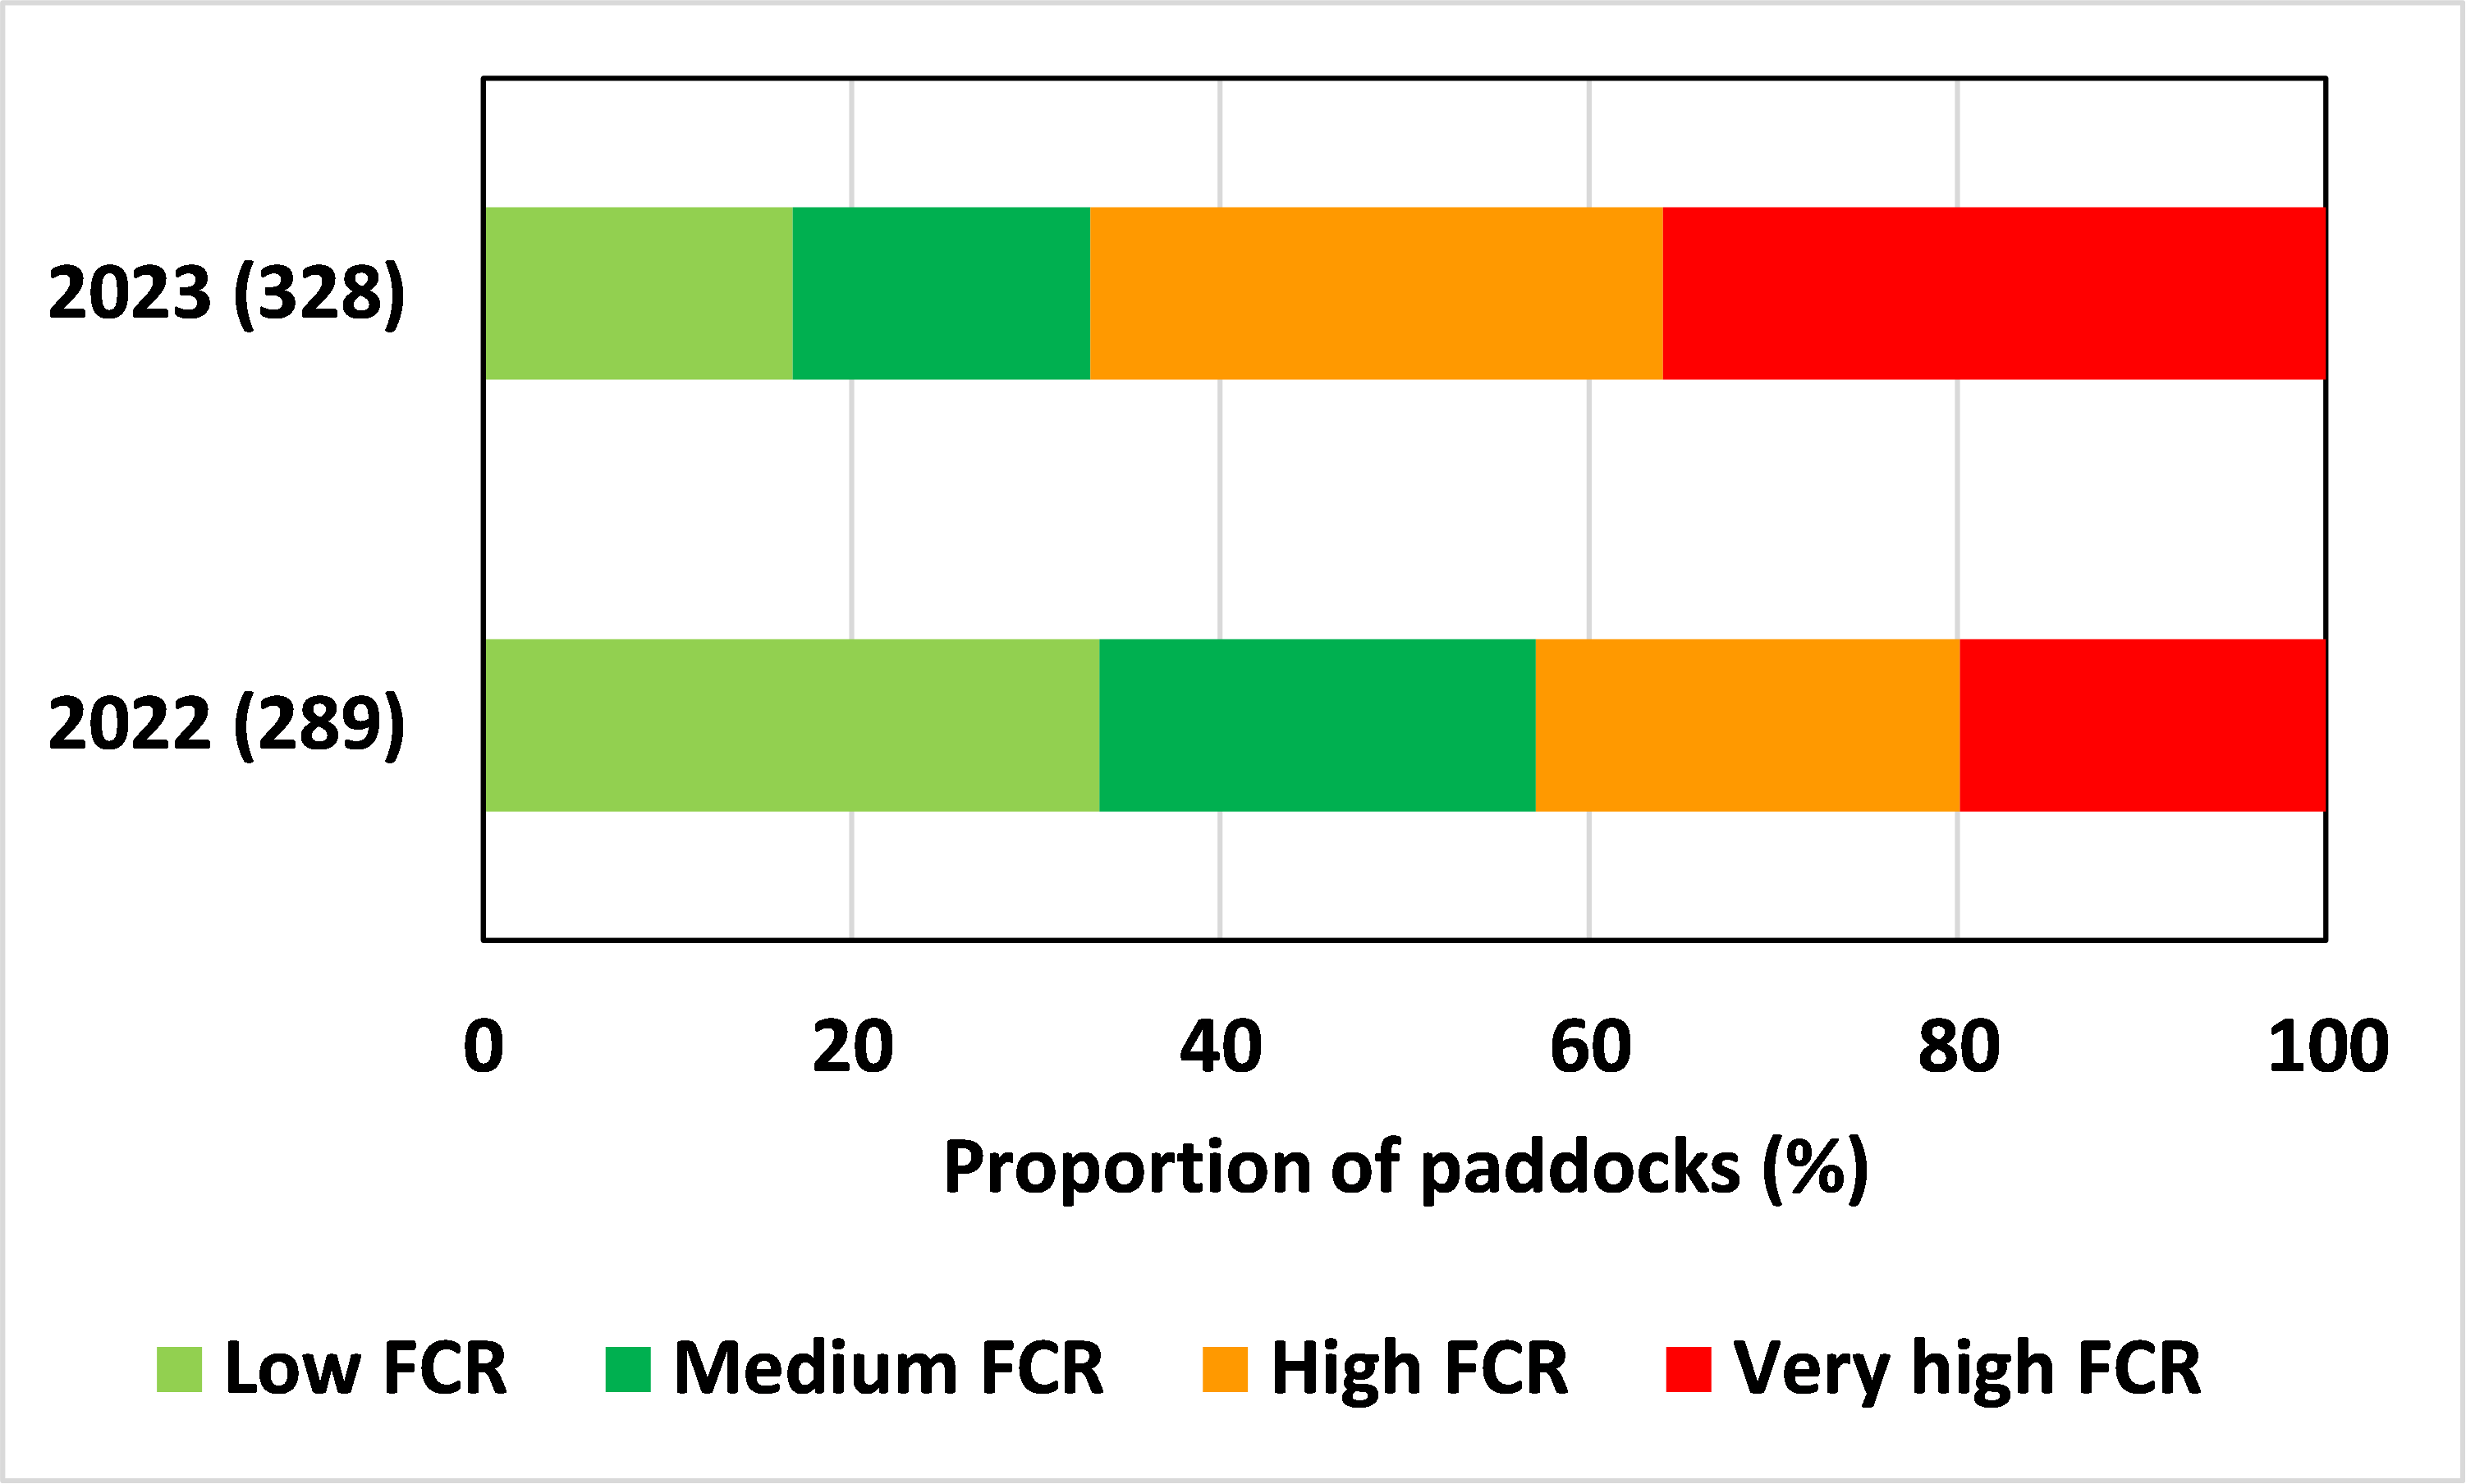
In total, 617 winter cereal stubble samples were processed from the 2022 and 2023 harvest which consisted of 507 bread wheat, 59 barley and 51 durum wheat crops (data not shown). There were 289 cereal crops sampled in 2022 and 328 in 2023 (Figure 1). The levels of FCR infection have risen within the central and northern cropping region from 2022 to 2023 with the proportion of paddocks with very high levels (≥51% FCR) rising from 20% to 36%. Over the same period the proportion of paddocks with high levels of infection (26–50% FCR) have also risen from 23% in 2022 up to 31% in 2023 (Figure 1).

Figure 1. Proportion of winter cereal paddocks with varying levels of Fusarium crown rot (FCR) infection in 2022 and 2023.
Number in brackets (Y-axis) is the number of paddocks sampled in each year.
Low = ≤10% FCR, medium = 11–25% FCR, high = 26–50% FCR, very high = ≥51% FCR
FCR inoculum levels are a function of the percentage of plants infected and the quantity of stubble produced within a season. FCR infection is favoured by wet conditions which also generally increase biomass (i.e. stubble) production and yield of cereal crops. Consequently, larger inputs of FCR inoculum occur in wetter seasons such as 2021 and 2022 even though these conditions may not favour expression of FCR as whiteheads and yield loss from this disease. This data supports random crop disease surveys, conducted by NSWDPI with co-investment from GRDC, which have been showing a progressive build-up of FCR inoculum levels in this region from 2020 onwards. Milder temperatures and frequent rainfall during grain filling in 2021 and 2022 reduced FCR expression in these seasons. This was not the situation in 2023, with a return to warmer and drier conditions during spring which unfortunately also coincided with elevated FCR infection levels within central and northern cropping systems (Figure 1).
Sub-region levels of FCR
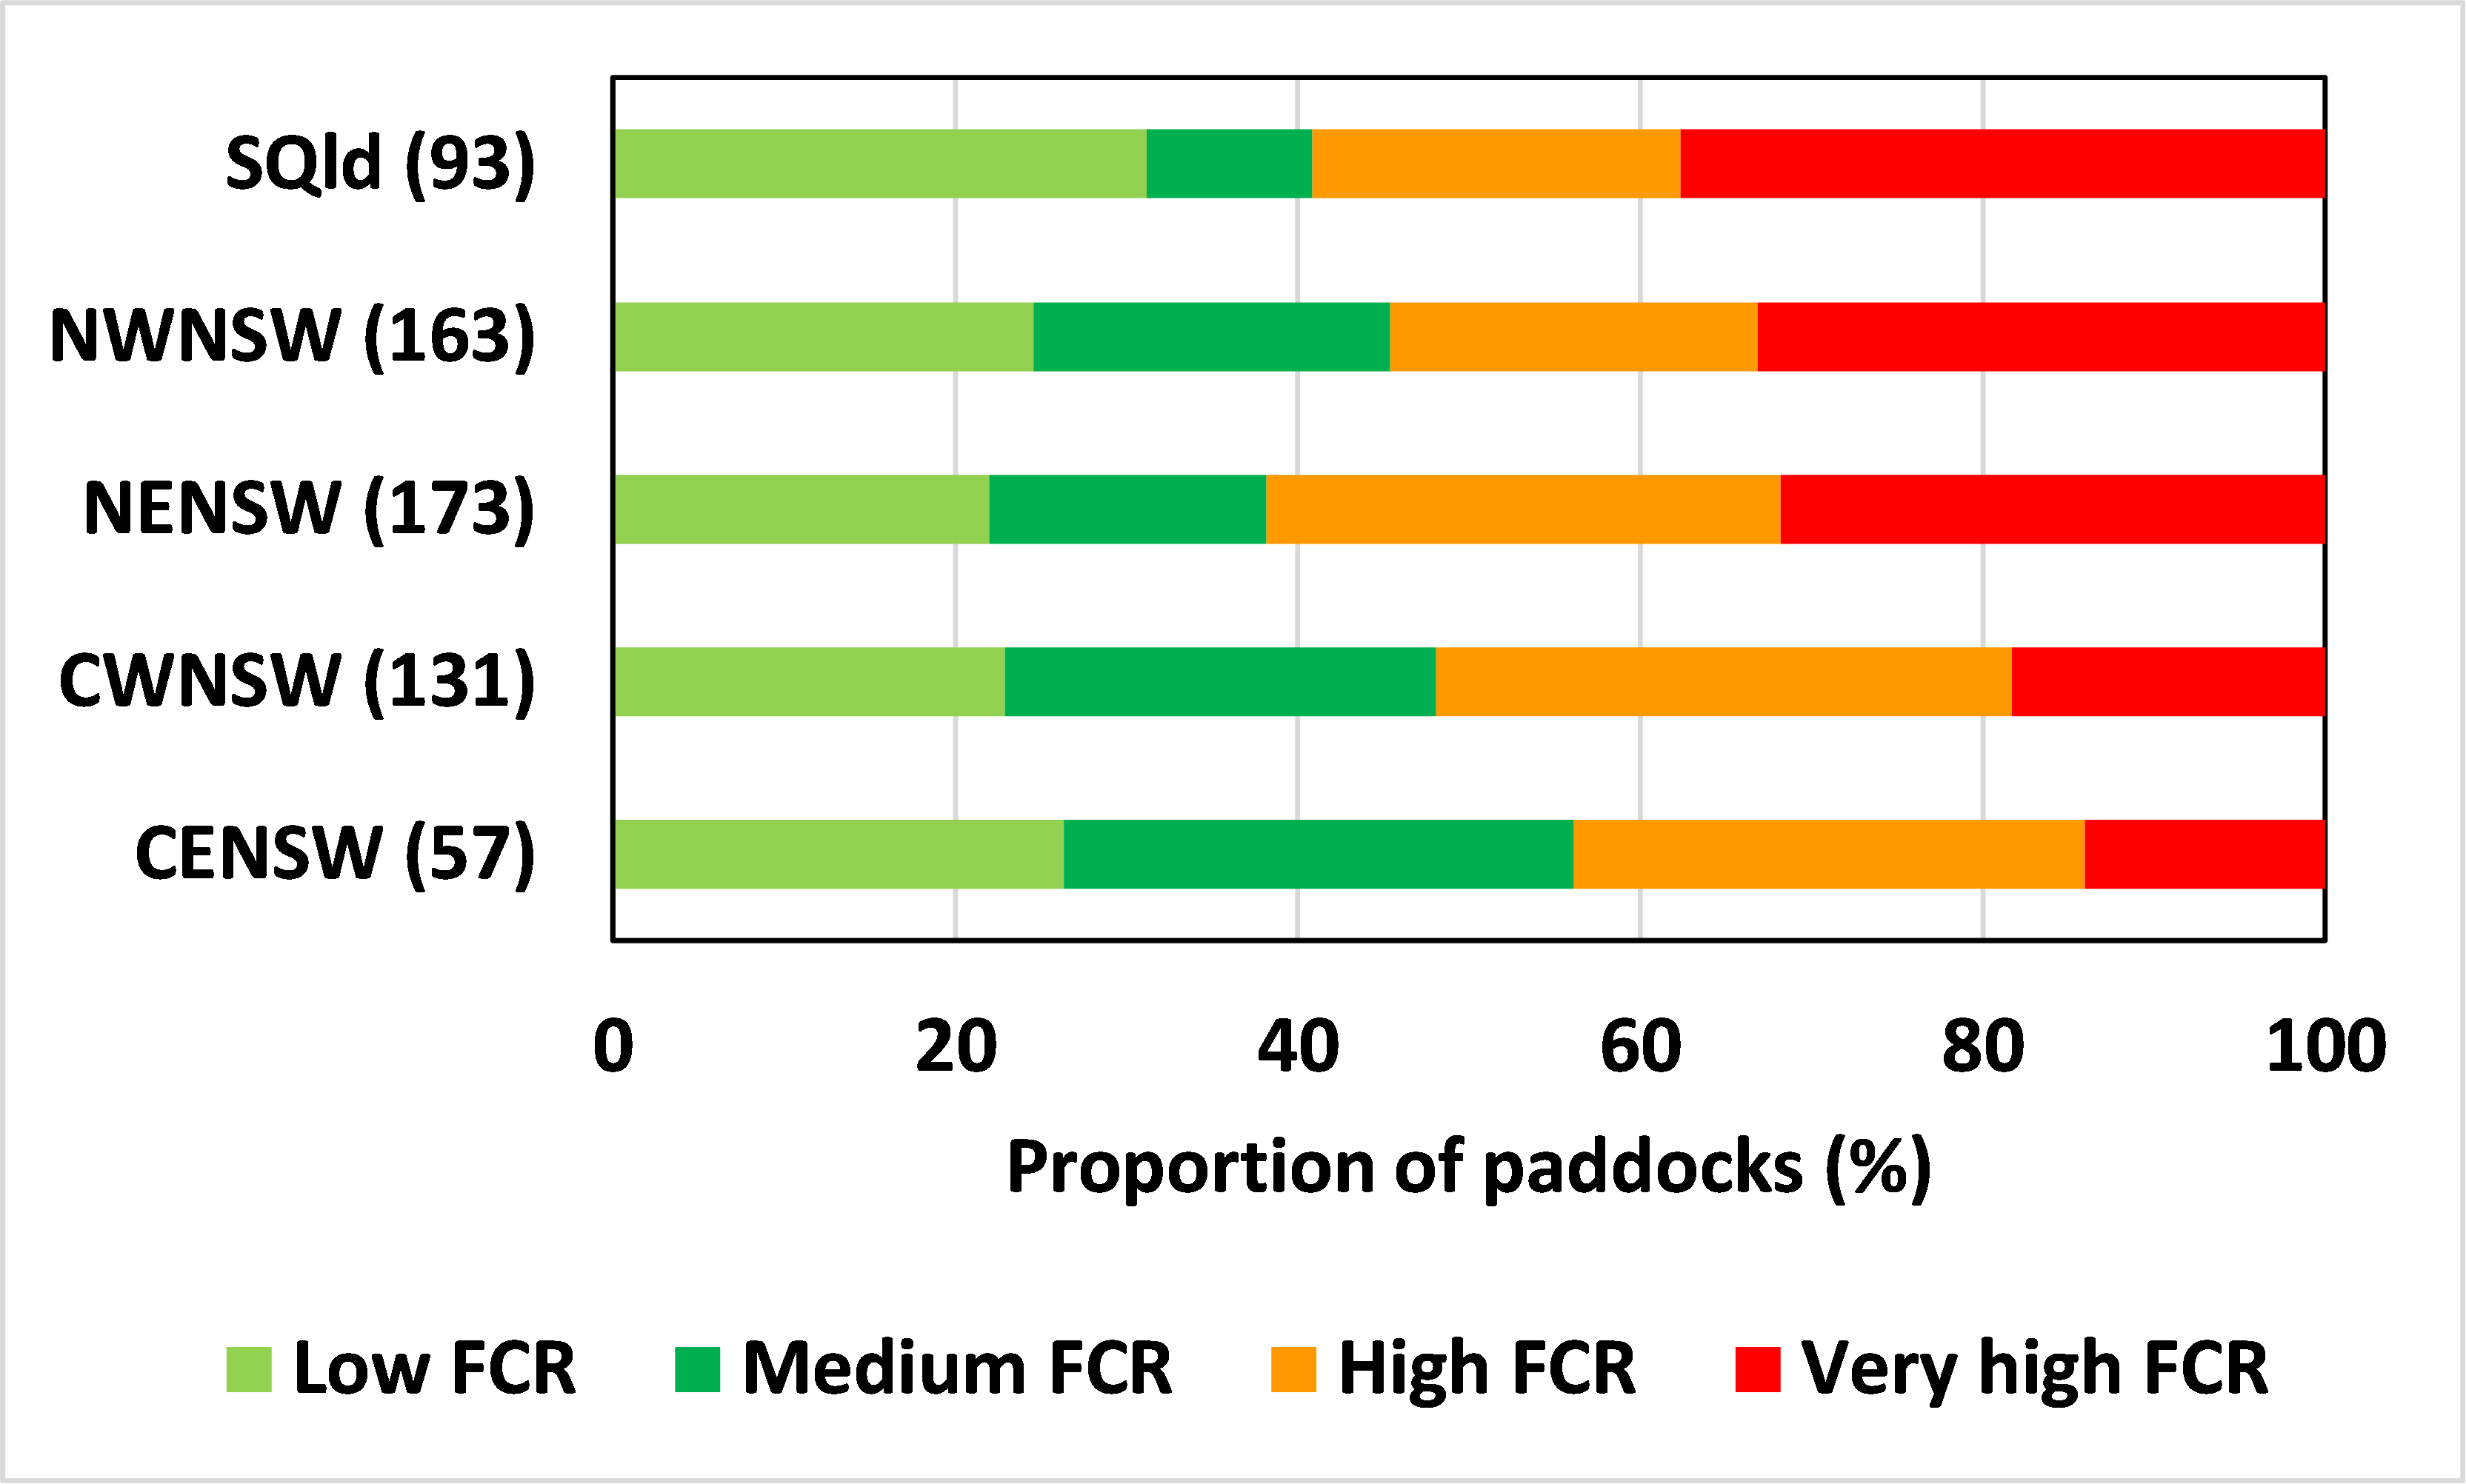
In total, 93 samples were from southern Qld, 163 from north-west NSW, 173 from north-east NSW, 131 from central-west NSW and 57 from central-east NSW (Figure 2). FCR infection levels in the last two cereal crops have been highest in southern Qld (SQld), north-west NSW (NWNSW) and north-east NSW (NENSW) with the proportion of paddocks with very high levels (≥51% FCR) at 38%, 33% and 32%, respectively. The proportion of paddocks in this highest category of FCR infection level was lower at 18% in central-west NSW (CWNSW) and 14% in central-east NSW (CENSW; Figure 2). However, all regions had relatively high FCR levels (≥26% FCR in high or very high categories) ranging from 44% of paddocks in CENSW up to 62% in NENSW (Figure 2).

Figure 2. Proportion of winter cereal paddocks in 2022 and 2023 with varying levels of Fusarium crown rot (FCR) infection across southern Qld, central NSW and northern NSW.
Number in brackets (Y-axis) is the number of paddocks sampled from each sub-region.
Low = ≤10% FCR, medium = 11–25% FCR, high = 26–50% FCR, very high = ≥51% FCR
Influence of a single break – what do the numbers say?
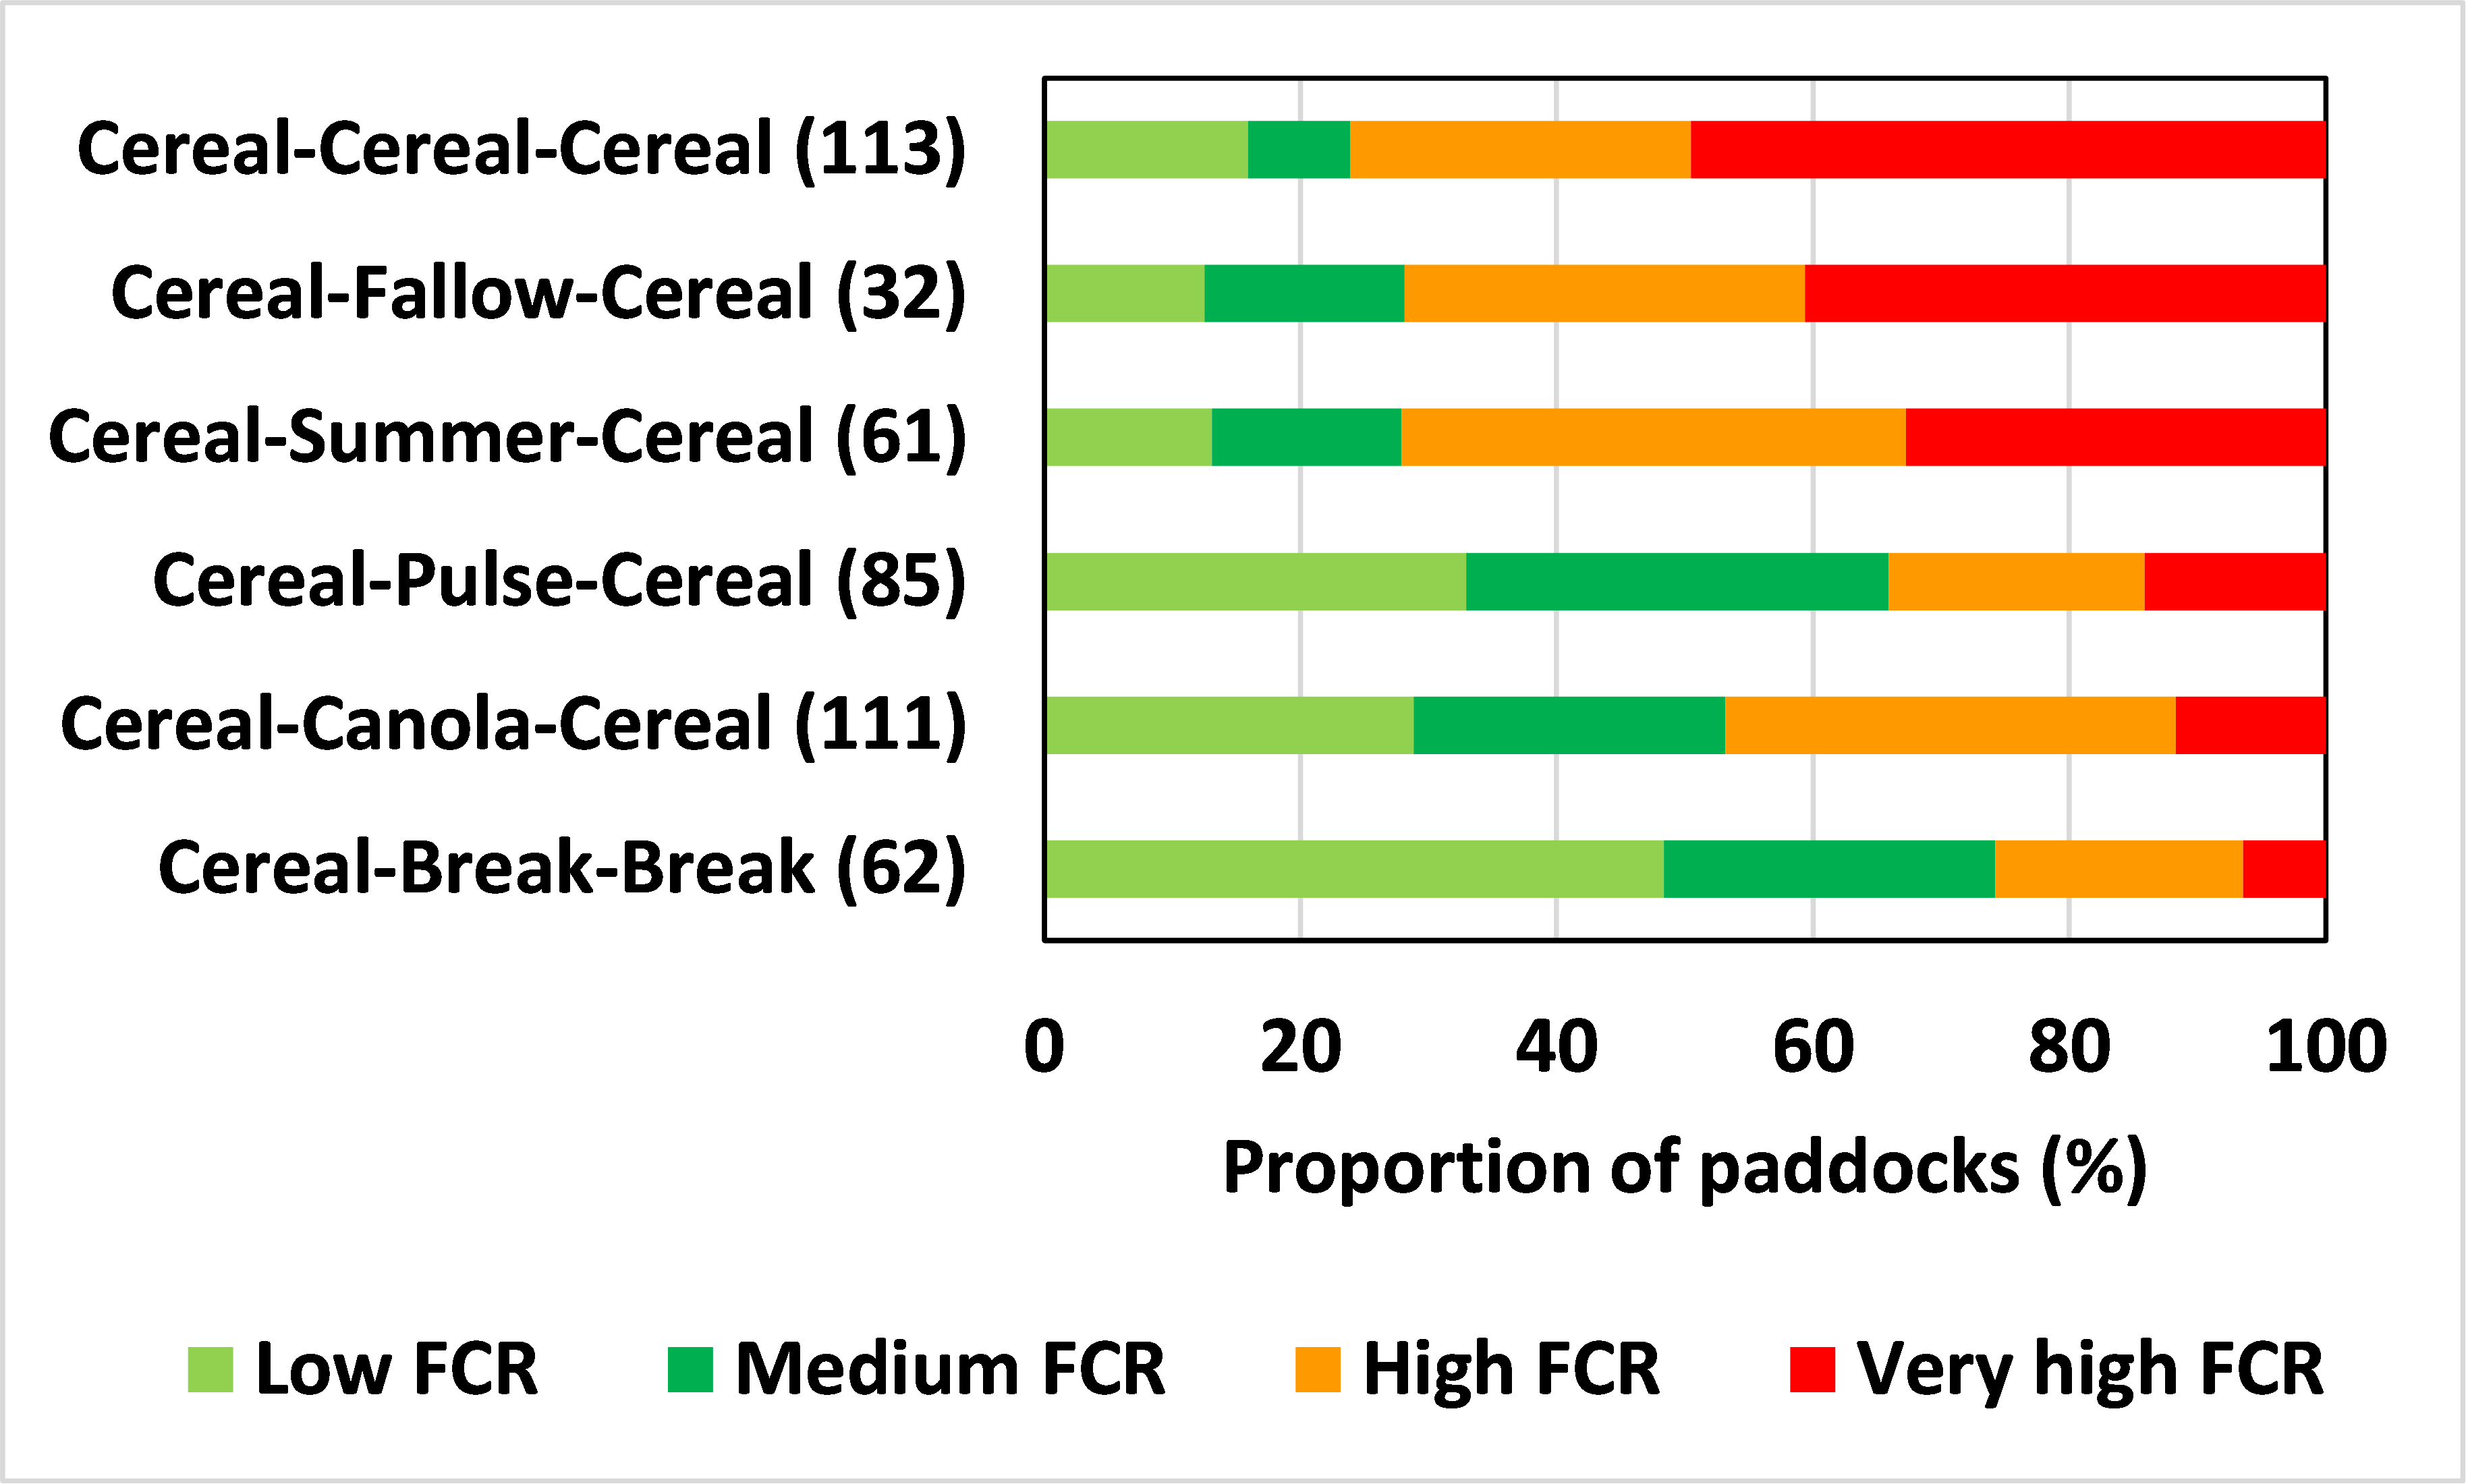
Adopt a cereal-cereal-cereal ‘rotation’ and there is a 50% chance that you will have very high (≥51%) FCR infection (Figure 3). If the preceding crop was a summer break crop or fallow then this risk of very high FCR infection in the 2022 or 2023 winter cereal crop was reduced to 41% and 33%, respectively. If the preceding crop was a winter pulse or canola break crop then this risk of very high FCR in the 2022 or 2023 cereal crop was reduced further to 14% and 12%, respectively (Figure 3).
In terms of pulse break crops, faba bean (14% high FCR and 7% very high FCR in 29 paddocks) was more effective than chickpea (22% high FCR and 20% very high FCR in 51 paddocks; data not shown). In terms of summer break crops, cotton (22% high FCR and 39% very high FCR in 18 paddocks) was potentially slightly better than sorghum (40% high FCR and 34% very high FCR in 35 paddocks; data not shown).

Figure 3. Proportion of winter cereal paddocks in 2022 and 2023 with varying levels of Fusarium crown rot (FCR) infection under different crop rotations.
Number in brackets (Y-axis) is the number of paddocks sampled from each rotation sequence.
Low = ≤10% FCR, medium = 11–25% FCR, high = 26–50% FCR, very high = ≥51% FCR
There are a number of potential variables such as FCR infection levels in cereal crops two years ago, stubble management (e.g. burning or cultivation), seed source (e.g. Fusarium grain infection from 2022 FHB epidemic), grass weed management, inter-row sowing, harvest height) which could also underly this data and introduce variability. Clearly non-host crop or fallow periods reduce the probability of higher FCR infection levels and consequently yield loss from this disease so playing the rotation numbers still works. However, a one-year break may not be sufficient under higher FCR infection levels. A two-year break further reduced the probability of high and very high FCR infection levels in 2022 or 2023 cereal crops which dropped to 19% and 6%, respectively (Figure 3).
Can I get away with a break only once in three years?
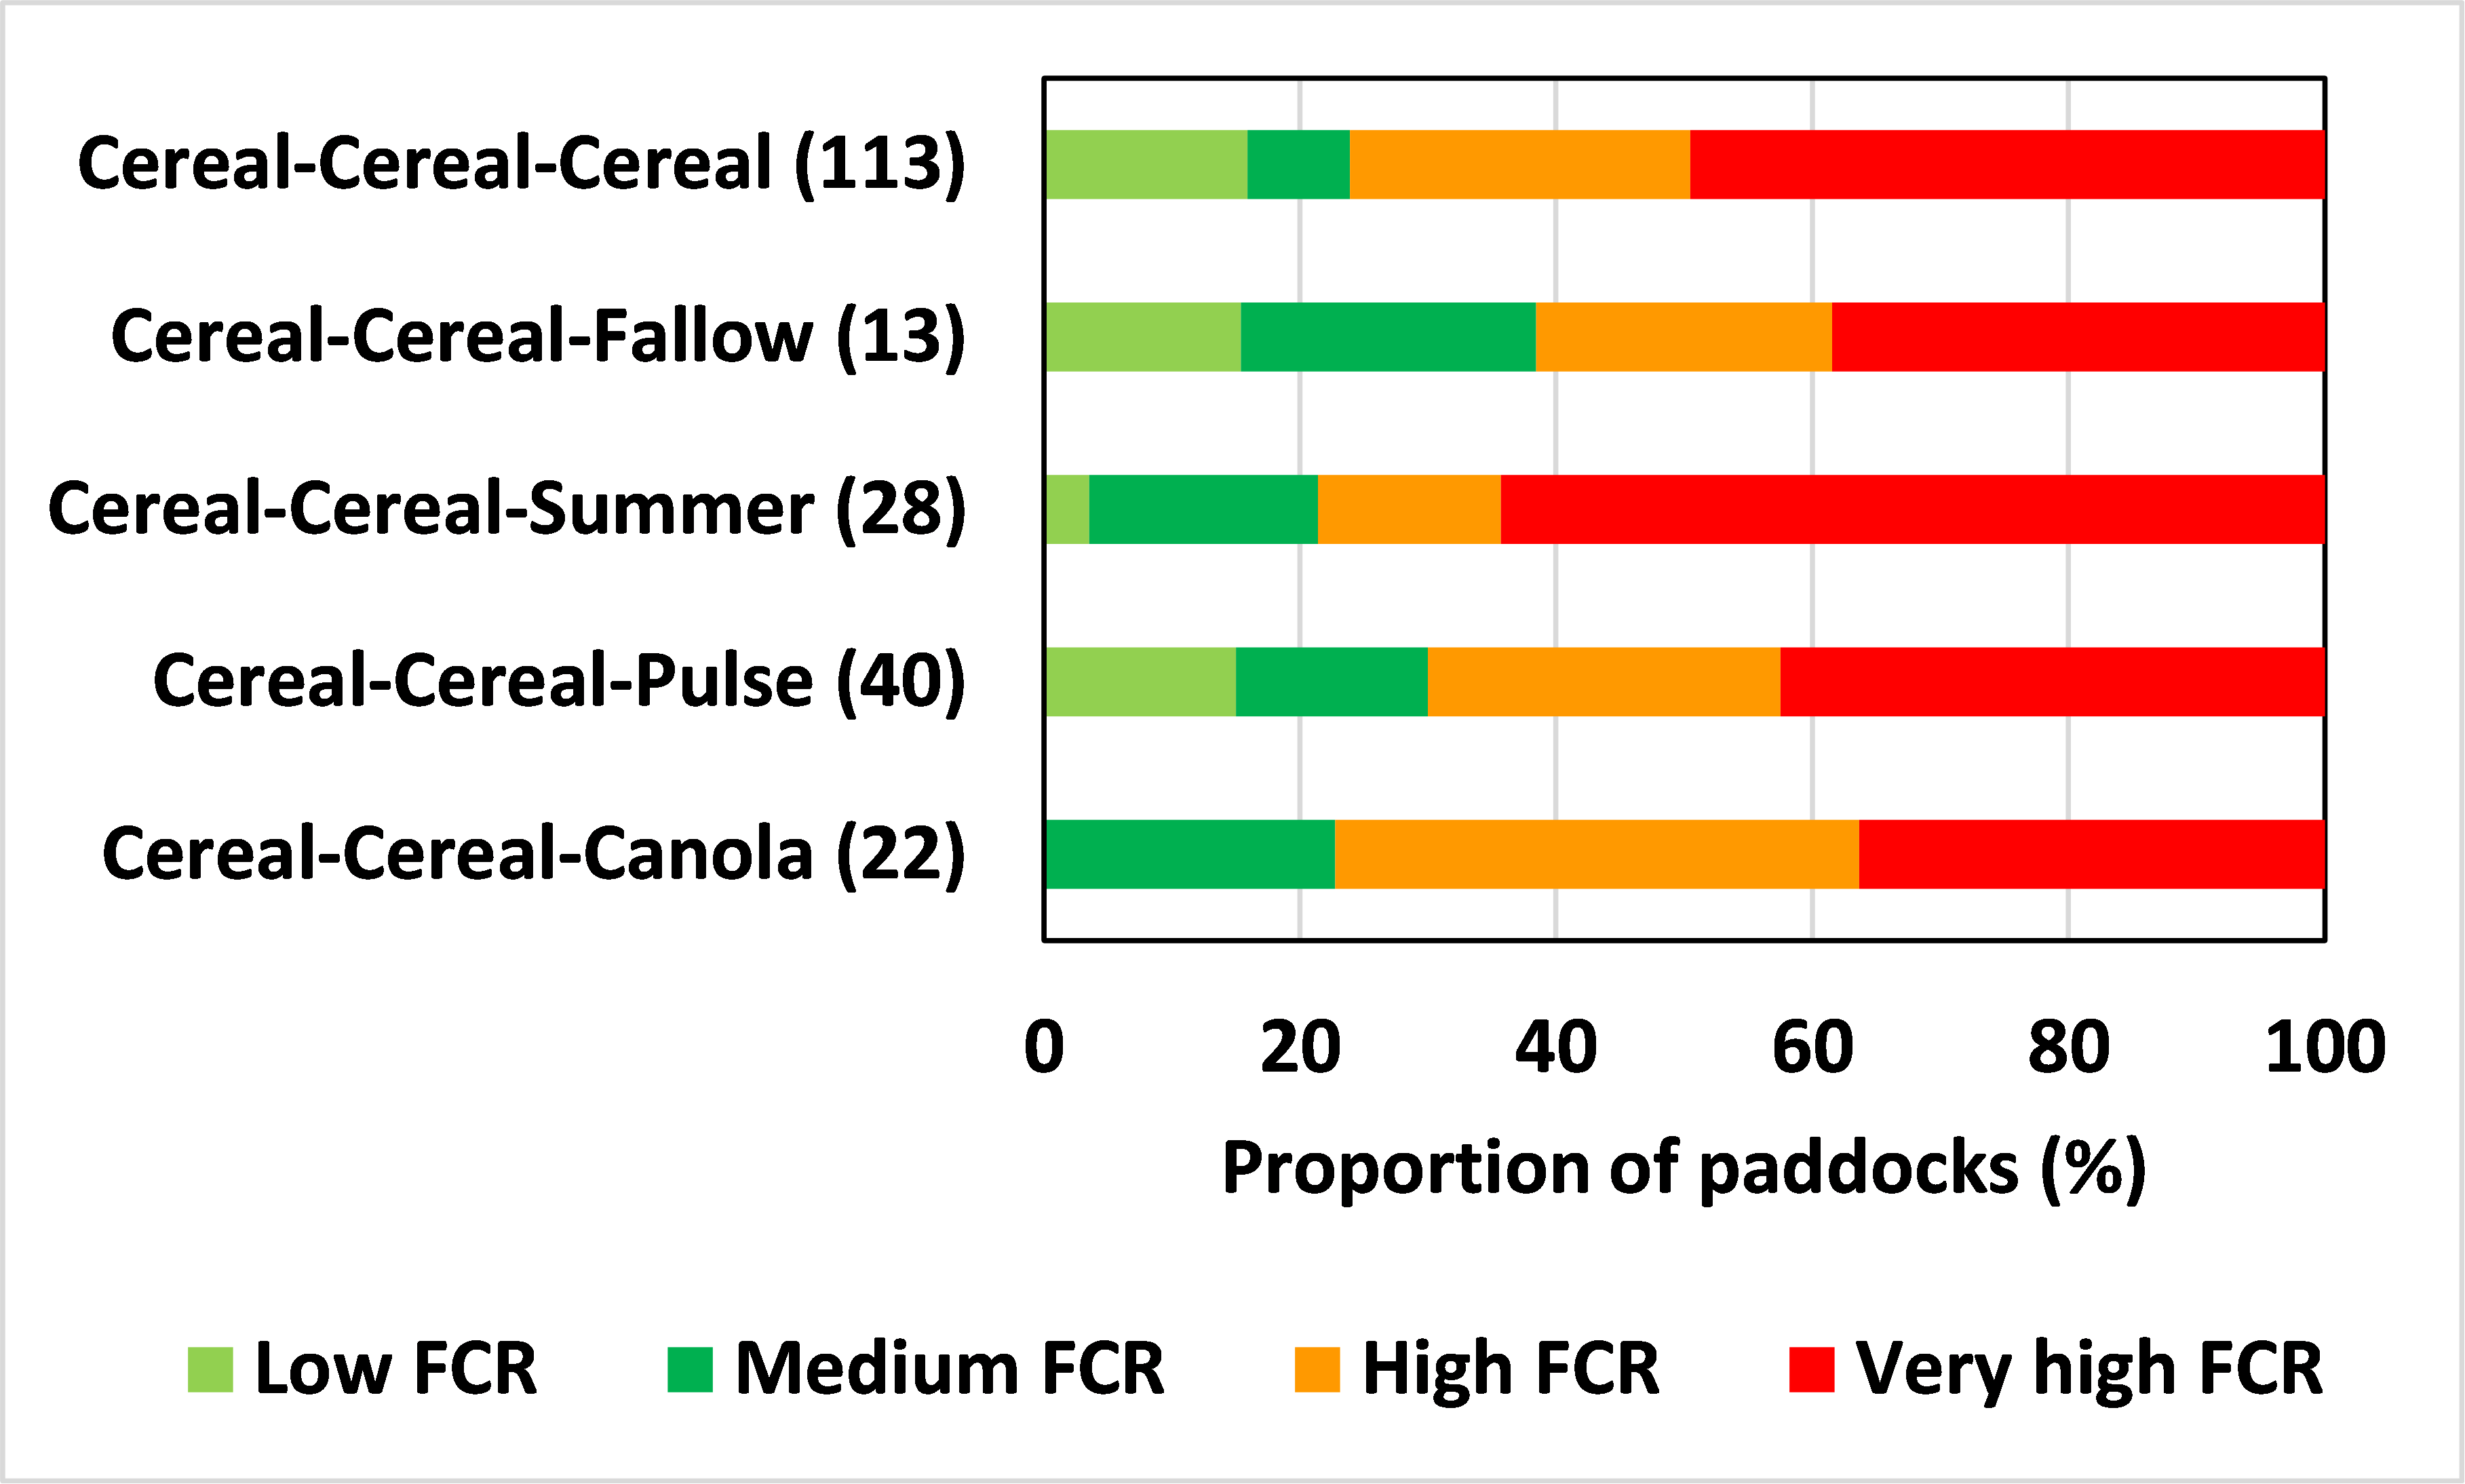
Alright, let’s try presenting differently and having a ‘glass half full’ approach. Assume low and medium FCR infection levels result in <25% whiteheads in a season conducive to disease expression, so does not trigger the ‘I told you not to sow another cereal crop in that paddock’ argument with your agronomist. In a three-year consecutive cereal situation, there is a 24% probability of this happening. This increased to 38% if the paddock was in fallow two years ago and 30% if it was a pulse crop two years ago. However, the likelihood of this outcome reduced to 23% if it was canola and 21% if it was a summer crop two years ago (Figure 4). Some may like these probabilities and continue to roll the dice whilst others may be swayed more by the probabilities around the second wheat crop having high or very high FCR infection levels (Figure 4).

Figure 4. Proportion of winter cereal paddocks in 2022/23 with varying levels of Fusarium crown rot (FCR) infection under different crop rotations.
Number in brackets (Y-axis) is the number of paddocks sampled from each rotation sequence.
Low = ≤10% FCR, medium = 11–25% FCR, high = 26–50% FCR, very high = ≥51% FCR
Conclusions
Recent crop history within individual paddocks is a useful guide to the likely risk of FCR infection. However, not all paddocks and underlying crop management are the same so there is variability in the actual numbers, but the rotation sequence clearly drives the probability of having higher or lower levels of FCR infection. This further highlights the value of testing to establish actual FCR infection levels within a paddock using PreDicta®B or cereal stubble plating to further guide crop rotation and other integrated disease management decisions.
References and further resources
Petronaitis LT, Forknall C, Simpfendorfer S, Backhouse D (2020). Stubble Olympics: the cereal pathogen 10cm sprint - GRDC. GRDC Update paper
Petronaitis T, Forknall C, Simpfendorfer S, Flavel R, Backhouse D (2022). Harvest height implications for Fusarium crown rot management - GRDC. GRDC Update paper
Acknowledgements
The research undertaken as part of this project is made possible by the significant contributions of growers and their advisers through their support of the GRDC. The author would also like to acknowledge the ongoing support for northern pathology capacity by NSW DPI. This research would also not have been possible without the support of growers and advisors through submission of cereal stubble samples for testing and provision of background rotation data. Useful discussions with Glenn Shepherd (IMAG consulting) around data presentation are also appreciated so if you do not like the graphs blame Glenn.
Contact details
Steven Simpfendorfer
NSW DPI, 4 Marsden Park Rd, Tamworth, NSW 2340
Ph: 0439 581 672
Email: steven.simpfendorfer@dpi.nsw.gov.au
Twitter: @s_simpfendorfer or @NSWDPI_AGRONOMY
Date published
February 2024
® Registered trademark
GRDC Project Code: DPI2207-004RTX, DPI2207-002RTX,
Was this page helpful?
YOUR FEEDBACK
