MODELING THE PROFIT AND RISK OUTCOMES OF A RANGE OF SOIL WATER TRIGGERS AND CROPPING AREA INTENSITIES - GOONDIWINDI
| Date: 14 Sep 2010
Methods
Tactical approaches
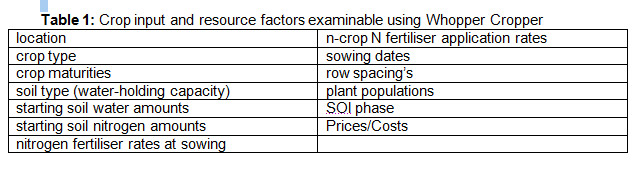
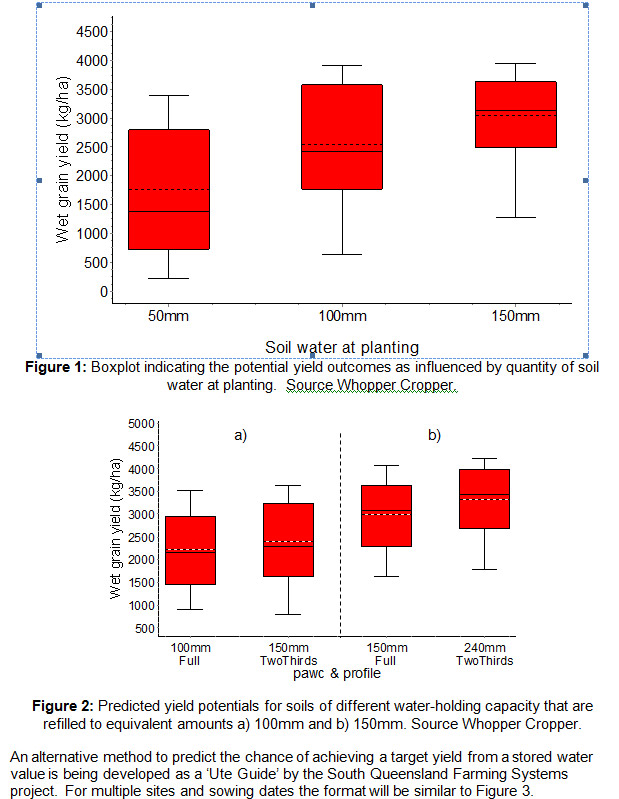
More stored soil water at planting will set the potential for higher yield (Figure 1). However, widely varying in-crop rainfall will result in widely varying yield outcomes in any particular season. Thus the resultant yield will also be affected by the quantity of:
• In-crop rainfall
• stored soil water
• the soil water-holding capacity (PAWC) to a small extent (Figure 2).
The quantity of rainfall is outside the control of the farmer but soil water at planting can be influenced somewhat and can be measured.
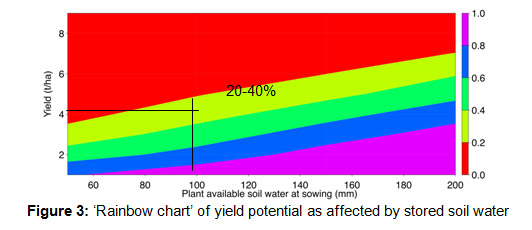
The combination of these factors and others (Table 1) can be illustrated using the Whopper Cropper program and other ‘tools’ derived from APSIM model outcomes. The outputs will always be a range of potential yields (Figure 1) that must be interpreted in terms of probabilities.
Strategic approaches
Introduction
The APSFarm model
APSFarm is a simulation modelling framework capable of mimicking the rules and decision making processes farmers undergo when managing complicated farm businesses. The framework involves interviews and discussions with farmers and their consultants to identify, quantify and translate rules, preferences, practices and strategies into a whole farm systems model (APSFarm), becoming a virtual representation of their farm business. Once model outputs for the baseline scenario are accepted as realistic by the participating farmers, the model is then used to address specific questions from the farmers via What if? scenario analyses.
APSFarm is a dynamic simulation model that extends the APSIM model to simulate economic, financial, environmental impacts of alternative allocations of land, labour, time, irrigation water, livestock, machinery, and finance resources at the whole farm level. Resource allocation at the whole farm level is based on a number of tactical and strategic rules obtained from the participating farmers and their consultants during interviews and discussion sessions.
In APSFarm, the management of the farming system is modelled as a set of state and transition networks. Each field has a current state e.g. fallow, wheat, sorghum, etc., and ‘rules’ that allow transition to adjacent states. These rules represent both the capacity (e.g. availability of machinery, land, labour); capability (e.g. agronomic and technical skills); and attitudes (e.g. farm business strategies, risk attitude) of the farm manager.
Each day, the model examines all paths leading away from the current state to adjacent states, and if the mathematical product of all rules associated with a path is non-zero, it becomes a candidate for action. Should one or more candidates present, the highest valued path is taken, and the process repeats until all options for that day are exhausted.
Rules can represent farm level criteria, such as sowing windows for each crop, definitions of “break of the season” such as mm of rainfall over a defined period of time required to commence sowing, the maximum farm area the farmer would plant to each crop, availability of labour and machinery, etc. Examples of field level criteria include: minimum extractable soil water (ESW, mm) required for sowing a crop, field cropping history, soil type restrictions e.g. plant available water capacity (PAWC), level of ground cover, etc. Other inputs include commodity prices, production costs, available machinery, assets and farm debt level, etc.
Outputs from APSFarm include: production measures (e.g. yields and crop areas); economic measures (i.e. production costs, crop gross margins, economic risk, and farm annual profit); efficiency measures (i.e. crop and whole farm water use efficiency); and environmental measures (i.e. deep drainage, runoff, and erosion).
The modelled scenarios
The task for this paper sought to answer the questions:
• What soil water trigger maximises profit and minimises risk?
• Is it better to plant a larger area of that available at a planting time (80% = more intensive), or a smaller portion (40% = less intensive)
• Can the machinery complement be better utilized?
Three sites were modelled using 50 years of weather data. The main parameters were:
Soil water triggers: Plant if a MINIMUM of 50mm, 100mm, 150mm and full profile
Area rules (intensity): MAXIMUM of 40% or 80% planted to any one crop
Three sites: Goondiwindi, Dalby, Clifton
Simulation: 40 years of actual rainfall
Prices ($/t): Wheat $280/t, Sorghum $160/t, Chickpea $500/t
Farm area Goondiwindi 3000ha, Dalby 1000 ha, Clifton 500 ha
Land value Goondiwindi $1300/ha, Dalby $5000/ha, Clifton $6000/ha
Increasing farm size +20%, +40%, +60%, +80%, +100%
Lease cost 7% of land value
Extra labour Pro-rata increase as per farm size
Machinery loans 7% over 5 years
Results
Effect of soil water triggers
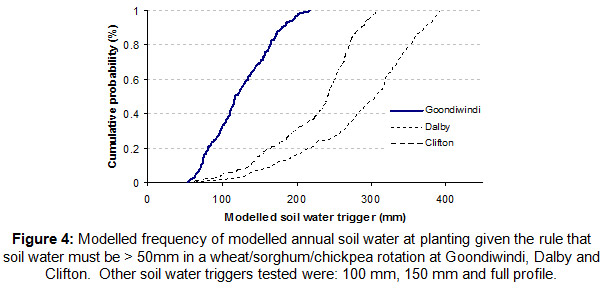
Fortunately, low soil water refill will occur relatively infrequently. At Goondiwindi, soil waters < 100mm occur in 30% of years which may require a decision regarding planting decision (Figure 4). At Dalby and Clifton the frequency of low soil water at planting is much lower.
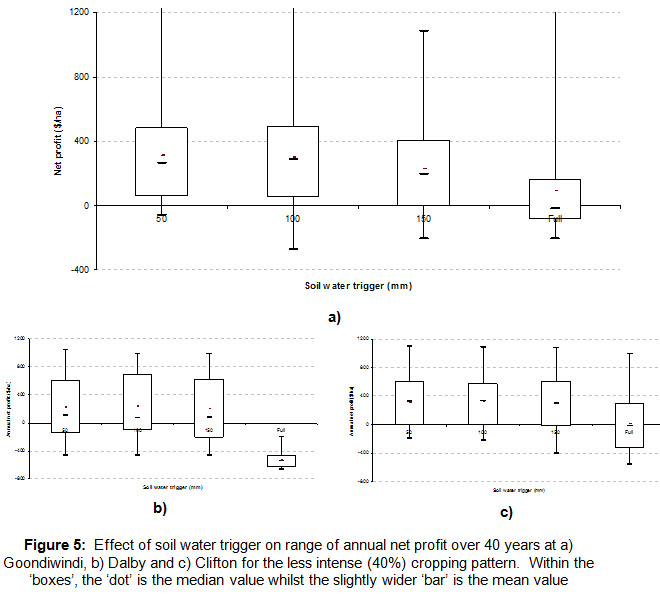
Effect of soil water trigger on net profit
Like crop yield, annual net profit will vary widely (Figure 5). At all sites, mean annual net profit was very low if the soil water refill (trigger) was restricted to FULL at all plantings. This was a direct result of a very low cropping frequency.
The 50mm soil water trigger as not a disadvantage in that there was a generally lower probability of low and negative profits than the 100mm trigger (Figure 5a). In addition, the mean annual losses were much less for the 50mm trigger than the 100mm trigger (see Table 2).
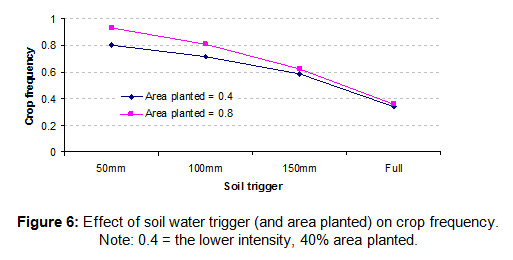
The 50mm trigger produced only slightly less mean profit than the 100mm trigger but the higher cropping frequency (+12%) could place extra pressure on farm management (Figure 6).
At all sites, mean net profit was maximised at the 100mm soil water although at Dalby and Clifton the mean net profit was similar at the 150mm trigger point (Figure 5 b and c).
The decision between the 50mm and 100mm soil water trigger may depend on factors other than purely maximising profit on an individual farm.
At Goondiwindi, results from 1994 to present (15 years) showed a $29/ha lower net profit from the 50mm soil water trigger (data not shown).
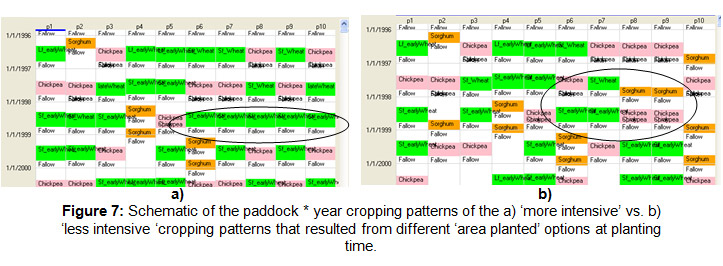
Effect of area planted on cropping pattern
The analysis tested the effect of a less intensive (40%) and more intensive (80%) crop rotation. The former resulted in a more diverse mix of crop types and more long fallows (Figure 7 a). Conversely, the more ‘intensive’ approach to the area planted to individual crops and the total farm area planted at each opportunity resulted in a higher cropping frequency and less diversity of crops at some planting times (Figure 7 b). The modelling set-up was not as extreme as a ‘fence-to-fence vs. a fixed rotation’ comparison, but still demonstrated the effect of different strategies.
Effect of ‘area planted’ on net profit
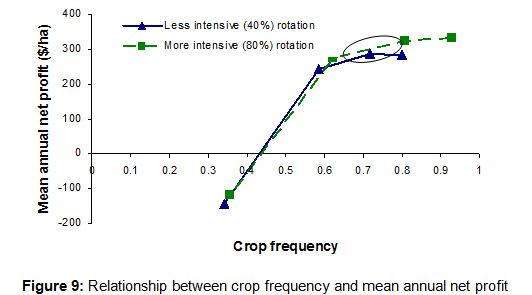
As shown in Figure 8, an increase in the intensiveness of the area-planted could increase net profit. However, the increase in profit comes as a result of increased crop frequency (Figure 6 and Figure 9).
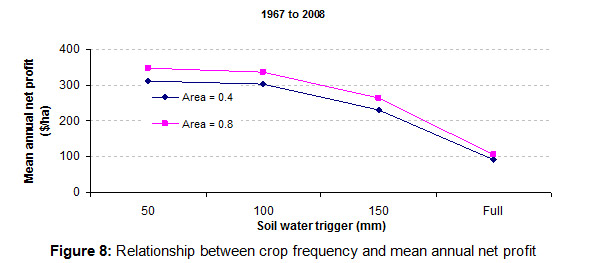
With a 100mm soil water trigger, the $39/ha/annum increase in net profit comes as a result of 10% greater crop frequency (Figure 9). This may be acceptable to some growers but to others the increased crop frequency could put pressure on other management factors such as weed control, machinery availability and maintenance and possibly labour requirements
In addition, in years in which losses occurred, the losses were greater in the more intensive area-planted strategy (Table 2). The extra losses were insignificant for the 100mm soil water trigger but may be problematic for the 50mm and 150mm soil water triggers although as previously mentioned the magnitude of the losses were lowest for the 50mm trigger.
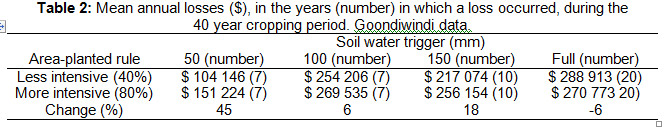
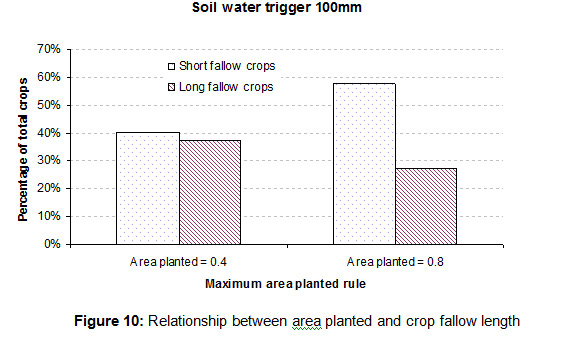
The more intensive planting strategy resulted in a higher percentage of short-fallowed crops at the expense of long-fallowed crops. As shown in Table 1, total higher losses costs are incurred from the more intensive area-planted strategy that includes almost 20% more short-fallowed crops than the more rigid strategy.
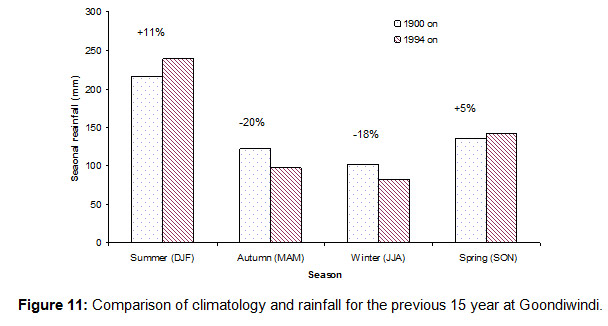
Seasonal rainfall
The reason for the benefit of the less intensive area strategy in the last 15 years could be that the seasonal rainfall appears to be changing (Figure 11). Winter rainfall has declined which would disadvantage short-fallowed crops in comparison to long-fallowed crops resulting in an advantage to both the less intensive soil water trigger and area-planted strategies. Summer rainfall has apparently increased but sorghum currently has less importance than wheat in the Goondiwindi area. However, if this change persists, sorghum may become a more reliable component of the rotation.
Obtaining Whopper Cropper
The simulations are pre-run for districts around Australia.
Queensland districts include: Goondiwindi, Emerald, Capella, Dululu, Dysart, Rolleston, Banana, Theodore, Dalby, Pittsworth, Warwick, Kingaroy, Miles, Meandarra, Roma, and St George.
NSW districts include: Tamworth, Moree, Walgett, Narrabri, Dubbo, Nyngan, Gulargambone, Gunnedah, Coonabarabran, Quirindi, Condobolin, Wagga Wagga, Forbes, Temora, Parkes, Cowra, West Wyalong, Griffith, and Cootamundra.
The program is available through: Back Paddock Company www.backpaddock.com.au
Phone: 1800 557 166. Assistance is also available from the author.
Contact details
Howard Cox
Department of Employment, Economic Development, and Innovation
Email: howard.cox@deedi.qld.gov.au
Ph: 07 46881381
Mb: 0418 708278
GRDC Project Code: South Queensland Far,
Was this page helpful?
YOUR FEEDBACK