Dryland water-use efficiency - What is it and how to improve it?
| Date: 11 Aug 2011
DRYLAND WATER-USE EFFICIENCY – WHAT IS IT AND HOW TO IMPROVE IT?
James Hunt & John Kirkegaard
CSIRO, Canberrra
Water-use efficiency – what is it?
Water-use efficiency (WUE) of wheat grain production is simply the grain yield of a crop divided by the water used by that crop. Crop water-use is generally defined as transpiration plus evaporation, but it can be useful to also include net run-off and drainage. The most practical way of estimating water-use in the field is by measuring soil water at sowing, subtracting soil water at crop maturity (which can be assumed to be zero in dry springs) and adding the rain that falls in between.
In their seminal paper of 1984 (www.publish.csiro.au/nid/43/issue/1135.htm), French and Schultz pointed out a couple of interesting observations about the relationship between wheat water-use and grain yield, which over the years have become somewhat distorted, to the point where WUE figures quoted in the grains industry are now often misleading.
The main point for which French and Schultz are remembered is that they defined an upper-boundary to their WUE data which had a slope of 20 kg/ha.mm (which they took to be the best transpiration efficiency achievable) and intercepted the x-axis at 110 mm, which they took to be the least amount of evaporation achieved in their dataset. They pointed out that this line described the best yield (benchmark) that could be achieved in their environment for a given amount of water-use, which would require good agronomic management and benign seasonal conditions (good distribution of rainfall, no inclement temperatures during flowering etc.) to be achieved.
However, in recent times this relationship has been misinterpreted such that 110 mm is the average amount of evaporation that occurs during the growing season, which has led people to calculate transpiration efficiencies by subtracting 110 from their estimate of water-use, and quote them as water-use efficiencies. This is erroneous for two reasons. Firstly, as French and Schultz themselves pointed out, evaporation varies greatly between season and soil types, so assuming it is constant will almost always lead to errors in calculation of transpiration efficiency. Secondly, one of the best ways for farmers to improve WUE of a crop is by decreasing the amount of water that evaporates relative to what the crop transpires. Therefore taking evaporation out of the benchmark removes reference to the single parameter that is most easily improved. That is, it is water-use efficiency that is important as a benchmark when reviewing management, not transpiration efficiency.
The second observation pointed out by French and Schultz was that April to October rainfall could be used as a surrogate for water-use, provided that there was no stored soil water at sowing. This provision has been all too easily forgotten, and in recent times calculations of WUE have been reported which make no allowance for stored soil water available at sowing, and can easily be incorrect by 100% or more. If stored soil water is present at sowing it must be considered in WUE calculations in order for the numbers to be sensible.
The national WUE initiative of the GRDC hopes to re-establish standardised calculations of WUE in the grains industry, and is also working to incorporate other climate drivers (e.g. rainfall distribution, high temperatures and low humidity) into future benchmarks of WUE. For more information see WUE Initiative website.
For Example, at FarmLink and CSIRO’s GRDC funded WUE field-site at Temora in 2009, GregoryA wheat planted on 30 April yielded 1637 kg/ha. The water-use of the crop can be calculated as water available at sowing (42 mm), minus water available at maturity (1 mm, close enough to 0 mm!) plus the rain that fell in between (167 mm).
Water-use = 42 – 1 + 167 = 208 mm
Therefore, water-use efficiency of the crop is equal to grain yield in kg/ha divided by water-use;
Water-use efficiency = 1637/208 = 7.9 kg/ha.mm
How does this compare to French and Schultz’s benchmark?
Potential yield = (208 -110) x 20 = 1960 kg/ha or a WUE of 9.4 kg/ha.mm
So the crop at Temora yielded 323 kg/ha or 16 % short of the benchmark. Why? APSIM can tell us that some of the difference was due to the hot, dry spring. It simulated a yield based on daily rainfall data of 1775 kg/ha, which is very close to what the crop actually achieved. WUE and APSIM are both useful benchmarks that in this case tell us that the crop performed very close to its water limited potential in 2009.
Improving dry-land WUE
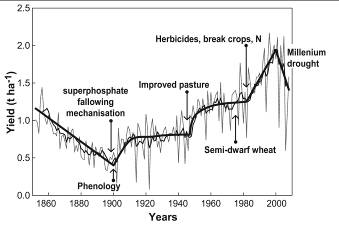
The history of Australian wheat production shows that major improvements in yield have occurred when a package of new genetic and/or management developments synergistically combine into an effective farming system (Figure 1).
Figure 1. Trends in Australian average annual wheat yields (line) and 10 yr moving average (bold). The approximate timing of selected management (above line) and breeding innovations (below line) are indicated by arrows to demonstrate the synergies between combinations of new management strategies and underlying genetic improvements that have significant and sustained impacts on productivity. The significant falls in yield since 2002 are attributed to the prolonged and widespread millennium drought.
In many wheat growing regions of Australia, the last decade (millennium drought) has been a notably dry period that is unprecedented in the collective experience of contemporary farm managers, although it is not without precedence in the historic climate record (Figure 2a). However, the effects of the millennium drought have been made worse by increased evaporative demand (Figure 2b) and extreme temperatures during the critical flowering period (Figure 2c and 2d). Forecasts of climate change predict these hostile seasonal patterns are likely to continue into the future (http://www.csiro.au/ozclim/home.do).

Figure 2. a) April to October rainfall for Kerang since records began in 1889; b) April to October potential evapo-transpiration for Kerang since evaporation measurements began in 1970; c) the number of days per year at Kerang in which maximum temperature exceeds 32°C during September and October since temperature measurements began in 1962; d) the number of days per year at Kerang in which minimum air temperature is less than 2°C during September and October. Bars represent totals for individual years; the solid black line is a ten-year running mean.
This change in production climate combined with declining terms of trade has forced Australian farmers to adapt their management in order to remain profitable. Genetic adaptations simply cannot be deployed quickly enough to maintain productivity in the face of such rapid change. The development of new varieties with traits to improve performance under water-limited conditions has continued, but future increases in productivity will only happen if these new traits are combined with appropriate management to form synergistic farming systems.
In-crop and pre-crop management for water-use efficiency
Research into both management and genetic traits that improve yield in water-limited environments often tends to focus on the in-crop period i.e. the period of time from when a crop is sown to when it is harvested (Figure 3). However, management of farming systems during the pre-crop period often has greater potential to improve yield and overall system performance under water-limited conditions.
This can be clearly demonstrated through farming system models such as APSIM (www.apsim.info), which allow us to quantify how different components of the farming system contribute to yield and water-use efficiency over a much longer period of time than is allowed by field trials.

Figure 3. The range of in-crop management options (A) that influence the productivity and water-use efficiency of cereal crops. Critical in-crop seasonal influences at sowing, anthesis and maturity are shown. In-crop management effects are placed in the context of various pre-crop management options (B), and the continuum of overlapping influences of these various options on components of water-limited yield are shown by horizontal arrows.
A northern Victorian case study
To test the impact of farming systems on yields APSIM was used on a case study farm located near Kerang in northern Victoria.
The general farming system and evolution in management over the last 30 years is representative of many progressive grain growing farms in low-rainfall regions of Australia. The farm managers have used Yield Prophet® (www.yieldprohet.com.au), the commercial web-based form of APSIM, to support decisions in multiple paddocks each season since 2005. As a result, a good soil characterisation for the farm exists and simulated wheat and barley yields have closely matched those achieved in the paddock (Figure 4).

Figure 4. The relationship between observed and APSIM simulated wheat and barley yields on the case study farm for paddocks managed with Yield Prophet® from 2005-2008. The dashed line represents the ideal 1:1 relationship. The solid line represents the best fit linear regression equation (r2 = 0.86, RMSD= 0.43), 72% of simulated yields are within 0.5 t/ha of observed yields.
Six simulation scenarios (1962-2009) were created based on generalised progress in pre-crop and in-crop management made on the farm during the last 30 years (Table 1).
Table 1. The management scenarios simulated for the case study farm in APSIM. Scenarios are additive combinations of various pre-crop and in-crop management and a novel genetic trait.
|
Scenario
|
Management Type
|
|||||
|
Tillage system
(pre-crop
– long-term)
|
Stubble
(pre-crop-long-term)
|
Summer weeds
(pre-crop - fallow)
|
Rotation
(pre-crop – sequence)
|
Sowing window
(in-crop)
|
Coleoptile
(genetic)
|
|
|
1. Baseline
|
2 cultivations prior to sowing and full cut-out at sowing
|
Burnt in Autumn
|
No control until autumn
|
Wheat-wheat
|
21 May – 1 Aug
|
Short
|
|
2. Long term
|
Direct drill, minimum till
|
Fully retained
|
No control until autumn
|
Wheat-wheat
|
21 May – 1 Aug
|
Short
|
|
3. Fallow
|
Direct drill, minimum till
|
Fully retained
|
Full control
|
Wheat-wheat
|
21 May – 1 Aug
|
Short
|
|
4. Sequence
|
Direct drill, minimum till
|
Fully retained
|
Full control
|
Forage peas-wheat
|
21 May – 1 Aug
|
Short
|
|
5. In-crop
|
Direct drill, minimum till
|
Fully retained
|
Full control
|
Forage peas-wheat
|
25 April – 1 Jul
|
Short
|
|
6. Genotype
|
Direct drill, minimum till
|
Fully retained
|
Full control
|
Forage peas-wheat
|
20 April
|
Long
|
The case study scenarios
Scenario 1 (baseline) represents a conventional tillage farming system that was typical of regional practice until the late 1980s. Weeds are grazed by sheep over summer but not controlled, stubble is burnt in April and the paddock cultivated twice before being conventionally sown.
Scenario 2 (long term) represents the minimum till, retained stubble farming systems that developed during the 1980s. In this scenario, all stubble from the previous crop is retained until sowing. The sensitivity of the soil to run-off is reduced to reflect the better infiltration rates found in reduced tillage systems. In both Scenario 1 and 2, soil water is reset to the crop lower limit of wheat on 31 March each year to represent the situation where poor control of summer weeds used all the water that would otherwise have been available for subsequent crops.
In Scenario 3 (fallow) complete fallow weed control is practiced and all out-of-season rainfall is allowed to accumulate in the soil (Table 1). Scenarios 1, 2 and 3 involve a continuous wheat sequence, reflecting the cereal dominated crop sequences typical prior to the 1980s, and that have re-emerged in response to the millennium drought. Usually in this area, cereals use all of the plant available water in a given season and no residual water carries over to the next crop in the sequence.
In Scenario 4 (sequence), a forage field-pea crop cut for hay in October at early pod-set is introduced into the sequence. On the commercial farm introduction of this crop in 2005 provided the case-study farm managers with a low risk break crop that remained profitable in dry years, and provided residual water that could be used by a wheat crop in the next season. Two separate simulations of field-pea/wheat crop sequence were offset such that a wheat crop was grown in every year of the climate record. The aim here is not to compare the profitability of different crop sequences, but to quantify the impact that crop sequence has on subsequent crop yield. The disease, weed and nitrogen benefits of the break crop are not simulated so that yield increases in wheat are entirely due to additional water.
In Scenario 5 (in-crop), an earlier sowing window (25 April) is included to reflect the lowered risk afforded by sowing earlier into the stored soil water preserved by improved infiltration, fallow weed management, stubble retention and forage peas in the sequence.
In Scenario 6 (genetic), we investigate the potential impact of a novel genetic adaption -a wheat cultivar with a long coleoptile that could be sown deeply (a depth of 110 mm is used in the simulation) into soil water remaining from the previous field-pea crop and fallow period (Figure 5). This trait allows sowing on a calendar date, as soil water to germinate the crop is usually available at this depth in April, but is too deep for current short-coleoptile wheat varieties which need an opening rain to germinate and emerge. This trait would give greater control over the timing of crop emergence and maturity and optimise flowering time and thus yield potential for a given environment.

Figure 5. A long coleoptile wheat variety as simulated in Scenario 6.
In order to demonstrate that individual management changes have greater impact when they form part of a coherent system, each of the management changes were also simulated individually and compared to the baseline scenario (Scenario 1).
All simulations were set up such that nitrogen availability did not limit yield. As APSIM does not model the negative effects on crop growth of weeds, pests, diseases, frost, and pollen and spikelet sterility due to excessive heat, the yield values reported here are water-limited attainable yields. That is, yields which could be achieved by growers given skilful use of available technology and ignoring constraints placed on realised farm yields by operational considerations and input risk aversion. This sort of simulation typically accounts for 70-80% of the variation seen in crop yields. Figure 4 shows that water and nitrogen balance simulated by APSIM could account for 86% of the variation in yields achieved on the case-study farm from 2005 to 2009.
Time of sowing in all simulations was determined by a threshold rainfall rule in which 15 mm or more must fall over a maximum of three days during the sowing windows specified in Table 1. A mid-early maturity wheat variety was used (e.g. YitpiA, CorrellA) and all crops were sown at a density of 150 plants/m2 and 21 cm row spacing.
Impact of systems changes
Farming system changes introduced by the farm managers over the last 30 years have resulted in big improvements in yield and water-use efficiency (Table 2 and 3). The simulated change from the baseline scenario of full-tillage and no stubble retention to direct drill and stubble retention (Scenario 2) increased yield by a modest amount over the 48 year period and perhaps surprisingly by a slightly smaller margin proportionally during the millennium drought (Table 3).
This increase was due to a reduction in the proportion of run-off and evaporation relative to total water-use. This management change improved yields in all years of the simulation, increasing the mean, median and lowest yield achieved (Figure 6), albeit by a relatively small margin. The relatively small impact on yield, which did not improve in drier years, is consistent with the results of long-term experiments throughout southern Australia where tillage and stubble treatments were imposed under otherwise identical management, including sowing dates.
This emphasises the fact that yield responses to reduced tillage and stubble retention alone may be small, or even negative, if synergistic changes to the system (e.g. sowing opportunities, summer weed control) as a whole are not considered.
Table 2. Mean simulated yield and water-use efficiency from the different scenarios for all years (1962-2009) and the millennium drought period (2000-2009).
|
|
|
All years
|
|
2000-2009
|
||
|
Scenario
|
Management lever
|
Mean grain yield (kg ha-1)
|
Mean WUE (kg ha-1 mm-1)
|
|
Mean grain yield (kg ha-1)
|
Mean WUE (kg ha-1 mm-1)
|
|
1
|
Baseline
|
1574
|
6.0
|
|
416
|
2.4
|
|
2
|
Long term
|
1811
|
6.8
|
|
468
|
2.7
|
|
3
|
Fallow
|
2767
|
9.6
|
|
1403
|
6.2
|
|
4
|
Sequence
|
3414
|
11.1
|
|
1910
|
8.1
|
|
5
|
In-crop
|
3977
|
12.9
|
|
2234
|
9.5
|
|
6
|
Genotype
|
4539
|
15.2
|
|
3078
|
12.6
|
Table 3. Mean increase in simulated yield assuming adaptations are added either sequentially or singularly to the baseline scenario for all years (1962-2009) and the millennium drought period (2000-2009). Numbers in brackets are the percentage increase relative to the mean yield of the baseline scenario (Table 2).
|
|
|
Mean yield increase - All years (kg/ha)
|
|
Mean yield increase - 2000-2009 (kg/ha)
|
||
|
Scenario
|
Management lever
|
Additive
|
Singular
|
|
Additive
|
Singular
|
|
1
|
Baseline
|
-
|
-
|
|
-
|
-
|
|
2
|
Long term
|
237 (15)
|
237 (15)
|
|
52 (13)
|
52 (13)
|
|
3
|
Fallow
|
956 (61)
|
769 (49)
|
|
935 (224)
|
759 (182)
|
|
4
|
Sequence
|
647 (41)
|
158 (10)
|
|
507 (122)
|
47 (11)
|
|
5
|
In-crop
|
563 (36)
|
467 (30)
|
|
324 (78)
|
222 (53)
|
|
6
|
Genotype
|
563 (36)
|
-154 (-10)
|
|
844 (203)
|
-36 (-9)
|

Figure 6. The distribution of simulated grain yield outcomes from 1962-2009 for the different management scenarios, and the number of years in which the management change introduced for each scenario did not result in a positive yield response relative to the previous scenario.
In contrast, the largest increase to yield and water-use efficiency was achieved by improved summer weed management (Scenario 3). This significantly increased water-use, and also improved water-use efficiency by increasing the average harvest index as more water was available to wheat crops during spring.
This management change has been vital during the millennium drought period because the water stored during the summer fallow represents a much greater proportion of the total water available to the crop, and because springs during this period have generally been hot and dry (Figure 2). The yield increase is lower when fallow weed management was introduced alone (Table 3) because the soil cover and superior infiltration rates offered by stubble retention and minimum tillage are needed to maximise fallow efficiency.
The introduction of forage peas into the rotation (Scenario 4) also increased water carried over to the wheat crop and effectively acted in the same manner as summer weed management to improve yield. However, when added alone, the impact of the forage peas is much smaller because the water they leave is used by summer weeds and lost from bare, cultivated soil. Forage peas have been particularly important during the millennium drought period, as the water they leave is stored deep within the profile and has become available during the dry springs (Table 3).
The ability to sow early (Scenario 5) increased yield significantly in both the historic and millennium drought period (Table 3). However, sowing wheat dry or immediately after the autumn break is an adaptation only made possible by the exceptional weed control provided by the forage pea break crop, good fallow management and surface stubble extending the sowing window following marginal sowing rains. The managers of the case study farm were alerted to the potential value of early sowing when Yield Prophet® simulations indicated a greater penalty existed for delayed sowing when water was available (i.e. after pea forage) than when it was not.
Unlike the previous three management changes, sowing early (scenario 5) can have a ‘downside’ in that whilst it increases average yield, in 9 out of the last 42 years yields were actually lower in comparison to scenario 4 (Figure 7). This happens in years with cool, wet springs in which early sown crops have matured too early to take advantage of these ideal grain-filling conditions.
Sowing early also increases the incidence of frost (defined as a minimum temperature less than 2 °C) during flowering and grain-fill from 7% to 30% of years. However, the experience of the farm managers in recent years has been that the potential risk of frost has largely been offset by increases in yield potential and avoidance of hot days later in spring. This simulation does highlight the fact that frost-tolerant wheat would be a valuable genetic trait for this farming system.
The genotypic adaptation of a long coleoptile gives a large yield increase in combination with the other management improvements (Scenario 6). It generates particularly large yield advantages (more than double) in the millennium drought years (Table 3) because of the hostile springs experienced in those years.
However, this adaptation generates a yield decrease if added individually because in the absence of stored water from the pea crop, good fallow management and improved soil and stubble management, there is a yield penalty due to the time taken for the seed to emerge from depth after opening rains. This is a strong demonstration of how it can be pointless, or in this case counterproductive to develop and adopt new technologies if consideration is not given to how they might fit into the farming system as a whole.
Further reading: Kirkegaard JA and Hunt JR (2010) Increasing productivity by matching farming system management and genotype in water-limited environments. Journal of Experimental Botany 61, 4129-4143. http://jxb.oxfordjournals.org/content/61/15/4129.full
Contact Details
James Hunt
CSIRO Sustainable Agriculture National Research Flagship
GPO Box 1600, Canberra, ACT 2601, Australia
james.hunt@csiro.au
GRDC Project Code: CSP00111,
Was this page helpful?
YOUR FEEDBACK