Australian maize industry overview - 2012
Author: Tony Cogswell | Date: 02 Aug 2012
Tony Cogswell
Lachlan Commodities
Keywords: maize, markets
Take home messages
Industry background
- Average Australian maize production: 440kmt p.a.
- Largest production year: 520kmt in 2007-08 season
- Australia’s current GMO status: 100% non GMO
- Annual maize exports: 6-7% of production
- East coast of Australia produced >200kmt in 1894
2010-11 Breakdown of the Australian maize market
- Stockfeed: 196kmt
- Dry Milling: 130kmt
- Wet Milling: 45kmt
- Export: 27kmt
- Confectionary: 27kmt
Total Production: 425kmt
Grain industry comparison
Japanese Market Overview
Population: 127,000,000
Annual maize Imports: 16,000,000mt
Potential interest In Australian corn: 2,070,000
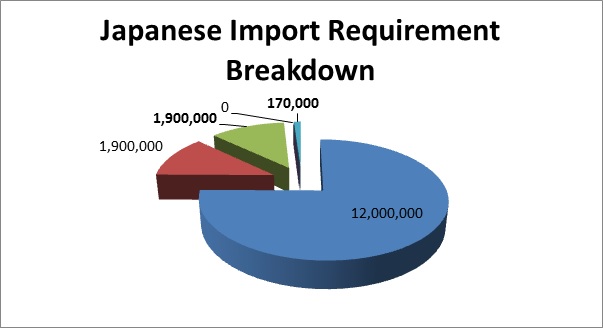
Feed = 12,000,000; GM Wet Milling = 1,900,000; GM Free Wet Milling = 1,900,000; GM Dry Milling = 0 and GM Free Dry Milling = 170,000
Korean Market Overview
Population: 49,000,000
Annual maize imports: 9,000,000mt
Potential interest In Australian corn: 1,400,000
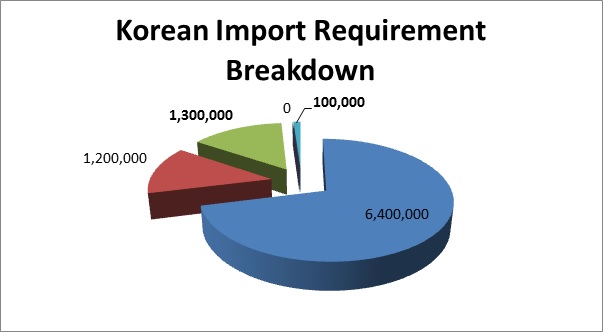
Feed = 6,400,000; GM Wet Milling = 1,200,000; GM Free Wet Milling =1,300,000; GM Dry Milling = 0 and GM Free Dry Milling = 100,000
Combined Japanese and Korean Market Overview
Population: 176,000,000
Annual maize imports: 25,000,000mt
Potential interest In Australian corn: 3,470,000
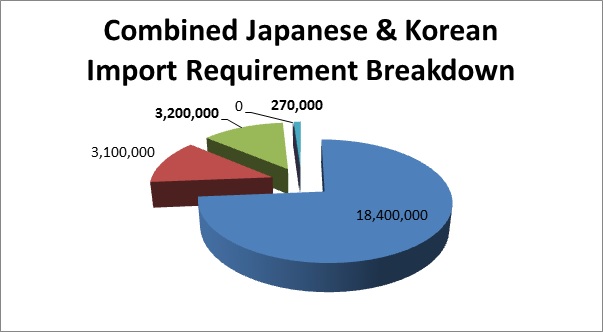
Feed = 18,400,000; GM Wet Milling = 3,100,000; GM Free Wet Milling = 3,200,000; GM Dry Milling = 0 and GM Free Dry Milling = 270,000
A Changing Environment
- In 1995 China was producing about 14mmt of soybean and consuming all of their production.
- In 2010 China is still only producing 14mmt of soybean annually but consuming 69mmt.
- China’s working age population will peak in the next two years
- China’s overall population is estimated to peak in 2025 at 2.4 billion
- USA production in 2005 was around 500mmt of corn
- USA corn production in 2011 was 376mmt
- USDA estimated corn production for 2012 is 330mmt
- USA ethanol production in 2010 was consuming about 30% of the national corn crop
- Strong government support in Central America to increase soybean and corn production
- @ USD$7.00 per bushel or AUD$270 per m/t ethanol production is uneconomic resulting in a year on year reduction in ethanol demand
- Current discussion in US on reducing the current ethanol mandate in auto-fuel
- Eastern Europe(Hungary) now exporting bulk corn to Asia
- 2012 World supply for corn -44.7mmt
- 2012 World demand for corn -22.8mmt
- 2012 World wheat supply -6.7mmt
- 2012 World wheat demand -1.8mmt
- Australian domestic demand for corn also reduced
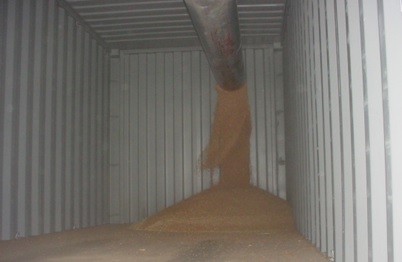
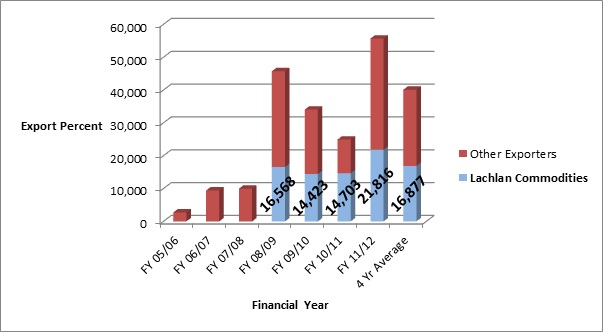
Port of Brisbane Maize Exports
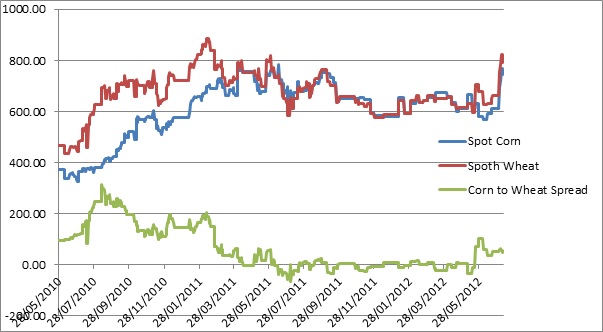
Spot CBOT Corn to Wheat Spread
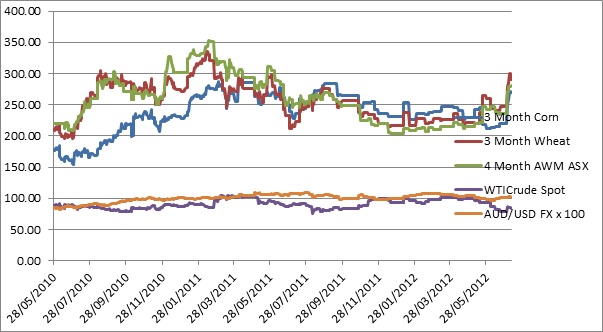
3 Month CBOT Corn to Wheat Spread
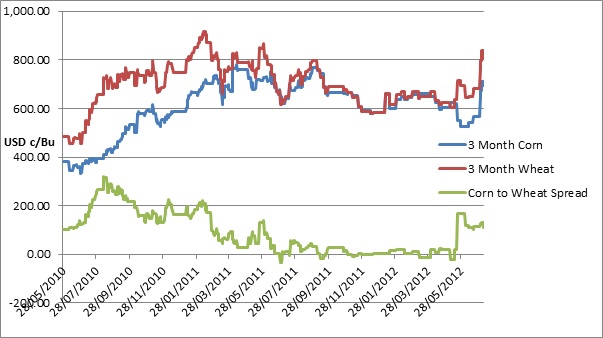
Futures converted to AUD values
Contact details
Tony Cogswell
Lachlan Commodities
Was this page helpful?
YOUR FEEDBACK