Barley varieties and agronomy
Author: Matthew Gardner and Guy McMullen, NSW DPI Tamworth | Date: 05 Mar 2014
![]() Varieties displaying this symbol beside them are protected under the Plant Breeders Rights Act 1994.
Varieties displaying this symbol beside them are protected under the Plant Breeders Rights Act 1994.
AuthorsMatthew Gardner and Guy McMullen, NSW DPI Tamworth
GRDC code: DAN0169, Variety Specific Agronomy Packages
Take home messages
- Commander
 continues to perform well in northern NSW in both yield and protein
 - There are several new lines that are undergoing malt accreditation that are showing considerable promise in the region.
- Commander and these newer lines should give growers an increased chance of achieving malt specifications through improved grain size and lower grain protein levels under higher N supply.
Introduction
Barley still has an important role in northern NSW farming systems with a large potential to increase the area of barley plantings across the region. However, this would be primarily dependent on improved receival prices and varieties that reliably achieve malt classification. Since 2011 there has been 16 new barley entries submitted for malt accreditation, with six being released as commercial varieties in the past two seasons. The release of new higher-yielding malting varieties will provide industry with improved grain quality and likelihood of achieving malt specifications. Other factors that favour barley can be performance in tough seasons, tolerance to sub-soil constraints (e.g. salinity), better weed competition and its tolerance to root lesion nematodes (RLN). It should be noted that barley is a host for RLN and crop rotation is needed to reduce RLN populations below critical thresholds. Major issues that currently limit barley production are reliability of achieving malting specifications – especially grain size and protein and lodging remains a problem although there has been some improvement in some of the new lines. It should also be remembered that barley is a host of crown rot so is not a break crop for this disease.
Variety characteristics and performance
Growers now have access to a number of new varieties which have a range of improvements in yield, disease resistance and grain quality over older varieties. When choosing a variety growers and advisors need to consider the current classification of a variety – many new releases do not yet have malt accreditation, receivals at local silos needs to be checked, as well as agronomic performance. New lines with improved yield and grain size are also exhibiting lower grain protein levels increasing the likelihood of achieving malt quality in seasons such as 2012 and 2013
Commander![]() has quickly established itself as the preferred high yielding malt variety for growers in northern NSW, representing >85% of malt barley recievals in the northern grains region. Commander
has quickly established itself as the preferred high yielding malt variety for growers in northern NSW, representing >85% of malt barley recievals in the northern grains region. Commander![]() is a high yielding variety that tends to have lower protein levels and improved grain size compared to Gairdner
is a high yielding variety that tends to have lower protein levels and improved grain size compared to Gairdner![]() . In average to high yielding seasons there can be significant lodging issues in Commander. There are still significant areas of Gairdner
. In average to high yielding seasons there can be significant lodging issues in Commander. There are still significant areas of Gairdner![]() under production and it is still a preferred variety for malting and brewing.
under production and it is still a preferred variety for malting and brewing.
Currently there are also a number of other lines that are recently released and/or undergoing malt evaluation. Compass![]() (WI4593), released from the University of Adelaide, is a high yielding line that performed very well in the 2012 and 2013 NVT trials through northern NSW and QLD. Compass
(WI4593), released from the University of Adelaide, is a high yielding line that performed very well in the 2012 and 2013 NVT trials through northern NSW and QLD. Compass![]() has an early to mid-season maturity with a similar plant type to Commander but with improved straw strength. Compass
has an early to mid-season maturity with a similar plant type to Commander but with improved straw strength. Compass![]() appears to suit environments with 2-5 t/ha yield potential. Malt accreditation is still pending on Compass
appears to suit environments with 2-5 t/ha yield potential. Malt accreditation is still pending on Compass![]() . La Trobe
. La Trobe![]() (IGB1101), from Intergrain, also performed very well in many sites in the 2013 NVT. La Trobe
(IGB1101), from Intergrain, also performed very well in many sites in the 2013 NVT. La Trobe![]() is an early maturing line suited to the western, low rainfall regions. Similar to Hindmarsh
is an early maturing line suited to the western, low rainfall regions. Similar to Hindmarsh![]() , La Trobe
, La Trobe![]() performs well under terminal drought – such as in the 2013 winter season.
performs well under terminal drought – such as in the 2013 winter season.
| State | NSW | QLD | ||||||||||||||||||||
|---|---|---|---|---|---|---|---|---|---|---|---|---|---|---|---|---|---|---|---|---|---|---|
| Nearest town | North Star | Tamworth | Coonamble | Gilgandra | Tulloona | Biloela | Springsure | Brookstead | Macalister | Lundavra | ||||||||||||
| Variety Name | t/ha | % | t/ha | % | t/ha | % | t/ha | % | t/ha | % | t/ha | % | t/ha | % | t/ha | % | t/ha | % | t/ha | % | ||
| Bass | 3.16 | 114 | 2.80 | 90 | 4.15 | 127 | 2.72 | 102 | 2.45 | 92 | 2.74 | 95 | 2.42 | 93 | 3.20 | 95 | 3.66 | 94 | 2.16 | 87 | ||
| Commander | 3.11 | 112 | 3.45 | 111 | 3.22 | 99 | 3.17 | 119 | 3.00 | 112 | 2.84 | 99 | 2.65 | 102 | 3.74 | 111 | 4.16 | 107 | 2.84 | 115 | ||
| Compass | 3.34 | 121 | 3.61 | 116 | 3.10 | 95 | 3.42 | 128 | 3.38 | 127 | 3.34 | 116 | 2.86 | 110 | 3.82 | 113 | 4.44 | 115 | 3.23 | 130 | ||
| Fathom | 3.21 | 116 | 3.70 | 119 | 3.53 | 108 | 3.13 | 117 | 3.43 | 128 | 2.69 | 93 | 2.56 | 99 | 3.66 | 108 | 4.32 | 111 | 3.12 | 126 | ||
| Flinders | 2.69 | 97 | 3.16 | 102 | 4.08 | 125 | 2.45 | 92 | 2.22 | 83 | 2.87 | 100 | 2.52 | 97 | 3.28 | 97 | 3.64 | 98 | 2.40 | 97 | ||
| Gairdner | 2.08 | 75 | 2.92 | 94 | 2.19 | 67 | 2.28 | 86 | 2.21 | 83 | 2.75 | 95 | 2.57 | 99 | 3.03 | 90 | 3.48 | 90 | 1.91 | 77 | ||
| Granger | 2.92 | 106 | 3.25 | 105 | 3.33 | 102 | 2.42 | 91 | 2.59 | 97 | 3.06 | 106 | 2.88 | 111 | 3.44 | 102 | 4.16 | 107 | 2.40 | 97 | ||
| Henley | 2.85 | 103 | 3.21 | 103 | 3.25 | 100 | 2.64 | 99 | 2.59 | 97 | 2.86 | 99 | 2.70 | 104 | 3.08 | 91 | 3.93 | 101 | 2.41 | 97 | ||
| Hindmarsh | 3.26 | 118 | 3.39 | 109 | 3.18 | 98 | 3.03 | 114 | 3.32 | 124 | 3.18 | 111 | 2.76 | 106 | 3.36 | 100 | 4.14 | 107 | 2.89 | 116 | ||
| La Trobe | 3.33 | 120 | 3.23 | 104 | 3.08 | 94 | 2.93 | 110 | 3.00 | 112 | 3.25 | 113 | 3.07 | 118 | 3.53 | 105 | 4.24 | 109 | 2.83 | 114 | ||
| Navigator | 2.50 | 90 | 2.89 | 93 | - | - | - | - | - | - | - | - | - | - | - | - | - | - | - | - | ||
| Oxford | 2.76 | 100 | 2.85 | 92 | 4.01 | 123 | 2.31 | 86 | 2.39 | 90 | 2.34 | 81 | 2.44 | 94 | 3.15 | 93 | 3.81 | 98 | 1.82 | 74 | ||
| Skipper | 2.81 | 101 | 3.39 | 109 | 2.49 | 76 | 3.31 | 124 | 2.99 | 112 | 3.01 | 105 | 3.04 | 117 | 3.83 | 114 | 4025 | 110 | 3.14 | 127 | ||
| SY Rattler | 2.80 | 101 | 3.12 | 100 | - | - | - | - | - | - | 2.80 | 97 | 2.75 | 106 | 3.42 | 102 | 3.93 | 101 | - | - | ||
| Wimmera | 2.68 | 97 | 2.74 | 88 | 3.30 | 101 | 2.33 | 87 | 2.79 | 104 | 2.79 | 97 | 2.47 | 95 | 3.32 | 98 | 3.75 | 97 | 2.44 | 99 | ||
| Site Mean (t/ha) | 2.77 | 3.11 | 3.26 | 2.67 | 2.67 | 100 | 2.88 | 2.60 | 3.37 | 3.88 | 2.48 | |||||||||||
| CV (%) | 5.87 | 7.87 | 7.28 | 4.81 | 5.75 | 215 | 6.60 | 6.16 | 3.80 | 3.92 | 5.89 | |||||||||||
| Probability | <0.001 | <0.001 | <0.001 | <0.001 | <0.001 | <0.001 | <0.001 | <0.001 | <0.001 | <0.001 | ||||||||||||
| LSD (t/ha) | 0.27 | 10 | 0.41 | 13 | 0.38 | 12 | 0.23 | 8 | 0.27 | - | 0.30 | 10 | 0.26 | 10 | 0.20 | 6 | 0.24 | 6 | 0.24 | 10 | ||
| Sowing Date | 20-May-2013 | 21-Jun-2013 | 15-May-2013 | 30-May-2013 | 05-Jun-2013 | 06-May-2013 | 30-May-2013 | 20-Jun-2013 | 05-Jun-2013 | 27-May-2013 | ||||||||||||
These results are from one season, in deciding on varieties for 2014 growers should consider the across season results available on the NVT website and in the 2014 NSW DPI Winter Crop Variety Sowing Guide.
National barley agronomy trials
Trials across Australian barley growing regions were established to test the performance of new varieties under varying agronomy. In 2012 and 2013 there were 3 trials in the Western grains region, 4 trials in the Southern grains region and 2 trials in the Northern grains region annually. This paper will report on the 4 trials from the northern NSW grains region in 2012 and 2013.
In 2012 sites were located at Spring Ridge and Gurley while in 2013 sites were at Pine Ridge and Garah.
2012 | 2013 | |||
|---|---|---|---|---|
Gurley | Spring Ridge | Garah | Pine Ridge | |
Sowing Date | 31/5/2012 | 15/6/2012 | 29/4/13 | 6/6/13 |
Soil Nitrate-N (kg N to 120 cm) | 91 | 110 | 80 | 100 |
Treatments
In 2012 at Spring Ridge six varieties were trialled including, Bass![]() , Buloke
, Buloke![]() , Commander
, Commander![]() , Granger
, Granger![]() , Navigator
, Navigator![]() and Wimmera
and Wimmera![]() . In 2012, Skipper
. In 2012, Skipper![]() and La Trobe
and La Trobe![]() were included at the Gurley site to make eight varieties. In 2013 the varieties included at both sites were Bass
were included at the Gurley site to make eight varieties. In 2013 the varieties included at both sites were Bass![]() , Buloke
, Buloke![]() , Commander
, Commander![]() , Compass
, Compass![]() , Granger
, Granger![]() , La Trobe
, La Trobe![]() , Navigator
, Navigator![]() and Wimmera
and Wimmera![]() . In both years all varieties were sown with target populations of 75, 150 or 300 plants/m2, which was in a factorial trial design with three N rates of 0, 30 and 90 kg N/ha, applied as urea. All N treatments were side banded at planting and no further N applications were made throughout the season.
. In both years all varieties were sown with target populations of 75, 150 or 300 plants/m2, which was in a factorial trial design with three N rates of 0, 30 and 90 kg N/ha, applied as urea. All N treatments were side banded at planting and no further N applications were made throughout the season.
2012 results
Commander![]() and Granger
and Granger![]() were the highest yielding varieties in the Spring Ridge trial with average yields across treatments of 6.3 and 6.2 t/ha, respectively (Figure 1). Bass
were the highest yielding varieties in the Spring Ridge trial with average yields across treatments of 6.3 and 6.2 t/ha, respectively (Figure 1). Bass![]() , Navigator
, Navigator![]() and Wimmera
and Wimmera![]() all had similar yields that were significantly higher than Buloke
all had similar yields that were significantly higher than Buloke![]() , which yielded 5.6 t/ha on average. There were only limited N responses observed at Spring Ridge, which is not surprising given the starting soil N being over 100 kg N/ha. Despite this, the 90 kg N/ha significantly increased grain yield for Commander
, which yielded 5.6 t/ha on average. There were only limited N responses observed at Spring Ridge, which is not surprising given the starting soil N being over 100 kg N/ha. Despite this, the 90 kg N/ha significantly increased grain yield for Commander![]() and Granger
and Granger![]() compared to the 0 N rate (data not shown). There were no other significant differences observed as a result of N application at Spring Ridge (data not shown).
compared to the 0 N rate (data not shown). There were no other significant differences observed as a result of N application at Spring Ridge (data not shown).
Figure 1. Grain yield of six barley varieties grown at populations of 75, 150 and 300 plants/m2 at Spring Ridge in 2012.
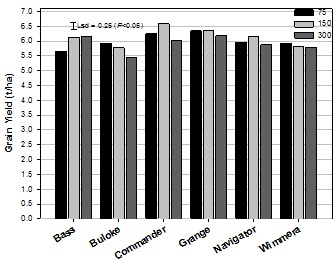
Figure 1 text description: Bass barley showed highest grain yield in the population of 300 plants/m2 at approximately 6.2t/ha and the lowest in the 75 population at approximately 5.7t/ha. Buloke barley showed the highest grain yield in the 75 population at approximately 5.95t/ha and the lowest in the 300 population at approximately 5.45t/ha. Commander barley showed the hightest grain yield in the 150 population at approximately 6.6t/ha and the lowest in the 300 population at approximately 6.0t/ha. Grange barley showed the hightest grain yield in the 75 and 150 populations which were both approximately 6.4t/ha and showed the lowest in the 300 population at approximately 6.2t/ha. Navigator barley showed the highest grain yield in the 150 population at approximately 6.2t/ha and the lowest in the 300 population at approximately 5.9t/ha. Wimmera barley showed the highest grain yield in the 75 population at approximately 5.95t/ha and the lowest in the 300 population at approximately 5.75t/ha.
Increasing plant population from 75 to 150 plants/m2 increased grain yield for Bass![]() and Navigator
and Navigator![]() by 0.42 and 0.34 t/ha, respectively (Figure 1). For all other varieties there was no significant increase in grain yield achieved from higher plant populations. Increasing plant population from 150 to 300 plants/m2 decreased grain yield in Navigator
by 0.42 and 0.34 t/ha, respectively (Figure 1). For all other varieties there was no significant increase in grain yield achieved from higher plant populations. Increasing plant population from 150 to 300 plants/m2 decreased grain yield in Navigator![]() , Commander
, Commander![]() and Buloke
and Buloke![]() by 6, 9 and 7%, respectively. For both Commander
by 6, 9 and 7%, respectively. For both Commander![]() and Buloke
and Buloke![]() this increase in plant population also coincided with a significant increase in the severity of lodging , which may explain some of the yield decline. The same lodging was not observed in Navigator
this increase in plant population also coincided with a significant increase in the severity of lodging , which may explain some of the yield decline. The same lodging was not observed in Navigator![]() .
.
The quick season varieties Skipper![]() and La Trobe
and La Trobe![]() had the highest grain yields at Gurley in 2012, with 4.0 and 3.9 t/ha, respectively, while Commander
had the highest grain yields at Gurley in 2012, with 4.0 and 3.9 t/ha, respectively, while Commander![]() achieved 3.8 t/ha. Wimmera
achieved 3.8 t/ha. Wimmera![]() and Navigator
and Navigator![]() achieved similar yields that were greater than Buloke
achieved similar yields that were greater than Buloke![]() and Bass
and Bass![]() , which had grain yields of 3.4 and 3.3 t/ha, respectively. Granger
, which had grain yields of 3.4 and 3.3 t/ha, respectively. Granger![]() had grain yields 1 t/ha less than that achieved by Commander
had grain yields 1 t/ha less than that achieved by Commander![]() and was the lowest yielding variety. This site had a moderate levels of both crown rot and Pratylenchus thornei in 2012.
and was the lowest yielding variety. This site had a moderate levels of both crown rot and Pratylenchus thornei in 2012.
Despite the target populations the actual populations achieved were 70, 125 and 210 plants/m2. There was no variety interaction with plant population but 125 and 210 plants/m2 resulted in grain yield increases of 0.4 and 0.6 t/ha, respectively, compared to the 70 plants/m2. Skipper![]() and La Trobe
and La Trobe![]() were the only two varieties to have a significant increase in grain yield between the 0 and 90 kg N/ha treatments (Figure 2). There was no significant response in any other variety to N treatments (Figure 2).
were the only two varieties to have a significant increase in grain yield between the 0 and 90 kg N/ha treatments (Figure 2). There was no significant response in any other variety to N treatments (Figure 2).
Figure 2. Grain yield of eight barley varieties grown at three N rates of 0, 30 or 90 kg N/ha at Gurley in 2012.
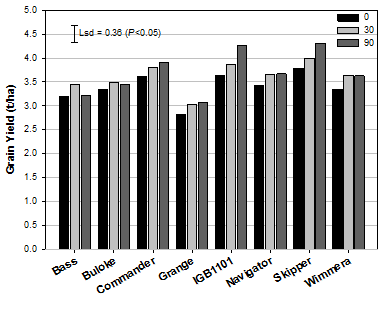
Figure 2 text description: Most varieties showed the hightest grain yield in the 90kg N/ha nitrogen rate. Bass and Buloke were the only two varieties which shoed the highest grain yield being the 30kg N/ha rate. All varieties showed the lowest grain yield in the 0kg N/ha. The highest grain yield was seen in the Skipper barley variety at the 90kg N/ha rate at approximately 4.3t/ha. The lowest grain yield was seen in the Grange barley variety at the 0kg N/ha rate at approximately 2.75t/ha.
The high residual N at the Spring Ridge site meant that there were no varieties with protein values under 14%, which is above the malt specifications of 12% (Table 3). Bass![]() and Wimmera
and Wimmera![]() had the highest protein with 16%, which was 2% greater than the protein achieved by Commander
had the highest protein with 16%, which was 2% greater than the protein achieved by Commander![]() . Although the protein values were approximately 3% lower at Gurley there were similar trends with Bass
. Although the protein values were approximately 3% lower at Gurley there were similar trends with Bass![]() and Wimmera
and Wimmera![]() having the highest protein levels. Commander
having the highest protein levels. Commander![]() and La Trobe
and La Trobe![]() both achieved proteins under 12% at Gurley. Navigator
both achieved proteins under 12% at Gurley. Navigator![]() , Granger
, Granger![]() and Skipper
and Skipper![]() appear to respond similarly in terms of the protein response to N application.
appear to respond similarly in terms of the protein response to N application.
Variety | Protein (%) | Screenings (%) | Retention (%) | Test Weight (kg/hL) |
|---|---|---|---|---|
Bass | 16.1a | 2.2d | 80.6a | 72.4a |
Buloke | 14.6c | 4.7c | 66.1d | 71.3b |
Commander | 14.0d | 4.3c | 75.7b | 69.3c |
Granger | 15.2b | 7.5a | 62.5e | 71.1b |
Navigator | 15.3b | 5.5b | 70.6c | 71.1b |
Wimmera | 16.0a | 7.7a | 62.1e | 70.8b |
Lsd (P=0.05) | 0.3 | 0.4 | 1.3 | 0.5 |
Screenings were relatively low at both sites. However, the Spring Ridge site had higher screenings than Gurley, with Granger![]() and Wimmera
and Wimmera![]() actually exceeding the 7% threshold (Table 3 and 4). Granger
actually exceeding the 7% threshold (Table 3 and 4). Granger![]() also had the highest screenings at Gurley with 4.7%, which was significantly greater than Bass
also had the highest screenings at Gurley with 4.7%, which was significantly greater than Bass![]() that had screenings of 2.2 and 2.6%, respectively. Under the conditions experienced at the Spring Ridge site, high residual N and hot dry finish to the season, it could be expected that the screenings in a variety such as Gairdner
that had screenings of 2.2 and 2.6%, respectively. Under the conditions experienced at the Spring Ridge site, high residual N and hot dry finish to the season, it could be expected that the screenings in a variety such as Gairdner![]() may have been much higher.
may have been much higher.
Bass![]() (80.6%) had the highest retention at Spring Ridge, whilst Skipper
(80.6%) had the highest retention at Spring Ridge, whilst Skipper![]() (93.7%) had the greatest retention at Gurley. Granger
(93.7%) had the greatest retention at Gurley. Granger![]() and Wimmera
and Wimmera![]() had the lowest retention at both sites. At the Spring Ridge site the retentions of Granger
had the lowest retention at both sites. At the Spring Ridge site the retentions of Granger![]() and Wimmera
and Wimmera![]() were both below 70%. There was little variation between the other varieties. Commander
were both below 70%. There was little variation between the other varieties. Commander![]() and Navigator
and Navigator![]() had the lowest test weights at Spring Ridge and Gurley, respectively but they were above 65 kg/hL in both instances. The test weights were similar between the two sites with the better varieties ranging between 70 and 72 kg/hL, which was above the target test weight of 65 kg/hL.
had the lowest test weights at Spring Ridge and Gurley, respectively but they were above 65 kg/hL in both instances. The test weights were similar between the two sites with the better varieties ranging between 70 and 72 kg/hL, which was above the target test weight of 65 kg/hL.
Variety | Protein (%) | Screenings (%) | Retention (%) | Test Weight (kg/hL) |
|---|---|---|---|---|
Bass | 13.4a | 2.6c | 89.1b | 71.3ab |
Buloke | 12.8b | 2.0d | 88.5b | 71.3ab |
Commander | 11.0d | 2.4cd | 89.1b | 70.3c |
Granger | 12.5bc | 4.7a | 82.9d | 70.1cd |
La Trobe | 11.7c | 2.2d | 89.3b | 72.3a |
Navigator | 12.1c | 2.3d | 87.9b | 69.6d |
Skipper | 12.1c | 1.3e | 93.7a | 72.0a |
Wimmera | 13.2ab | 2.9b | 85.2c | 71.6a |
Lsd (P=0.05) | 0.4 | 0.3 | 1.7 | 0.6 |
2013 results
In 2013 the recently released lines Navigator![]() and Compass
and Compass![]() performed well with respect to yield at both sites (Table 5). The yield of Commander
performed well with respect to yield at both sites (Table 5). The yield of Commander![]() was slightly down at the Pine Ridge site but was competitive with the best lines at Garah. In contrast La Trobe
was slightly down at the Pine Ridge site but was competitive with the best lines at Garah. In contrast La Trobe![]() performed better at the Pine Ridge site compared to Garah. Buloke
performed better at the Pine Ridge site compared to Garah. Buloke![]() , a southern line, performed poorly in 2013. Bass
, a southern line, performed poorly in 2013. Bass![]() and Granger
and Granger![]() , both longer season lines, performed well at Pine Ridge but were significantly lower yielding at Garah. When averaged across all treatments, the higher yielding lines had significantly lower proteins at both sites. This meant that on average across all treatments these lines achieved malting protein targets at both sites.
, both longer season lines, performed well at Pine Ridge but were significantly lower yielding at Garah. When averaged across all treatments, the higher yielding lines had significantly lower proteins at both sites. This meant that on average across all treatments these lines achieved malting protein targets at both sites.
Pine Ridge | Garah | |||
|---|---|---|---|---|
Yield (t/ha) | Protein (%) | Yield (t/ha) | Protein (%) | |
Bass | 5.46bcd | 12.0a | 3.12c | 12.9a |
Buloke | 5.05f | 11.0b | 3.10c | 12.6b |
Commander | 5.22ef | 10.3d | 3.51b | 11.2c |
Compass | 5.64ab | 10.1d | 3.61ab | 11.4c |
Granger | 5.40cde | 10.9b | 2.92d | 13.0a |
La Trobe | 5.57abc | 10.3d | 3.05c | 12.4b |
Navigator | 5.67a | 10.6c | 3.67a | 11.2c |
P value | <0.001 | <0.001 | <0.001 | <0.001 |
5% LSD | 0.20 | 0.2 | 0.11 | 0.3 |
Significant yield and protein responses to applied N were found at both sites in 2013 across all varieties (Table 6). At Pine Ridge yield increased by 0.22 and 0.36 t/ha for the 30 and 90 kg N/ha rates while still achieving acceptable levels of protein for malting. At Garah the yield improvement with increasing N rates was between 0.28 and 0.5 t/ha. With respect to protein levels both the control and the 30 kg N/ha were within malting specifications but the 90 kg N/ha resulted in protein levels above the 12.0% upper limit at Garah.
N Rate kg N/ha | Pine Ridge | Garah | ||
|---|---|---|---|---|
Yield (t/ha) | Protein (%) | Yield (t/ha) | Protein (%) | |
0 | 5.23c | 9.9c | 3.00c | 11.0c |
30 | 5.41b | 10.5b | 3.28b | 12.0b |
90 | 5.59a | 11.8a | 3.50a | 13.7a |
Yield responses to varying plant populations in 2013 were strongly dependent on variety. At Pine Ridge significant yield reductions were seen in Buloke![]() , Commander
, Commander![]() , Skipper
, Skipper![]() and Compass
and Compass![]() (Figure 3). All other varieties had no significant response to higher populations. At Garah, the longer season variety Navigator
(Figure 3). All other varieties had no significant response to higher populations. At Garah, the longer season variety Navigator![]() had a significant yield increase with high populations while Skipper
had a significant yield increase with high populations while Skipper![]() had a significant yield decrease at the highest population targeting 300 plants/m2 (data not shown).
had a significant yield decrease at the highest population targeting 300 plants/m2 (data not shown).
Figure 3. Grain yield responses of 8 barley varieties to plant populations at Pine Ridge in 2013. (significant differences indicated by *)
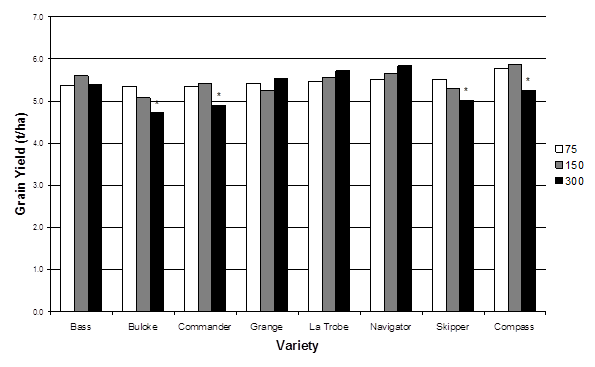
Figure 3 text description: Bass barley showed the highest grain yield in population of 150 at approximately 5.6t/ha and the lowest in the 75 population at approximately 5.3t/ha. Buloke barley showed the highest grain yield in the 75 population at approximately 5.3t/ha and the lowest in the 300 population at approximately 4.65t/ha which was deemed significant. Commander barely showed the highest grain yield in the 150 population at approxiately 5.4t/ha and the lowest in the 300 population at approximately 4.9t/ha which was deemed significant. Grange barely showed the highest grain yield in the 300 population at approximately 5.5t/ha and the lowest in the 150 population at approximately 5.2t/ha. La Trobe barley showed the highest grain yield in the 300 population at approximately 5.7t/ha and the lowest in the 75 population at approximately 5.5t/ha. Navigator barley showed the highest grain yield in the 300 population at approximately 5.8t/ha and the lowest in the 75 population at approximately 5.5t/ha. Skipper barley showed the highest grain yield in the 75 population at approximately 5.5t/ha and the lowest in the 300 population at approximately 5.0t/ha which was deemed significant. Compass barely showed the highest grain yield in the 150 population at approximately 5.85t/ha and the lowest in the 300 population at approximately 5.2t/ha which was deemed significant. Significant differences were only seen in the 300 populations in the Buloke, Commander, Skipper and Compass barely varieties.
Conclusions
Commander![]() continues to perform well in the region in terms of both grain yield and quality. Compass
continues to perform well in the region in terms of both grain yield and quality. Compass![]() has performed very strongly and appears to have improved straw strength. La Trobe
has performed very strongly and appears to have improved straw strength. La Trobe![]() (IGB1101) and Skipper
(IGB1101) and Skipper![]() appear to be quick maturing varieties for consideration in the future which is currently a gap for growers in the region. Navigator
appear to be quick maturing varieties for consideration in the future which is currently a gap for growers in the region. Navigator![]() has also performed well as a longer season malt option and is the most advanced in the malt accreditation process. Apart from Commander
has also performed well as a longer season malt option and is the most advanced in the malt accreditation process. Apart from Commander![]() , all these recently released lines are still undergoing malt accreditation.
, all these recently released lines are still undergoing malt accreditation.
Acknowledgments
The Variety Specific Agronomy Project (DAN00169) is a partnership between NSW DPI and GRDC. The trials would not have been possible without the valuable input of growers and advisors at each location. The trials and data collection were managed by Stephen Morphett, Jim Perfrement, Patrick Mortell, Peter Formann, Jan Hoskings and Rod Bambach (all NSW DPI).
Contact details
Dr Guy McMullen
NSW DPI
Ph: 02 6763 1155![]() 02 6763 1155
02 6763 1155 ![]() 02 6763 1155
02 6763 1155![]() 02 6763 1155
02 6763 1155 ![]() 02 6763 1155
02 6763 1155![]() 02 6763 1155
02 6763 1155 ![]() 02 6763 1155
02 6763 1155![]() 02 6763 1155
02 6763 1155
Email: guy.mcmullen@dpi.nsw.gov.au
Reviewed by
Dr Steven Simpfendorfer
GRDC Project Code: DAN0169: Variety Specific Agronomy Packages,
Was this page helpful?
YOUR FEEDBACK