Selecting cultivars for better use of banded fertilizer
Author: Chris Guppy & Rebecca Haling, School of Environmental and Rural Science, UNE | Date: 05 Mar 2014
Varieties displaying this symbol beside them are protected under the Plant Breeders Rights Act 1994.
Authors
Chris Guppy & Rebecca Haling, School of Environmental and Rural Science, UNE
Take home message
Exploiting genotypic variation for use of banded fertiliser might be an important strategy for improving fertiliser use efficiency. There is variation in response to bands of P fertiliser between at least two wheat cultivars and scope to screen the major cultivars grown in the north. Root proliferation in response to S fertiliser is questionable and requires more research.
The evidence so far
Introduction
Banding phosphorus (P) and nitrogen (N) below the seed is an important strategy to maximise nutrient uptake and root growth. Much work has been done to demonstrate that roots proliferate in response to bands of P and N, and this translates into improved nutrient uptake and crop growth. Yet it is unclear if, or how much, variation exists in the ability of different cereal cultivars to exploit banded P and N. Can we select cultivars with an improved ability to exploit banded fertiliser? And is this response just limited to P and N – or do plants also benefit from banded sulfur (S) and potassium (K)? With recommendations to band nutrients deeper in the profile to replenish depleted reserves, which varieties are best able to take advantage of those new resources?
Methods
At UNE we are adopting a combination of techniques to screen the response of wheat and barley roots to banded fertilisers. High-resolution CT scanning is being used to track the spatial and temporal root growth of a range of cultivars grown with banded fertiliser (Figure 1). Root systems are then washed from soil to verify CT-based measurements, and assess the growth of the whole root system. We are using young seedlings to screen because a) they fit in the scanner (!) and b) early responses to banded nutrients by seedlings are easily measured at this stage. Vertosol soil was used to best measure the phenotypic responses of roots in a real soil, rather than in sand or gel or water as has often occurred in the past. The shoot growth and nutrient uptake by the plants is also measured to match root growth observations to shoot characteristics.
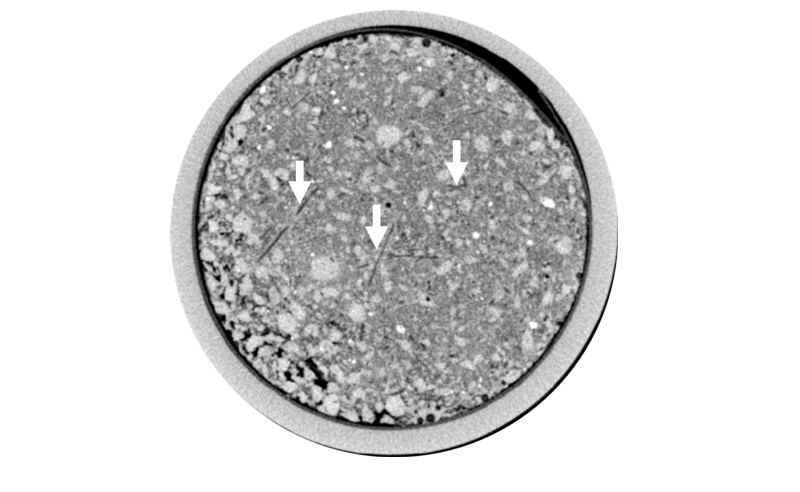
Figure 1. X-ray CT image of wheat roots proliferating in band of phosphorus enriched soil. Arrows point to some of the many roots seen in the horizontal cross-section of the pot.
Results
Work to date has focussed on P and S.
Phosphorus
For P, we have examined the root proliferation responses of the faster growing cv Spitfire with that of the older, slower growing cv Sunvale. The vigorous aboveground growth of Spitfire is mirrored belowground with twice the root length in the band of P fertiliser compared to Sunvale (Figure 2). This in turn translates into greater shoot growth and P uptake (Fig 3). As Spitfire![]() and Sunvale were selected at what we consider opposite ends of the root vigour spectrum there is definitely scope for identifying which varieties are best able to exploit fertiliser bands. Ongoing work is focusing on ranking the top 10 wheat and top 5 barley cultivars in relation to their ability to take up P from bands. Future work will also examine whether these differences are driven by differences in root vigour (i.e. just a faster root growth rate) and/ or differences in root architecture (e.g. higher root branching density in some cultivars).
and Sunvale were selected at what we consider opposite ends of the root vigour spectrum there is definitely scope for identifying which varieties are best able to exploit fertiliser bands. Ongoing work is focusing on ranking the top 10 wheat and top 5 barley cultivars in relation to their ability to take up P from bands. Future work will also examine whether these differences are driven by differences in root vigour (i.e. just a faster root growth rate) and/ or differences in root architecture (e.g. higher root branching density in some cultivars).
Figure 2. Root length to depth of two wheat cultivars grown for 3 weeks in (a) a uniform low P profile or (b) with P banded at 5 cm depth (error bars are standard error; 5 replications).
(Fig 2a)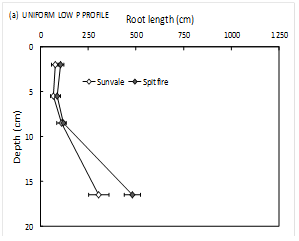 Text description for figure 2a. For Uniform low P profile: Root length to depth of wheat cultivars Sunvale (depth varies from ~2.5cm to ~17.5cm with root length changing from just under 100cm to ~250cm) and Spitfire (depth varies from ~2.5cm to ~17.5cm with root length changing from just under 100cm to almost 500cm) |
(Fig 2b)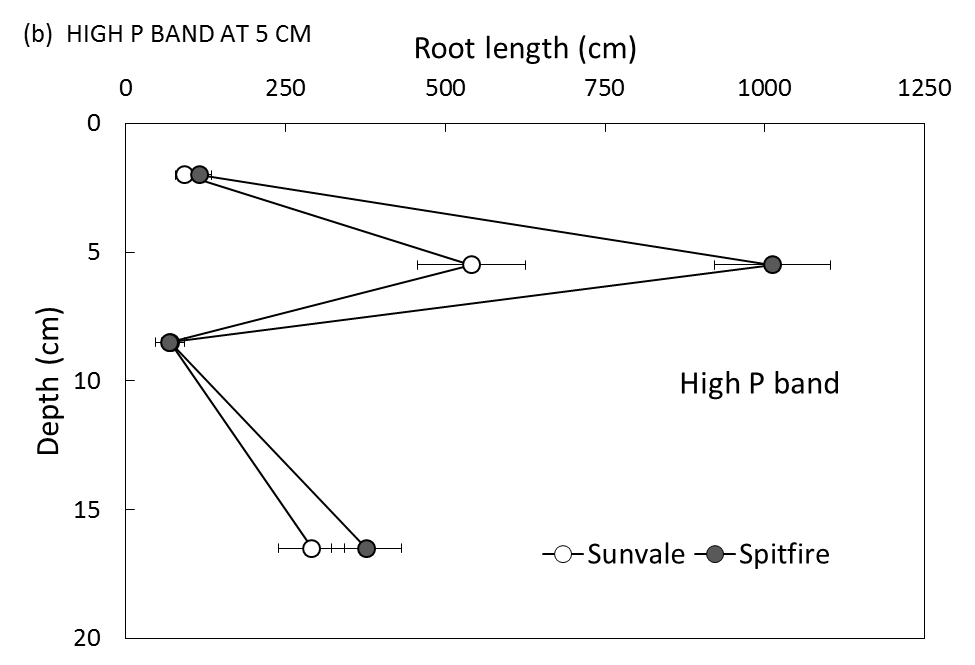 Text description for figure 2b. For High P band at 5cm: Root length to depth of wheat cultivars Sunvale (depth varies from ~2.5cm to ~17.5cm with root length changing from just under 100cm, with a 500cm) and Spitfire (depth varies from ~2.5cm to ~17.5cm with root length changing from just under 100cm with a peak at 1000cm) |
Figure 3. (a) Shoot dry mass and (b) Shoot P uptake of two wheat cultivars grown for 3 weeks in a uniform low P profile (Control) or with P banded at 5 cm depth (High P band; error bars are standard error; 5 replications).
(Fig 3a)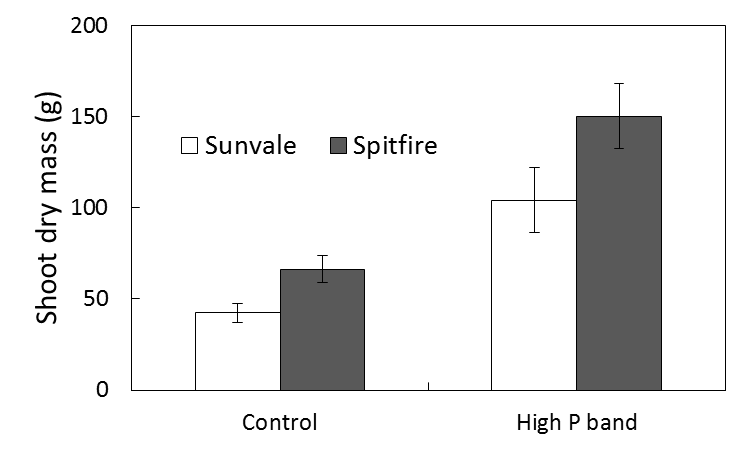 Text description for figure 3a. Shoot dry mass (g) for two wheat cultivars grown for 3 weeks in a uniform low P profile (Control results showed Sunvale shoot dry mass of ~45g and Spitfire showed a shoot dry mass of ~60g) or with P banded at 5 cm depth (High P band results showed Sunvale shoot dry mass of ~100g and Spitfire showed a shoot dry mass of ~150g) |
(Fig 3b)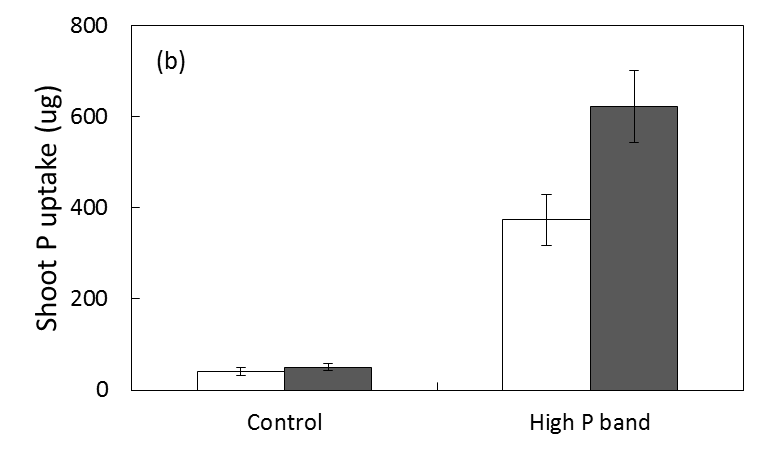 Text description for figure 3b. Shoot P uptake (ug) for two wheat cultivars grown for 3 weeks in a uniform low P profile (Control results showed Sunvale shoot P uptake of ~20ug and Spitfire showed a shoot P uptake of ~25ug) or with P banded at 5 cm depth (High P band results showed Sunvale shoot P uptake of almost 400ug and Spitfire showed a shoot P uptake of ~600g) |
Sulfur
Whilst evidence of root proliferation in response to P and N is extensive, there is no evidence that roots proliferate in concentrated patches of S and K. We have begun tackling that question for S with mixed responses.
In a lighter texture soil (sandy loam), plants grown with banded S took up 40% more S than control plants, but 40% less S than plants adequately supplied with S (Fig 4a). There was no evidence of root proliferation in the band of S fertiliser. This suggests the roots do not proliferate in response to banded S, but that by simply having some volume of the soil fertilised, in which the roots were growing, does allow for more S uptake than unfertilised soil. Presumably, the larger the volume of soil fertilised with S, the better. This effect might be more pronounced in a lighter textured soil where sulfate from a band is more likely to leach, hence increasing the volume of soil effectively fertilised, and the amount of roots growing in soil with higher S concentrations.
In a heavier textured clay soil, we observed no increase in S uptake in response to a banded application of S (Fig 4b). Only plants grown in soil fully fertilised with S showed an increase in S uptake. Interestingly we did observe an increase in root proliferation in the band of S; this was accompanied by increased P uptake and the result suggests that the form in which we applied S (i.e. gypsum) increased the availability of P. Further work is currently being undertaken to confirm this, and to set up experimental conditions that will allow us to apply banded S so that the S remains available, whilst not increasing P availability in the soil.
Figure 4. Shoot sulfur uptake of wheat (cv Gregory) grown for 3 weeks with no S, banded S and uniform high S in (a) light sandy loam and (b) heavy clay soil (error bars are standard deviation; n=5).
(Fig 4a)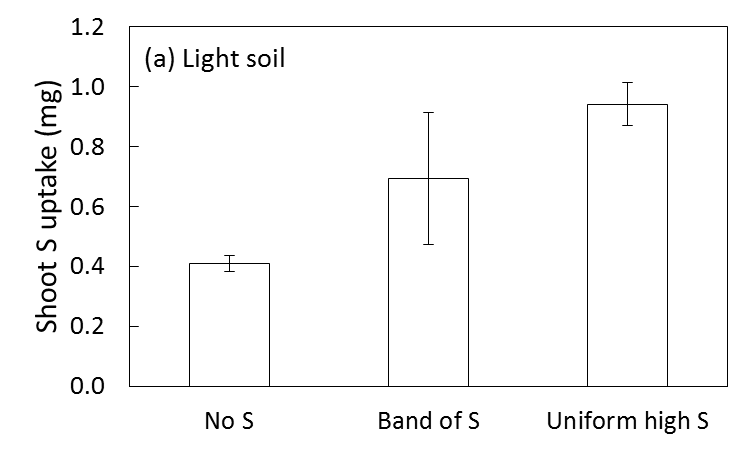 Text description for figure 4a. Shoot S uptake (mg) of wheat grown for 3 weeks in light sandy loam no S showed a shoot S update of ~0.4mg, band of S showed ~0.7mg and uniform high S showed ~1.0mg ) |
(Fig 4b)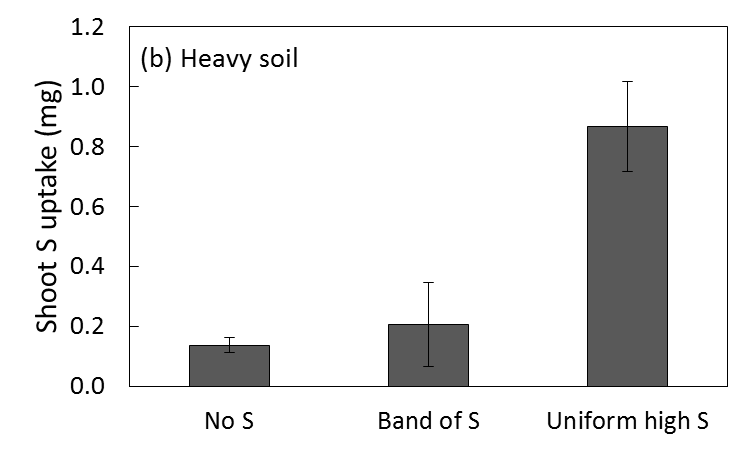 Text description for figure 4b. Shoot S uptake (mg) of wheat grown for 3 weeks in heavy clay soil no S showed a shoot S update of ~0.1mg, band of S showed ~0.2mg and uniform high S showed ~0.8mg ) |
As well as the above work on P and S, we will also be answering the same questions for N and K. Do cultivars like Sunvale and Spitfire![]() also differ in their ability to exploit bands of N? Is banding of K an effective strategy to apply K?
also differ in their ability to exploit bands of N? Is banding of K an effective strategy to apply K?
The results will have important implications for (a) selecting cultivars to maximise the uptake of P and N fertiliser and (b) understand the best application strategy for S and K fertilisers.
Contact details
Chris Guppy
UNE
Ph: 02 6773 3567 ![]() 02 6773 3567
02 6773 3567
Fx: 02 6773 3238
Email: cguppy@une.edu.au
Reviewed by
Richard Flavel
Was this page helpful?
YOUR FEEDBACK