Trends in farm business performance - the stories behind the figures
Author: David Heinjus and Claire Gutsche | Date: 12 Mar 2014
David Heinjus and Claire Gutsche,
Rural Directions Pty Ltd
Take home messages
- Costs are increasing and farm businesses must respond appropriately to ensure future competitiveness.
- Keep business models simple.
- Farms need to continue to increase in scale, but maintain outputs per hectare.
- Organisation skills have a large influence on timeliness of farm operations.
- Top performing businesses leverage from their investment in machinery and labour.
- Advisory boards are starting to influence strategy and accountability.
SnapShotTM
Each year a set of Rural Directions Pty Ltd clients benchmark their business using SnapShot NOWTM and SnapShot PremiumTM. SnapShotTM is a benchmarking database that has been developed using management accounting principles and is based on measuring the financial results from a production year. The purpose of this process is to help each farm business manager understand how their business is performing on a year on year basis. These figures are then aggregated into a whole of state report that is provided back to the client. This provides an indication of performance and is designed to motivate and inspire regarding what might be possible.
Table 1. Profit per business
|
|
12/13 |
11/12 |
10/11 |
|---|---|---|---|
|
Net Profit per business |
Net Profit per business |
Net Profit per business |
|
|
Best result |
$1,702,207 |
$995,754 |
$1,830,117 |
|
Average of the top 10% result |
$980,775 |
$809,705 |
$1,450,706 |
|
Average of ALL farms |
$164,605 |
$157,360 |
$508,542 |
|
Least profitable farm |
-$741,712 |
-$648,193 |
-$132,540 |
|
Number of Farms |
69 |
67 |
60 |
Table 2. Equity and Debt to Income Ratio
|
|
Equity |
Debt to Income Ratio** |
|---|---|---|
|
Best result |
99% |
0:1 |
|
Average of the “most profitable farms” |
86% Range 80- 92% |
0.62:1 Range 0.25 – 1.17 |
|
Average of ALL farms |
82% |
1.14:1 |
|
Poorest result |
47% |
5:1 |
Table 3. Machinery Investment Ratio
|
|
Machinery Investment Ratio |
|---|---|
|
Best result |
0.43:1 |
|
Average of the “most profitable farms” |
0.68:1 Range 0..43 – 1.03 |
|
Average of ALL farms |
0.94:1 |
|
Poorest result |
2.32:1 |
Table 4. Income retained as Net Profit
|
|
12/13 |
11/12 |
10/11 |
|---|---|---|---|
|
Profit as a percentage of income |
Profit as a percentage of income |
Profit as a percentage of income |
|
|
Best result |
54% |
46% |
54% |
|
Average of the 10% “most profitable farms” |
38% Range 31%-54% |
28% Range 19%-46% |
39% Range 21%-53% |
|
Average of ALL farms |
8% |
6% |
31% |
|
Poorest result |
-75% |
-127% |
-7% |
|
Number of Farms |
69 |
67 |
60 |
Table 5. Return on Equity (after imputed labour)
|
|
12/13 |
11/12 |
10/11 |
|---|---|---|---|
|
Return on Equity (after imputed labour) |
Return on Equity (after imputed labour) |
Return on Equity (after imputed labour) |
|
|
Best result |
15% |
15% |
30% |
|
Average of the 10%“most profitable farms” |
10% Range 9.-15% |
7% Range 2 – 15% |
13% Range 6 – 30% |
|
Average of ALL farms |
2% |
2% |
8% |
|
Poorest result |
-18% |
-11% |
-7% |
|
Number |
69 |
67 |
60 |
So what does this all mean?:
- There is a range of performances.
- It is easy to blame rainfall and markets, but many of these farms are in the same region, yet have very different results.
- The top 10%:
- Have higher equity.
- Leverage their investment in machinery to create greater outputs.
- Have simple business models.
- Retain more income as profit.
- Some have significant areas of leased land.
- Have potential to improve outputs.
Total Factor Productivity
Total Factor Productivity (TFP) Growth is an index that looks at the relationship between outputs, inputs capital invested and labour productivity. There is a direct relationship between total factor productivity growth and the competitiveness of an industry. Farm productivity needs to grow at an average of 2% per annum to offset the long term decline in grain growers’ terms of trade.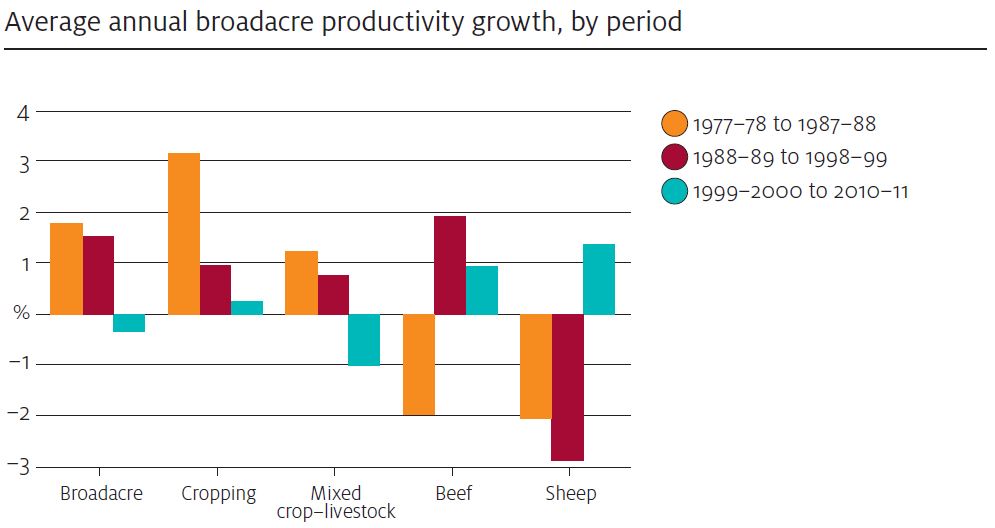
Figure 1. Average annual Total Factor Productivity growth in Australian agriculture (Source: ABARE 2013).
TFP is declining in the national grains industry due to:
- Drought.
- Productivity improvements are not keeping pace with costs.
- A lack of hybrid vigor in new varieties.
- Slow adoption of productivity improving technology.
Specific drivers of TFP growth include:
- Farm management;
- the quality of management and work skills, and
- the ability to access and take advantage of information.
- More productive crop varieties and genetics.
- Better disease, weed and pest control.
- More efficient fertiliser use; notably optimising application rates in cropping.
- Increased scale through farm amalgamation and the use of larger more efficient machinery and technology.
- Improvements to the supply chain that reduce grower costs and create efficient markets.
Trends
The following trends outline the cost and income trends for a group of 10 farm businesses in the lower north of South Australia who have been benchmarking their businesses for the last 14 years.
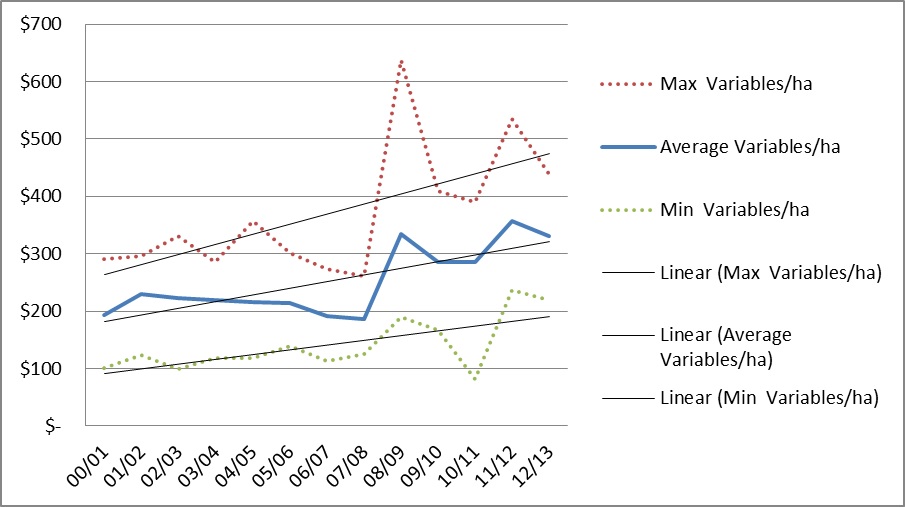
Figure 2. Variable cost trend in the Lower North, South Australia.
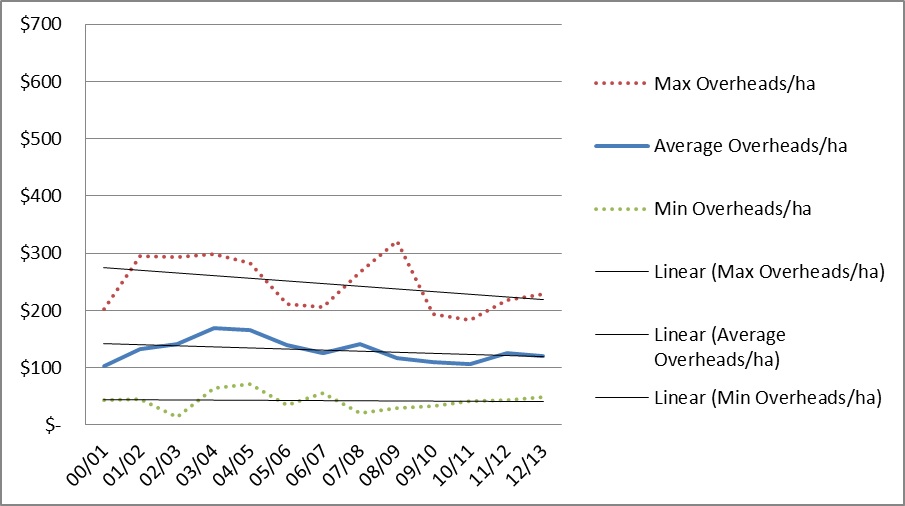
Figure 3. Overhead cost trend in the Lower North, South Australia.
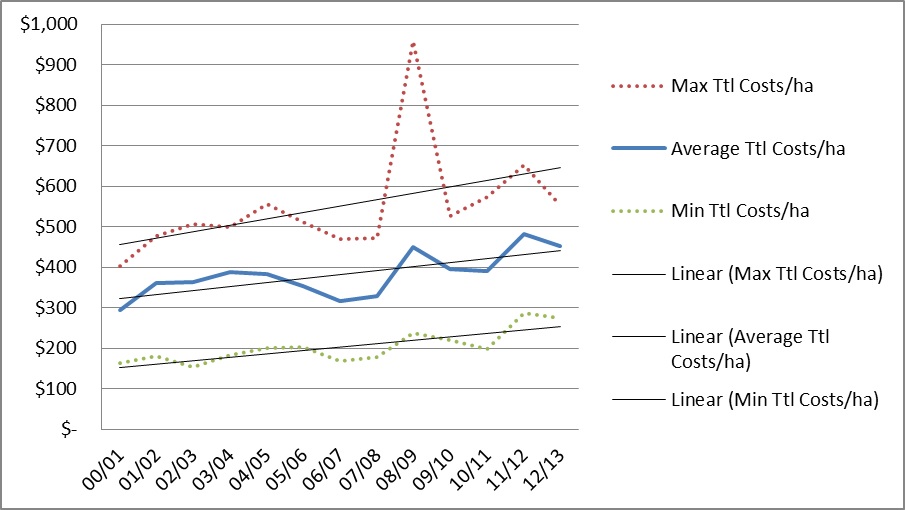
Figure 4. Total cost trend in the Lower North, South Australia.
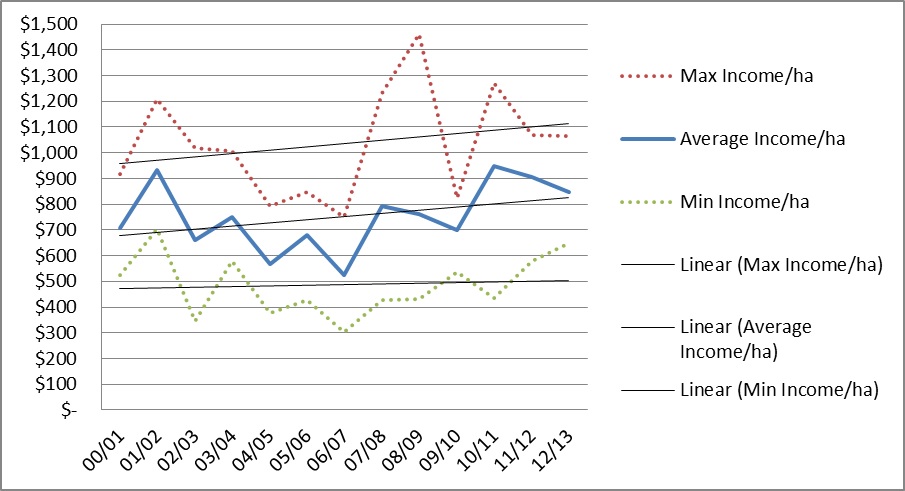
Figure 5. Income trend in the Lower North, South Australia.
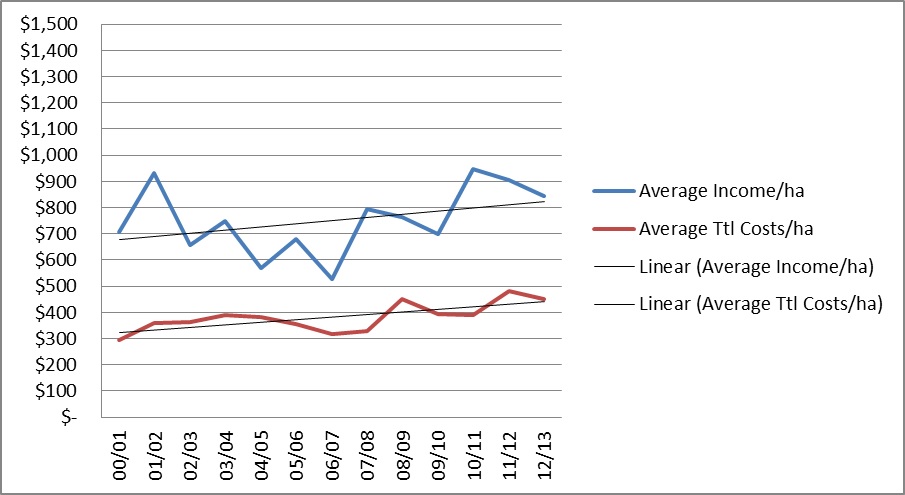
Figure 6. Income and cost trend in the Lower North, South Australia.
Typical ways the top 10% have stayed ahead of the cost trend:
- Business Management Strategy:
- Have an agreed master plan with accountabilities.
- Have a clear and agreed strategic direction.
- Have a shared and agreed culture.
- Balance investment in machinery and use this machinery across a large area.
- Lease land at a lower percentage of market valuation.
- Keep the business model ‘simple’.
- Do not grow enterprises that have a potential for failure (risky crops).
- Identify what is strategically important and then act on it.
- Develop farms to increase outputs, reduce costs, and save time.
Outcome = everybody is on the same page and heading in the same direction.
- Leading and managing people:
- Have a labour structure that is competent, organised and effectively lead.
- Have a labour structure where everyone has clear roles and responsibilities.
- Have a labour resource that is properly resourced, responsive and incentivised for timeliness of operations.
- Have a labour resource that works as a team.
- Move the farm office out of the house.
- Employ to fill any gaps in knowledge and expertise.
- Operations Management:
- Synchronise operations.
- Amalgamate paddocks.
- Organised workshop and office.
- Excellence in time management.
- Attention to detail.
- Excellence in production management and achieving potential outputs.
- Preventative maintenance.
- Development and adoption of business systems.
- Second to adopt new technology and innovation (but still an early adopter).
- Adopt management processes that start to formalise intuitive management.
- Farm financial management:
- Focus on farm management tactics that increase income, reduce costs and save time.
- Actual versus budget analysis.
- Budgeting to test the plan.
- Ensuring accurate and efficient record keeping and systems to enable annual benchmarking and business reviews.
- Aware of key benchmarks.
- Have clear financial objectives regarding income in dollars per hectare.
- Commitment to debt reduction every year.
- Monitor and control costs, such as a three quote policy or purchase orders.
- Business Risk Management:
- Scenario planning the business’s ability to withstand a production shock.
- Managing the 10% of possible outcomes.
- Dismissing the law of averages.
- Understanding probability.
- Use of Advisers:
- Having an advisory board and creating strong corporate governance.
- Outcome:
- Confident decision making.
- Increased probability of success.
- Clear direction.
- Agreed culture.
- Increased profitability.
Financial impact of leasing
Leasing is an excellent way to increase the financial performance of a farm business. However, leasing farms need to be looked at on a case by case basis. Adopting universal strategy can easily be a common pitfall. Appropriate valuation methodologies that investigate the percentage of gross margin need to be undertaken to validate valuations using traditional percentage of a farm’s market value.
Establishing long term leases where collaborative management and development of a property is undertaken is best practice.
Table 6. Financial impact of a lease
| Existing farm | Impact of a drought < 40% on Existing farm | Existing farm - Plus 25% revenue | Existing farm plus lease | Impact of a drought < 40% on Existing Farm and a Lease | Existing Farm and Lease - Plus 25% revenue | |
|---|---|---|---|---|---|---|
| Income | 870,000 | 870,000 | ||||
| Lease income | 279,650 | |||||
| Total Income | 870,000 | 522,000 | 1,087,500 | 1,149,650 | 689,790 | 1,437,063 |
| Variable costs | 390,000 | 390,000 | 420,000 | 520,000 | 520,000 | 560,000 |
| Gross margin | 480,000 | 132,000 | 667,500 | 629,650 | 769,790 | 877,063 |
| Overhead costs | 240,000 | 240,000 | 240,000 | 270,000 | 270,000 | 270,000 |
| Lease payment | 50,000 | 50,000 | 50,000 | |||
| Total Overhead Costs | 240,000 | 240,000 | 240,000 | 320,000 | 320,000 | 320,000 |
| EBITDA | 240,000 | -108,000 | 427,500 | 309,650 | -150,210 | 557,063 |
| Depreciation | 100,000 | 100,000 | 100,000 | 100,000 | 100,000 | 100,000 |
| Interest | 87,000 | 87,000 | 87,000 | 100,000 | 100,000 | 100,000 |
| Farm Profit | 53,000 | -295,000 | 240,500 | 109,650 | -350,210 | 357,063 |
| Drawings | 40,000 | 40,000 | 40,000 | 40,000 | 40,000 | 40,000 |
| Net Profit | 13,000 | -335,000 | 200,500 | 69,650 | -390,210 | 317,063 |
| Business equity | 2,600,000 | |||||
| Return on equity | 0.50% | -12.88% | 7.71% | 2.68% | -15.01% | 12.19% |
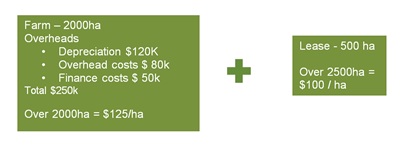
Figure 7. Diagram of the effect leased land has on overhead costs.
Advisory boards
An increasingly common management strategy being adopted by professional farmers is the adoption of an advisory board.
An advisory board involves establishing a panel of advisers who assist a farm management team with:
- Formalising intuitive management.
- Defining strategic issues, an action plan and responsibilities / time frames.
- Accountability and support for change.
- Programmed time for working on the business.
- Defining the preferred “culture” of the business.
- Monitoring annual benchmarking trends.
- Customising a succession plan.
- Oversight of business growth plans.
- The management of risk.
- The development of business policy.
- The development of a human resources strategy.
- Scoping of capital expenditure planning.
- Property development planning and development budgeting.
- Marketing.
- Ensure farm development projects are within accepted business benchmarks.
Typically an advisory board meets between two and four times per year for the purpose of assisting the farm business with their overall management and the integration of production, financial and personal objectives.
It is essential that advisers recognise that every business is different and will have different and often customised strategic issues that require careful planning.
Contact Details
David Heinjus
Rural Directions Pty Ltd
08 8841 4500
Claire Gutsche
Rural Directions Pty Ltd
08 8841 4500
Was this page helpful?
YOUR FEEDBACK