What is driving flowering time differences of wheat varieties between years
Author: Peter Martin, Matt Gardner and Guy McMullen | Date: 05 Mar 2014
GRDC code: DAN167, Variety Specific Agronomy Packages
![]() Varieties displaying this symbol beside them are protected under the Plant Breeders Rights Act 1994.
Varieties displaying this symbol beside them are protected under the Plant Breeders Rights Act 1994.
Authors
Peter Martin, Howqua Consulting and formally with NSW DPI.
Matt Gardner, formally with NSW DPI.
Guy McMullen, NSW DPI, Tamworth.
Take home message
There are large differences in flowering time between years. Gregory was 15 days shorter from sowing to anthesis in 2013 compared to 2012 at Wagga
Varieties generally flower in the same order across years and sowing times
What is driving flowering time differences of wheat varieties between years
Accumulated thermal time has a range of names and can be calculated in a number of ways. We have calculated growing degree days base 5 (GDD5) as
GDD5 = ∑(((Maximum daily temperature+Minimum daily temperature)/2) -5).
Accumulation of GDD5 varies between years. 2012 and 2013 are used here as examples. Tamworth Airport (Figure 1) 2013 was warmer and rate of accumulation of growing degree days was higher than in 2012 until late October. The accumulated difference in GDD5 starting on year day 140 (20th of May) and ending on year day 270 (27 September) was 240 units. Year day 270 corresponds to about the year day Spitfire flowered from 20 May sowing in 2012. The average rate of accumulation of GDD5 in the last two weeks of September at Tamworth in 2013 was 10 per day. The difference of 240 units of GDD5 likely to result in much earlier flowering in 2013 compared to 2012.
Figure 1. Rate of accumulation of growing degree days base 5 at Tamworth Airport in 2012 and 2013.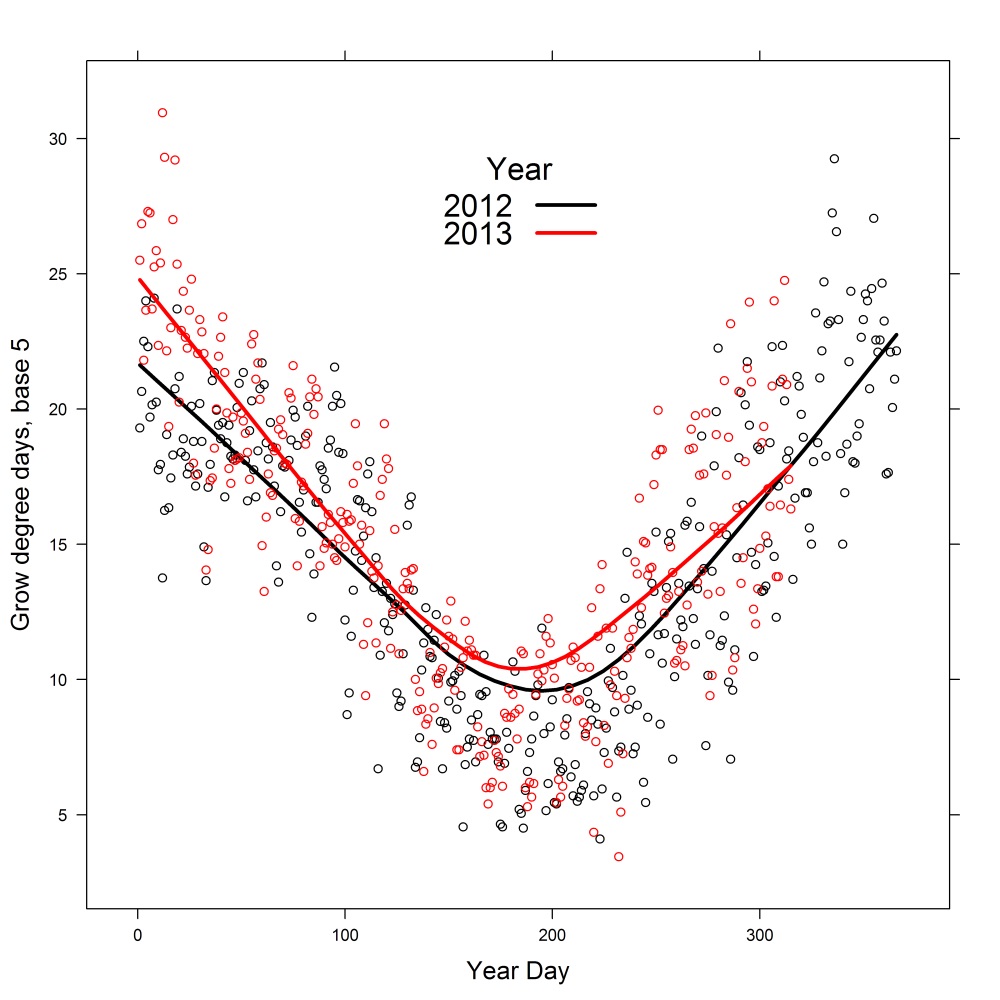
Figure 1 text description: For both 2013 and 2013, the grow degree days decrease from the start of each year till mid year. Then from mid year, both 2012 and 2013 increase till the end of the year. The year 2013 had slightly higher grow degree days than 2012.
Anthesis data was collected from sowing time trials grown at Tamworth in 2012 and Breeza in 2013 in N NSW and at Wagga in 2012 and 2013.
There were differences between years in the days from sowing to anthesis and in the GDD5 from sowing to anthesis. Varieties at Wagga took an average of 98 GDD5 units longer to reach anthesis in 2013 compared to 2012 An example of the GDD5 of varieties in Wagga Wagga trials in 2012 and 2013 is shown in Figure 2. There is no evidence of substantial shifts in ranking of varieties between years or sowing times for number of days or GDD5 to reach anthesis in the trials at Wagga Wagga and Tamworth/Breeza in 2012 and 2013.
Figure 2. Growing Degree Days (base 5) from sowing to anthesis of wheat varieties sown on 3 sowing times at Wagga Wagga in 2012 and 2013.
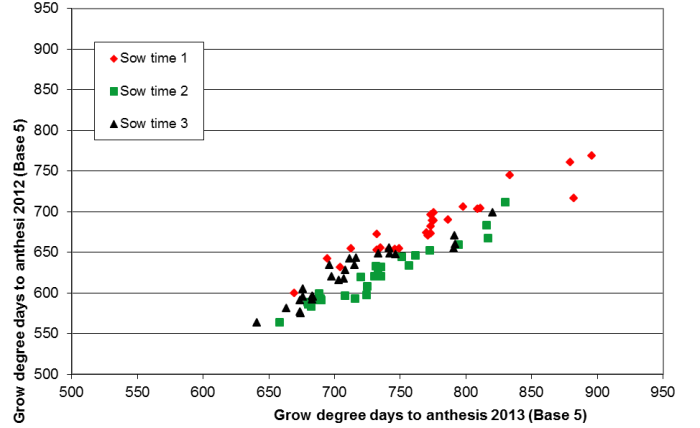
Figure 2 text description: Grow degree days to anthesi for both years increased at the same rate. Sow time 1 had the highest grow degree days to anthesis. Sow time 2 had the lowest grow degree days to anthesis rates.
Sowing time trials were sown on different dates in the different years. Therefore any comparisons of days from sowing to anthesis may be affected. In spite of this limitation of the data it seems that the higher temperatures experienced in 2013 resulted in earlier anthesis in 2013. For example EGA_Gregory![]() was of 15 days faster from sowing to anthesis, averaged across the 3 sowing dates, in 2013 compared to 2012 (Table 1). The time of sowing trials in the Tamworth region were sown at Tamworth in 2012 and Breeza in 2013 so it is not possible to make the same comparisons.
was of 15 days faster from sowing to anthesis, averaged across the 3 sowing dates, in 2013 compared to 2012 (Table 1). The time of sowing trials in the Tamworth region were sown at Tamworth in 2012 and Breeza in 2013 so it is not possible to make the same comparisons.
Although the higher temperatures in 2013 compared to 2012 resulted in lower number of days from sowing to anthesis we have no evidence of changes in relative maturity of the wheat varieties in the sowing time trials.
|
Year |
Variety |
Days from sowing to anthesis/Sowing date |
||
|---|---|---|---|---|
|
7-May |
30-May |
13-Jun |
||
|
2012 |
EGA_Gregory |
152 |
139 |
130 |
|
Livingston |
148 |
134 |
125 |
|
|
Suntop |
152 |
139 |
128 |
|
|
Sunvale |
153 |
140 |
131 |
|
| |
6-May |
6-Jun |
20-Jun |
|
|
2013 |
EGA_Gregory |
136 |
124 |
117 |
|
Livingston |
132 |
119 |
112 |
|
|
Suntop |
136 |
122 |
115 |
|
|
Sunvale |
140 |
126 |
120 |
|
References
Cane, K., Eagles, H. A., Laurie, D. A., Trevaskis, B., Vallance, N., Eastwood, R. F., . . . Martin, P. J. (2013). Ppd-B1 and Ppd-D1 and their effects in southern Australian wheat. Crop and Pasture Science, 64, 100-114.
Eagles, H. A., Cane, K., Kuchel, H., Hollamby, G. J., Vallance, N., Eastwood, R. F., . . . Martin, P. J. (2010). Photoperiod and vernalization gene effects in southern Australian wheat. Crop and Pasture Science, 61(9), 721-730. doi: doi:10.1071/CP10121
Acknowledgements
VSAP is jointly funded by NSW Department of Primary Industries and Grains Research and Development Corporation. The trials were managed by Karl Moore, Stephen Morphett, Jim Perfrement, Patrick Mortell, Peter Formann, Jan Hoskings, Bruce Haigh and Rod Bambach (all NSW DPI).
Contact details
Dr Peter Martin
Howqua Consulting
Ph: 0418 972 105![]()
Email: p.martin56@bigpond.com
NSW Department of Primary Industries
Ph: 02 6763 1100
Email: guy.mcmullen@dpi.nsw.gov.au
GRDC Project Code: DAN 167: Variety Specific Agronomy Packages,
Was this page helpful?
YOUR FEEDBACK